Group Activity in Senate Contests at All-Time High;
Democrats Advantaged in Competitive Senate Races;
Super PACs Heavily Involved
August 24, 2016
![]()
Report Highlights
• Presidential and Senate ads heavily out-numbering ads in other races
• Outside group ad airings in Senate races are at an all-time high
• Ad spending higher than 2012: Dems sponsor own, GOP rely on outside groups
• Hillary Clinton is top ad sponsor so far in the general election
• Impact on media markets since first Trump ad buy
• FL, OH and NC voters are seeing the most presidential ads
• Democrats are running more ads in hotly contested Senate races
• Outside groups make up top 4 advertisers in Senate races
• 70% of pres. ads contain an attack, but still more positive than ads in 2012
• Supplementary SPECIAL REPORT (with CRP) on outside group advertising/disclosure (2000-2016)
![]()
(MIDDLETOWN, CT) August 24, 2016 – An estimated $1.56 billion has been spent so far in the 2015-2016 election cycle on political advertising (Table 1), according to a new analysis by the Wesleyan Media Project. That money has purchased just over 2 million ad airings on local broadcast television since January 1, 2015.[1]
About a third of that total ($517 million) was spent on nearly 610,000 ad airings in the presidential race, while spending on campaigns for U.S. Senate came to $247 million for over 280,000 airings. Spending on races for governor and U.S. House lag behind, clocking in at a little over $80 million apiece. Just over $34 million has been spent on ballot measures so far.
![]()
Table 1: Ad Spending and Airings
| Est. Cost (in Millions) | Airings | |
|---|---|---|
| President | 517 | 609,893 |
| Governor | 86 | 233,566 |
| US House | 83 | 143,423 |
| US Senate | 247 | 280,416 |
| Federal and Governor Total | 934 | 1,267,298 |
| Ballot Measures | 34 | 58,904 |
| Mayor | 0.05 | 153 |
| Attorney General | 3 | 6,836 |
| State Senate | 27 | 58,994 |
| Lt. Governor | 2 | 4,510 |
| Judicial | 21 | 50,026 |
| State Rep. | 12 | 23,310 |
| Grand Total* | 1,560 | 2,032,307 |
| Figures are from January 1, 2015 to August 18, 2016. Numbers include broadcast television (national network and national cable are included in presidential totals). *Figures include policy advertising. CITE SOURCE OF DATA AS: Kantar Media/CMAG with analysis by the Wesleyan Media Project. |
||
Advertising activity in federal races is down from 2012 levels (1.27 million in 2016 compared to 1.39 million in 2012). As shown in Table 2, presidential airings in 2016 are down by 14 percent compared to 2012 cycle-to-date as are U.S. House airings. 2016 senatorial airings are down 32 percent compared to 2014 races, but up by nearly 12 percent over 2010 in which the same seats were being contested six years ago. Gubernatorial airings, in stark contrast, are considerably higher in 2016 than they were in 2012 (233,500 versus 167,000 four year earlier), an increase of 40 percent.
Table 2: Total Airings and Group Activity in Federal and Gubernatorial Races
| Race | Cycle | Airings | % Group |
|---|---|---|---|
| Pres | 2016 | 609,657 | 30.4 |
| 2012 | 712,204 | 39.2 | |
| Senate | 2016 | 280,416 | 49.0 |
| 2014 | 413,251 | 46.5 | |
| 2012 | 338,499 | 37.5 | |
| 2010 | 250,704 | 13.8 | |
| House | 2016 | 143,423 | 12.3 |
| 2014 | 167,810 | 27.0 | |
| 2012 | 167,535 | 23.3 | |
| 2010 | 120,341 | 6.1 | |
| Gov | 2016 | 233,566 | 26.2 |
| 2012 | 166,803 | 26.7 | |
| Figures are from January 1 in year prior to Election Day to August 18 of each cycle. Numbers include broadcast television (national network and national cable are included in presidential totals). CITE SOURCE OF DATA AS: Kantar Media/CMAG with analysis by the Wesleyan Media Project. |
|||
Table 2 also shows that outside group involvement in Senate races is at an all-time high in 2016, accounting for just under 50 percent of all airings to date. In 2014 groups sponsored 46.5 percent of Senate ads through August 18; in 2012 they sponsored 37.5 percent of ads; and in 2010, they sponsored just 13.8 percent of ads. The percentage of ads sponsored by groups is down slightly in the presidential and U.S. House races, but it is holding steady in gubernatorial races at roughly 26 percent in both 2012 and 2016.
Estimated spending in the presidential race is considerably higher than in 2012 at this same point in time (Table 3). The increase from 2012 is over $130 million, though the total number of ad airings is down by about 100,000, a 14.4 percent decrease from the earlier cycle.[2] About 350,000 ads have been aired by or on behalf of Democratic presidential candidates, compared to about 258,000 ads that have been aired by or on behalf of Republican candidates. The vast majority of pro-Democratic advertising in the primaries and general (to date) was sponsored by the candidates themselves (mostly Clinton and Sanders), while the majority of Republican advertising has been sponsored by groups, many of which are organized as super PACs. These groups paid $168 million in 2012 for 250,000 ad airings promoting GOP primary candidates. They paid $215 million in 2016 for a significantly smaller number of airings (143,000).
Table 3: Ad Totals by Race Type and Sponsorship (President)
| 2012 Presidential | |||
| Pro-Democratic Advertising | |||
| Est. Cost (in Millions) | Airings | ||
| Candidate | 96 | 233,894 | |
| Party/Coordinated | 21 | 15,955 | |
| Group | 16 | 29,491 | |
| Pro-Republican Advertising | |||
| Candidate | 54 | 141,920 | |
| Party/Coordinated | 28 | 41,014 | |
| Group | 168 | 249,930 | |
| Total | 383 | 712,204 | |
| 2016 Presidential | |||
| Pro-Democratic Advertising | |||
| Est. Cost (in Millions) | Airings | % Change (Airings) | |
| Candidate | 197 | 309,992 | 32.54% |
| Party/Coordinated | 0 | 0 | - |
| Group | 41 | 41,816 | 41.79% |
| Pro-Republican Advertising | |||
| Candidate | 64 | 114,534 | -19.30% |
| Party/Coordinated | 0 | 0 | - |
| Group | 215 | 143,315 | -42.66% |
| Total | 517 | 609,657 | -14.40% |
| Figures are from January 1, 2015 to August 18, 2016. Numbers include broadcast television, national network and national cable. Table excludes 2,144 ads aired in 2012 by third parties, which is why 2012 total differs from Table 2. CITE SOURCE OF DATA AS: Kantar Media/CMAG with analysis by the Wesleyan Media Project. |
|||
|---|---|---|---|
Table 4 breaks down ad spending by sponsor in the presidential general election, which we define as beginning June 8, 2016, the day after the last presidential primaries (with the exception of the District of Columbia’s Democratic primary on June 14). Hillary Clinton’s campaign has aired over 70,000 ads at an estimated cost of $57 million, while Priorities USA Action, a super PAC supporting Clinton, has aired 28,000 ads at an estimated cost of $26.7 million. As of August 18, the Trump campaign had purchased no ads on broadcast television during the general election period, though on August 19, Trump’s campaign started airing ads in North Carolina, Ohio, Pennsylvania and Florida—19 media markets in total (Table 5 below contains the market breakdown of airings from Friday, August 19 through Sunday August 21).
A pro-Trump super PAC, Rebuilding America Now PAC, however, has filled some of the gap, airing about 5,000 ads at an estimated cost of $5.4 million. The NRA Political Victory Fund has also aired over 3,600 ads supporting Trump.
Green Party candidate Jill Stein had aired only 38 ads, while Purple PAC, which supports Libertarian Party nominee Gary Johnson, has aired only two ads.
![]()
“We haven’t seen a modern presidential campaign that is so lopsided in terms of advertising,” said Erika Franklin Fowler, co-director of the Wesleyan Media Project. “It’s tough to parse out advertising’s contribution to Clinton’s current lead in polls relative to other factors, but there is little doubt that Trump could use more disciplined messaging on air right now – precisely the kind of messaging typically provided by television advertising.”
Table 4: Ad Totals in Presidential Race since June 8
| Sponsor | Affiliation | Est. Cost (in Millions) | Airings |
|---|---|---|---|
| Hillary Clinton | Democrat | 57.0 | 70,724 |
| Priorities USA Action | Democrat | 27.0 | 28,484 |
| Rebuilding America Now PAC | Republican | 5.5 | 4,879 |
| NRA Political Victory Fund | Republican | 3.0 | 3,652 |
| NextGen California Action Committee | Democrat | 2.6 | 2,788 |
| VoteVets | Democrat | 0.8 | 1,491 |
| Women Vote | Democrat | 0.7 | 958 |
| Jill Stein | Green | 0.3 | 38 |
| People for the American Way | Democrat | 0.015 | 34 |
| United Food and Commercial Workers International Union Active Ballot Club | Democrat | 0.016 | 18 |
| American Future Fund | Republican | 0.004 | 2 |
| Purple PAC | Libertarian | 0.022 | 2 |
| Total | 97.0 | 113,070 | |
| Figures are from June 8, 2016 to August 18, 2016. Numbers include broadcast television, national network and national cable. CITE SOURCE OF DATA AS: Kantar Media/CMAG with analysis by the Wesleyan Media Project. |
|||
Table 5, as noted above, displays the presidential advertising activity since Trump’s first general election ad buy on August 19. Markets in Florida (Tampa, Orlando and West Palm Beach) and Ohio (Columbus and Toledo) were competitive, seeing a few more pro-Trump spots than pro-Clinton spots, but Clinton maintained large ad advantages in markets in Pennsylvania, North Carolina, Iowa and Nevada.
Table 5: Top Presidential Markets since First Trump Ad Buy through Aug 21
| Market | State | Pro-Clinton Cand. Airings | Pro-Clinton Group Airings | Pro-Trump Cand Airings | Pro-Trump Group Airings | DemAdv | Total |
|---|---|---|---|---|---|---|---|
| Tampa | FL | 94 | 74 | 53 | 132 | -17 | 353 |
| Orlando | FL | 45 | 69 | 59 | 105 | -50 | 278 |
| Philadelphia | PA | 138 | 79 | 47 | 0 | 170 | 264 |
| West Palm Beach | FL | 74 | 50 | 32 | 96 | -4 | 252 |
| Columbus, OH | OH | 84 | 39 | 36 | 89 | -2 | 248 |
| Charlotte | NC | 93 | 93 | 52 | 0 | 134 | 238 |
| Cleveland | OH | 66 | 52 | 0 | 118 | 0 | 236 |
| Toledo | OH | 62 | 35 | 25 | 81 | -9 | 203 |
| Greensboro | NC | 75 | 71 | 36 | 12 | 98 | 194 |
| Dayton | OH | 53 | 39 | 29 | 45 | 18 | 166 |
| National Cable | 114 | 0 | 0 | 36 | 78 | 150 | |
| Pittsburgh | PA | 78 | 29 | 30 | 7 | 70 | 144 |
| Raleigh | NC | 49 | 47 | 24 | 18 | 54 | 138 |
| Wilkes Barre | PA | 70 | 34 | 0 | 13 | 91 | 117 |
| Las Vegas | NV | 66 | 50 | 0 | 0 | 116 | 116 |
| Des Moines | IA | 74 | 38 | 0 | 0 | 112 | 112 |
| Cedar Rapids | IA | 76 | 28 | 0 | 0 | 104 | 104 |
| Jacksonville | FL | 49 | 0 | 44 | 0 | 5 | 93 |
| Youngstown | OH | 49 | 0 | 0 | 44 | 5 | 93 |
| Reno | NV | 44 | 38 | 0 | 10 | 72 | 92 |
| Cincinnati | OH | 50 | 0 | 41 | 0 | 9 | 91 |
| Harrisburg | PA | 48 | 0 | 38 | 0 | 10 | 86 |
| Davenport | IA | 38 | 21 | 0 | 0 | 59 | 59 |
| Lima | OH | 29 | 0 | 30 | 0 | -1 | 59 |
| Denver | CO | 6 | 46 | 0 | 0 | 52 | 52 |
| Johnstown | PA | 45 | 0 | 0 | 5 | 40 | 50 |
| Omaha | NE | 50 | 0 | 0 | 0 | 50 | 50 |
| Ft. Myers | FL | 49 | 0 | 0 | 0 | 49 | 49 |
| Panama City | FL | 25 | 0 | 21 | 0 | 4 | 46 |
| Boston | MA | 32 | 4 | 0 | 0 | 36 | 36 |
| Manchester, NH | NH | 20 | 16 | 0 | 0 | 36 | 36 |
| Colorado Springs | CO | 4 | 26 | 0 | 0 | 30 | 30 |
| Mobile | AL | 15 | 0 | 11 | 0 | 4 | 26 |
| Tallahassee | FL | 24 | 0 | 0 | 0 | 24 | 24 |
| Greenville, SC | SC | 0 | 0 | 15 | 7 | -22 | 22 |
| National Network | 19 | 0 | 0 | 0 | 19 | 19 | |
| Wilmington | NC | 0 | 0 | 19 | 0 | -19 | 19 |
| New Orleans | LA | 12 | 0 | 0 | 0 | 12 | 12 |
| Honolulu | HI | 9 | 0 | 0 | 0 | 9 | 9 |
| Gainesville | FL | 8 | 0 | 0 | 0 | 8 | 8 |
| Figures are from August 19 to August 21, 2016. Numbers include broadcast television (national network and national cable are included as separate markets). CITE SOURCE OF DATA AS: Kantar Media/CMAG with analysis by the Wesleyan Media Project. |
|||||||
In the presidential general election, the Tampa media market has seen the most ads since June 8, a total of 6,553 (Table 6). It is followed by Orlando, with 5,723 ad airings. Cleveland, Ohio has seen just over 5,000 ad airings. Markets in North Carolina, Nevada, Colorado, Iowa, Virginia and Pennsylvania also appear among the top 20 media markets.
![]()
“Judging by where advertisers are putting their money, Florida, Ohio and North Carolina are the biggest presidential battlegrounds in 2016,” said Michael Franz, co-director of the Wesleyan Media Project. “These swing states have not changed much, if any, from four years ago.”
Table 6: Top Media Markets in Presidential General Election Race (Overall)
| Market | State | Airings | Est. Cost (in Millions) |
|---|---|---|---|
| Tampa | FL | 6,553 | 7.4 |
| Orlando | FL | 5,723 | 7.4 |
| Cleveland | OH | 5,092 | 4.9 |
| Charlotte | NC | 4,697 | 3.6 |
| West Palm Beach | FL | 4,623 | 3.0 |
| Las Vegas | NV | 4,299 | 3.1 |
| Columbus | OH | 4,267 | 3.3 |
| Reno | NV | 3,903 | 1.7 |
| Denver | CO | 3,590 | 3.1 |
| Raleigh | NC | 3,501 | 2.5 |
| Des Moines | IA | 3,466 | 1.9 |
| Toledo | OH | 3,312 | 1.8 |
| Dayton | OH | 3,265 | 1.6 |
| Greensboro | NC | 3,177 | 1.1 |
| Jacksonville | FL | 3,133 | 1.3 |
| Cedar Rapids | IA | 3,061 | 1.3 |
| Richmond | VA | 2,901 | 1.4 |
| Philadelphia | PA | 2,844 | 2.4 |
| Norfolk | VA | 2,734 | 1.3 |
| Roanoke | VA | 2,572 | 0.7 |
| Cincinnati | OH | 2,490 | 1.3 |
| Youngstown | OH | 2,410 | 1.0 |
| Colorado Springs | CO | 2,158 | 1.1 |
| Ft. Myers | FL | 2,137 | 1.0 |
| Pittsburgh | PA | 2,029 | 1.6 |
| Wilkes Barre | PA | 1,839 | 0.5 |
| Wilmington | NC | 1,444 | 0.2 |
| Mobile | AL | 1,290 | 0.5 |
| Panama City | FL | 1,276 | 0.2 |
| Boston | MA | 1,257 | 0.7 |
| Greenville | NC | 1,245 | 0.4 |
| Harrisburg | PA | 1,200 | 0.5 |
| Davenport | IA | 1,193 | 0.9 |
| Omaha | NE | 1,170 | 0.3 |
| Manchester | NH | 1,143 | 1.9 |
| JJohnstown | PA | 906 | 0.3 |
| Tri-Cities | TN | 891 | 0.4 |
| Tallahassee | FL | 759 | 0.2 |
| Lima | OH | 532 | 0.05 |
| Ottumwa | IA | 457 | 0.03 |
| Charlottesville | VA | 436 | 0.06 |
| San Francisco | CA | 369 | 0.6 |
| Los Angeles | CA | 364 | 1.0 |
| Greenville | SC | 316 | 0.2 |
| San Diego | CA | 315 | 0.3 |
| Gainesville | FL | 314 | 0.05 |
| Fresno | CA | 303 | 0.2 |
| Bakersfield | CA | 296 | 0.06 |
| Palm Springs | CA | 271 | 0.07 |
| Monterey | CA | 269 | 0.06 |
| Wheeling-Steubenville | WV | 225 | 0.04 |
| Sacramento | CA | 210 | 0.3 |
| Yuma-El Centro | AZ | 208 | 0.01 |
| Harrisonburg | VA | 188 | 0.04 |
| Bangor | ME | 163 | 0.05 |
| Parkersburg | WV | 128 | 0.04 |
| Santa Barbara | CA | 91 | 0.06 |
| Chico-Redding | CA | 51 | 0.02 |
| Figures are from June 8, 2016, to August 18, 2016. Numbers include broadcast television. CITE SOURCE OF DATA AS: Kantar Media/CMAG with analysis by the Wesleyan Media Project. |
|||
Ohio, Pennsylvania and Wisconsin Hottest Senate Races
Table 7 shows the number of ads supporting Democratic candidates and Republican candidates that have aired in the general election in each race, regardless of the sponsor (candidates, parties and groups). The table also shows estimated spending by each side in the general election. The race for Senate in Ohio has seen, by far, the most ads aired and the most spending. Over 46,000 ads have aired in the Buckeye State, where Republican candidate Rob Portman holds a considerable advantage of about 12,000 ad airings over Democratic candidate Ted Strickland. Ad spending in the general election there is estimated at $35 million.
The situation is reversed in neighboring Pennsylvania, where Democrat Katie McGinty has benefitted from about 15,000 more ad airings than her Republican opponent, Pat Toomey. Democrat Russ Feingold leads in terms of general election ad airings over his Republican opponent, Ron Johnson.
![]()
“With the exception of Ohio, Democrats have been able to air more ads than Republicans in the most competitive Senate races,” said Travis N. Ridout, co-director of the Wesleyan Media Project. “This may reflect enthusiasm on the part of Democrats who anticipate gains—and perhaps even a takeover—in the Senate.”
![]()
In many of the most competitive Senate races, groups have dominated advertising. In Ohio, Pennsylvania, and New Hampshire, groups sponsored more than 80 percent of ad airings, and in Nevada and Colorado, groups sponsored more than 60 percent of ad airings.
![]()
Table 7: Top U.S. Senate Races by Volume and Cost of Ads
| State | Dem ads | Dem % Group | Dem $s (Ms) | Rep Ads | Rep % Group | Rep $s (Ms) | Total Ads | Total $s (Ms) | % Group |
|---|---|---|---|---|---|---|---|---|---|
| OH | 17,632 | 96.8 | 13.3 | 29,234 | 83.4 | 21.9 | 46,866 | 35.2 | 88.4 |
| PA | 14,586 | 84.3 | 17.4 | 10,496 | 87.0 | 9.5 | 25,082 | 26.9 | 85.4 |
| WI | 11,500 | 28.6 | 5.4 | 4,986 | 57.3 | 4.5 | 16,486 | 9.9 | 37.2 |
| IN | 8,780 | 0.0 | 3.0 | 4,870 | 51.9 | 2.1 | 13,650 | 5.1 | 18.5 |
| NV | 5,921 | 62.9 | 3.7 | 5,543 | 74.1 | 3.8 | 11,464 | 7.5 | 68.3 |
| FL | 1,573 | 0.0 | 1.6 | 5,580 | 59.3 | 5.3 | 7,153 | 6.9 | 46.3 |
| NH | 2,579 | 100.0 | 6.0 | 4,088 | 72.4 | 8.2 | 6,667 | 14.2 | 83.1 |
| MO | 940 | 0.0 | 0.3 | 3,592 | 36.4 | 2.5 | 4,532 | 2.8 | 28.9 |
| IL | 1,238 | 0.0 | 1.2 | 1,934 | 77.4 | 1.9 | 3,172 | 3.1 | 47.2 |
| CO | 1,883 | 43.7 | 1.6 | 1,139 | 100.0 | 0.5 | 3,022 | 2.1 | 61.1 |
| AZ | 1,336 | 0.0 | 1.0 | 1,345 | 14.2 | 1.3 | 2,681 | 2.4 | 5.0 |
| Figures are from the start of the general election in each state to August 18, 2016. Numbers include broadcast television. CITE SOURCE OF DATA AS: Kantar Media/CMAG with analysis by the Wesleyan Media Project. |
|||||||||
Figure 1: Top U.S. Senate Races
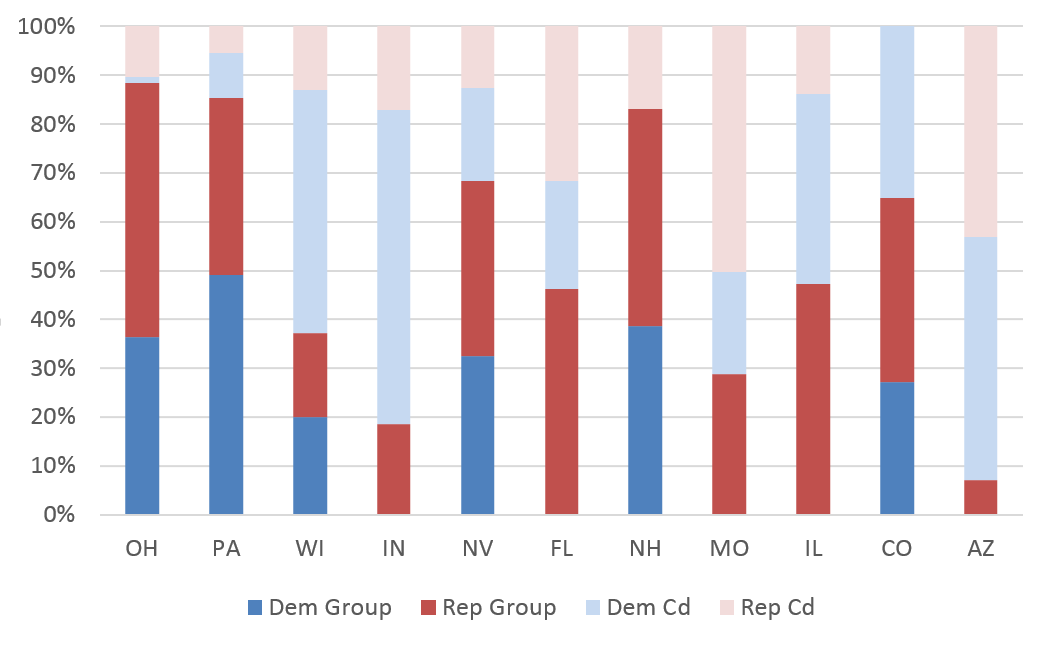
Figures are from the start of the general election in each state to August 18, 2016.
Numbers include broadcast television.
CITE SOURCE OF DATA AS: Kantar Media/CMAG with analysis by the Wesleyan Media Project.
![]()
![]()
Turning to all Senate advertising (not just general election advertising), Table 8 shows that the top four advertisers in Senate races were outside groups. The Democratic-supporting Senate Majority PAC has aired the most ads in Senate races this cycle, just over 20,000, while the Republican-supporting One Nation has aired over 18,000 ads. Russ Feingold, who is running for Senate in Wisconsin, is the top candidate advertiser, having aired over 12,000 spots.
Table 8: Top Advertisers in Senate Races
| Sponsor | Party | Est. Cost (in Millions) | Airings | Races |
|---|---|---|---|---|
| Senate Majority PAC | Dem | 21.1 | 20,639 | FL, NH, NV, OH, PA |
| One Nation | Rep | 23.2 | 18,043 | IA, IN, MO, NC, NH, NV, OH, PA |
| Freedom Partners Action Fund | Rep | 12.0 | 14,873 | IN, NV, OH, PA, WI |
| U.S. Chamber of Commerce | Rep | 15.7 | 12,271 | AZ, FL, IL, IN, NH, NV, OH, PA, WI |
| Feingold, Russ | Dem | 3.9 | 12,213 | |
| Fighting For Ohio Fund | Rep | 5.2 | 8,655 | OH |
| Shelby, Richard | Rep | 5.7 | 8,631 | |
| McGinty, Katie | Dem | 5.4 | 7,422 | |
| Women Vote | Dem | 10.8 | 6,613 | MD, NH, PA |
| Beruff, Carlos | Rep | 5.5 | 6,605 | |
| Bayh, Evan | Dem | 2.4 | 6,094 | |
| Masto, Catherine Cortez | Dem | 3.2 | 5,865 | |
| Harris, Kamala | Dem | 6.0 | 5,145 | |
| Van Hollen, Chris | Dem | 5.4 | 5,046 | |
| AFSCME People | Dem | 6.4 | 5,003 | OH |
| Democratic Senatorial Campaign Committee | Dem | 1.8 | 4,769 | IN, PA |
| Graham, Jack | Rep | 2.0 | 4,675 | |
| Johnson, Ron | Rep | 2.2 | 4,623 | |
| Bennet, Michael | Dem | 3.8 | 4,616 | |
| Sanchez, Loretta | Dem | 2.5 | 4,488 | |
| Group % of top 20 | 51.78% | |||
| Figures are from Jan 1, 2015 to August 18, 2016. Numbers include broadcast television, national network and national cable television. CITE SOURCE OF DATA AS: Kantar Media/CMAG with analysis by the Wesleyan Media Project. | ||||
As noted earlier (see Table 2) 2016 Senate advertising is down compared to 2014 levels, but up from 2010 when the seats were last contested. This cycle, 280,000 ads have aired in Senate races, well short of the 413,000 ads that had aired by this date in 2014. Although groups have sponsored fewer ads in 2016 than they did in 2014 (137,000 compared to 192,000), the biggest decline is in candidate-sponsored ads, which are about 80,000 fewer than two years ago.
The volume of advertising is also down from 2014 in U.S. House races, though not by as much. The 143,000 House ads aired to this point are about 24,000 fewer than had aired to this point in 2014. Unlike in the Senate races, candidate advertising is still most prominent.
![]()
Super PACs Active in Senate, Presidential Races; 501cs Nearly Half of All Group Ads in Senate Races
Table 9 breaks down the group-sponsored advertising by its organizational type and the type of race. Groups have accounted for only 12.3 percent of the ads aired so far in House races, but groups’ share of advertising has been 30.4 in the presidential race and 49.0 percent in Senate races. Across the board, super PACs have sponsored the plurality of group-sponsored advertising, accounting for 47.0 percent of group-sponsored ad airings in Senate races (where 501cs have also been active), 68.2 percent of group-sponsored ad airings in House races and 90.1 percent of group-sponsored ad airings in the presidential race.
![]()
Table 9: Volume of Group-sponsored Ads by Group Type and Race Type
| Ads aired | % of all ads | % of grp ads | ||
|---|---|---|---|---|
| House | ||||
| Group Ads (total) | 17,614 | 12.28% | ||
| Super PACs | 12,006 | 68.16% | ||
| 501cs | 4,318 | 24.51% | ||
| PACs | 1,047 | 5.94% | ||
| Senate | ||||
| Group Ads (total) | 137,311 | 48.97% | ||
| Super PACs | 64,577 | 47.03% | ||
| 501cs | 61,475 | 44.77% | ||
| PACs | 10,225 | 7.45% | ||
| President | ||||
| Group Ads (total) | 185,287 | 30.38% | ||
| Super PACs | 166,999 | 90.13% | ||
| 501cs | 13,351 | 7.21% | ||
| PACs | 4,472 | 2.41% | ||
| Figures are from Jan 1, 2015 to August 18, 2016. Numbers include broadcast television, national network and national cable television. CITE SOURCE OF DATA AS: Kantar Media/CMAG with analysis by the Wesleyan Media Project. Disclosure information from the Center for Responsive Politics. |
||||
“With the presidential election garnering so much of the media and the public’s attention, the real ad fight is in down-ballot races,” said Sheila Krumholz, executive director of the Center for Responsive Politics, “And what we’re seeing there, especially in Senate contests, is that dark money groups are buying tens of thousands of ads — and they’re doing so without any donor disclosure and, often, without even reporting their spending their spending to the FEC.”
![]()
Outside group activity as a proportion of all federal advertising is at an all-time high (32.5 percent) in 2016. See our SPECIAL REPORT (co-authored with the Center for Responsive Politics) on outside group advertising and trends related to disclosure, which examines 2.4 million group airings from 2000-2016.
![]()
North Carolina, Indiana Lead in Governor’s Races
Races for governor are also heating up, with almost 15,000 ads having been aired in North Carolina and Indiana (Table 10). Groups have been heavily involved in the North Carolina gubernatorial race, sponsoring 40 percent of the ad airings, though to this point groups have not advertised in Indiana. In both states, Democrats have a small advantage in terms of the number of ads aired. In Montana, which has seen over 10,000 ad airings, Republican Greg Gianforte has benefitted from about 3,000 more ads than incumbent Democrat Steve Bullock.
![]()
Table 10: Top Governor Races by Volume and Cost of Ads
| State | Dem ads | Dem Cost (in Millions) | Rep ads | Rep Cost (in Millions) | Total ads | Total Cost (in Millions) | % Group |
|---|---|---|---|---|---|---|---|
| NC | 8,809 | 5.6 | 6,094 | 2.0 | 14,903 | 7.7 | 40.4 |
| IN | 7,973 | 2.9 | 6,762 | 2.0 | 14,735 | 4.9 | 0.0 |
| MT | 3,491 | 0.7 | 6,592 | 1.0 | 10,083 | 1.7 | 23.6 |
| MS | 0 | 0.0 | 2,535 | 0.7 | 2,535 | 0.7 | 0.0 |
| WV | 226 | 0.09 | 2,051 | 0.4 | 2,277 | 0.5 | 9.9 |
| MO | 531 | 0.2 | 684 | 0.3 | 1,215 | 0.5 | 0.0 |
| VT | 0 | 0.0 | 457 | 0.1 | 457 | 0.1 | 34.6 |
| UT | 38 | 0.1 | 84 | 0.06 | 122 | 0.2 | 0.0 |
| Figures are from the start of the general election in each state to August 18, 2016. Numbers include broadcast television. CITE SOURCE OF DATA AS: Kantar Media/CMAG with analysis by the Wesleyan Media Project. |
|||||||
70 Percent of Presidential Ads Contain an Attack
Table 11 speaks to the tone of the 2016 campaign. About half of presidential ads are pure negative ads—containing only discussion of an opponent—while another 20 percent are contrast ads, which mention both an opponent and a favored candidate. Thirty percent of presidential ads have been positive, focusing solely on the favored candidate. Although the presidential race has been largely negative in 2016, it has been more positive than the 2012 race, in which only 14 percent of ads aired by this point were positive.
Advertising in Senate races has been only slightly more positive than advertising in the presidential race, while races for House have been largely positive, with 74 percent of ads being positive.
![]()
Table 11: Tone in Federal and Gubernatorial Races (as a percentage of airings)
| 2016 | ||||
| Pres | US Senate | US House | Gov | |
| Negative | 49.8 | 47.1 | 13.1 | 39.6 |
| Contrast | 19.7 | 16.0 | 12.9 | 5.3 |
| Positive | 30.5 | 36.9 | 74.0 | 55.1 |
| 2012 | ||||
| Pres | US Senate | US House | Gov | |
| Negative | 66.6 | 46.8 | 16.6 | 6.0 |
| Contrast | 19.6 | 20.5 | 11.3 | 14.2 |
| Positive | 13.8 | 32.7 | 72.1 | 79.8 |
| Figures are from June 8 to August 18 of each year. Numbers include broadcast television (and national cable for presidential races). CITE SOURCE OF DATA AS: Kantar Media/CMAG with analysis by the Wesleyan Media Project. |
||||
|---|---|---|---|---|
![]()
Download a PDF of this report here
![]()
About This Report
Data reported here do not cover local cable buys, only broadcast television, national network and national cable buys. We include all ads that mention individuals running for office, and therefore sums may include issue advocacy advertising. All cost estimates are precisely that: estimates. Disclosure categorization information on outside groups comes from the Center for Responsive Politics.
The Wesleyan Media Project provides real-time tracking and analysis of all political television advertising in an effort to increase transparency in elections. Housed in Wesleyan’s Quantitative Analysis Center – part of the Allbritton Center for the Study of Public Life – the Wesleyan Media Project is the successor to the Wisconsin Advertising Project, which disbanded in 2009. It is directed by Erika Franklin Fowler, associate professor of government at Wesleyan University, Michael M. Franz, associate professor of government at Bowdoin College and Travis N. Ridout, professor of political science at Washington State University. WMP staff include Laura Baum (Project Manager), Dolly Haddad (Project Coordinator) and Matthew Motta (Research Associate).
The Wesleyan Media Project is supported by grants from The John S. and James L. Knight Foundation and Wesleyan University. Data provided by Kantar Media/CMAG with analysis by the Wesleyan Media Project using Academiclip, a web-based coding tool. The Wesleyan Media Project is partnering this year with both the Center for Responsive Politics, to provide added information on outside group disclosure, and Ace Metrix, to assess ad effectiveness.
Periodic releases of data will be posted on the project’s website and dispersed via Twitter @wesmediaproject.
![]()
For more information contact:
Heather Tolley-Bauer, htolleybauer@wesleyan.edu, (860) 398-9018
![]()
About Wesleyan University
Wesleyan University, in Middletown, Conn., is known for the excellence of its academic and co-curricular programs. With more than 2,900 undergraduates and 200 graduate students, Wesleyan is dedicated to providing a liberal arts education characterized by boldness, rigor and practical idealism. For more, visit www.wesleyan.edu.
About the John S. and James L. Knight Foundation
Knight Foundation supports transformational ideas that promote quality journalism, advance media innovation, engage communities and foster the arts. We believe that democracy thrives when people and communities are informed and engaged. For more, visit www.knightfoundation.org.
About the Center for Responsive Politics
The Center for Responsive Politics is the nation’s premier research group tracking money in U.S. politics and its effect on elections and public policy. Nonpartisan, independent and nonprofit, the organization aims to create a more educated voter, an involved citizenry and a more transparent and responsive government. CRP’s award-winning website, OpenSecrets.org, is the most comprehensive resource available anywhere for federal campaign contribution and lobbying data and analysis.
![]()
[1] CORRECTION: because of a denominator error excluding policy ads in 2012, a previous version of this release incorrectly stated that advertising in 2016 was up over 2012 by 9 percent. Advertising is down by 16 percent in 2016 compared to 2012 when policy ads are included, and down by 6 percent when policy ads are excluded. — back to report
[2] The table excludes 2,144 ads aired in 2012 by advocates of third parties. Those totals account for the difference in reported volume in 2012 between Tables 2 and 3. — back to report


