Photo Gage Skidmore/flickr
GOP candidates get significant backing from super PACs
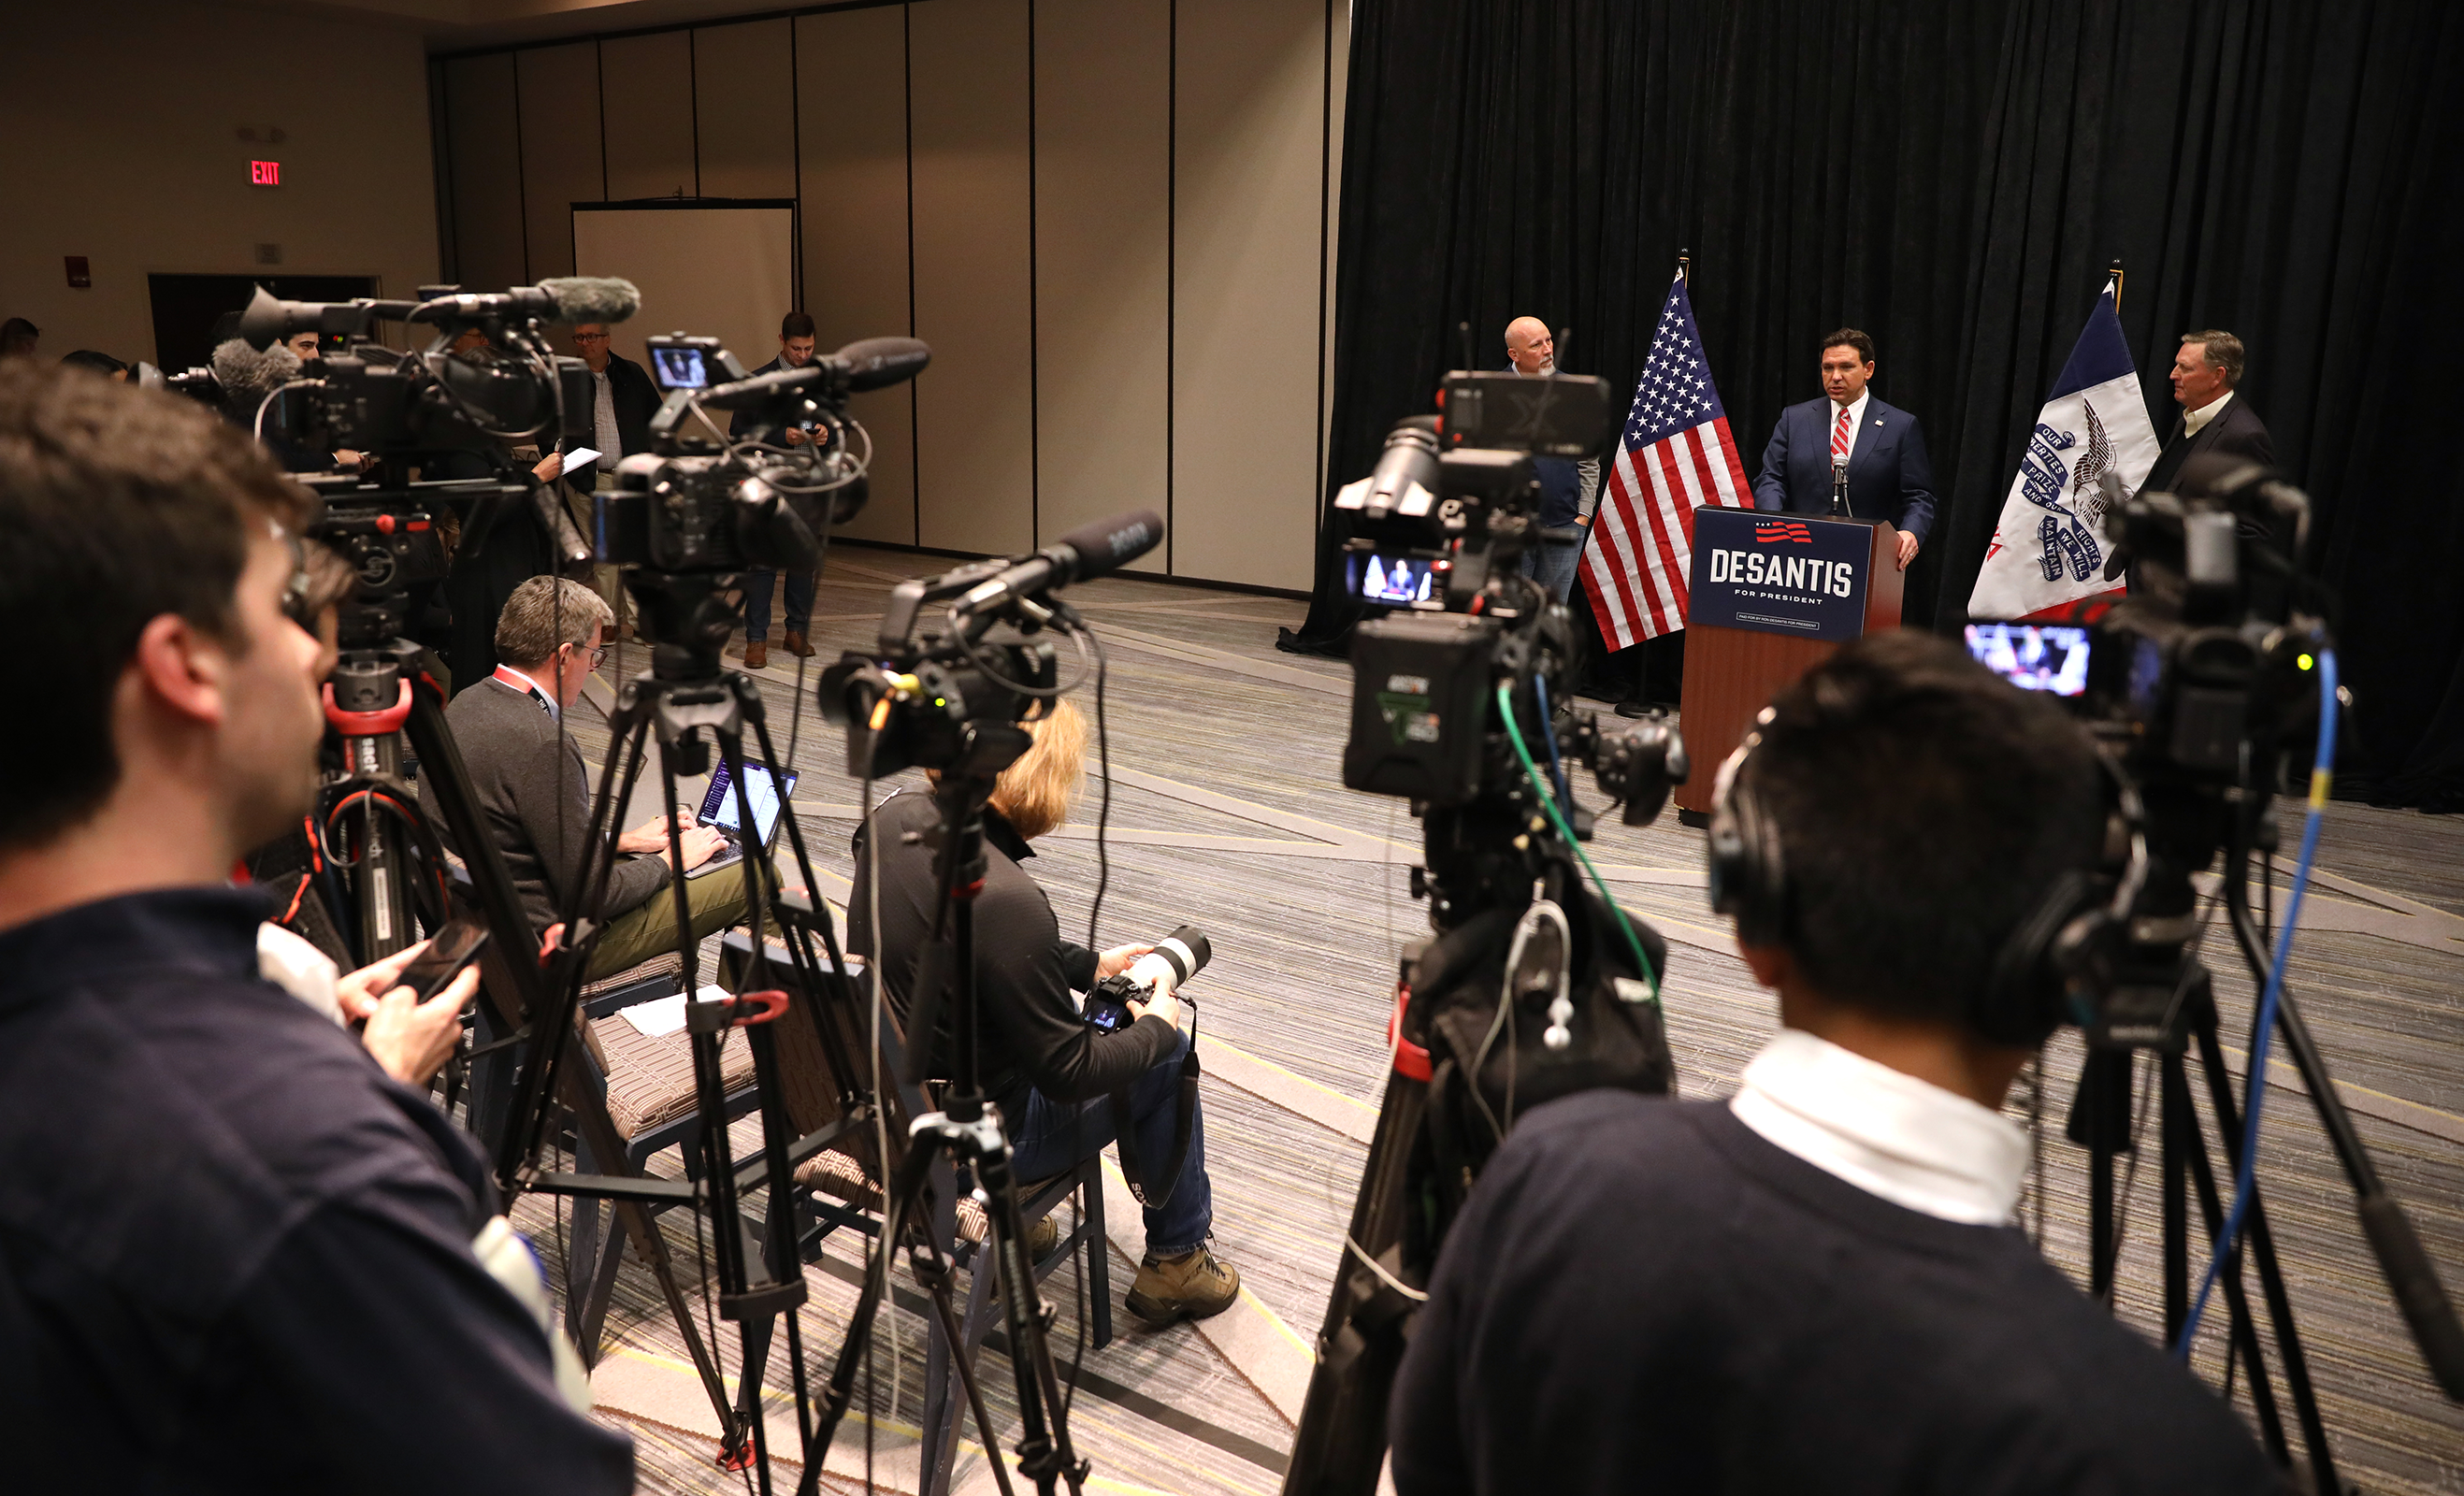
(MIDDLETOWN, CT) January 11, 2024 – Donald Trump may not be at the Republican presidential debates, but he is not conceding the airwaves in Iowa or New Hampshire, a new analysis from the Wesleyan Media Project shows. Trump’s campaign, along with the Make America Great Again super PAC, have spent about $10 million on the airwaves in Iowa (Table 1) for roughly 22,000 ad airings, just shy of the number of pro-Haley airings. Another 4,800 airings (or about $4.7 million) in pro-Trump ads have aired in New Hampshire, but the bulk of TV spending on behalf of Trump has been at the national level. The Trump campaign and super PAC have plowed over $20 million into a little over 2,200 national cable and national broadcast advertisements.
“Judging by the number of ads placed in Iowa and New Hampshire, Trump’s campaign is not taking those states for granted,” said Michael Franz, co-director of the Wesleyan Media Project. “But Trump is also looking forward to later primaries and the general election, spending the majority of television ad dollars on national ad buys.”
Table 1: Pro-Republican Candidate and Super-PAC Volume and Spending
| Iowa | New Hampshire | National | ||||
|---|---|---|---|---|---|---|
| Airings | Est Spend (in $Ms) | Airings | Est Spend (in $Ms) | Airings | Est Spend (in $Ms) |
|
| Trump | 9,290 | 1.79 | 2,746 | 0.968 | 139 | 1.21 |
| Make America Great Again | 12,689 | 8.18 | 2,077 | 3.77 | 2,062 | 19.27 |
| Trump Total | 21,979 | 9.97 | 4,823 | 4.74 | 2,201 | 20.48 |
| DeSantis | 3,440 | 1.4 | 0 | 0 | 1 | 0.025 |
| Never Back Down | 14,025 | 14.13 | 1,881 | 5.76 | 1,119 | 8.99 |
| Fight Right | 4,759 | 5.82 | 0 | 0 | 16 | 0.282 |
| DeSantis Total | 17,465 | 15.53 | 1,881 | 5.76 | 1,136 | 9.3 |
| Haley | 7,714 | 1.87 | 2,118 | 1.01 | 3 | 0.01 |
| SFA (Haley) | 14,492 | 16.28 | 4,724 | 10.59 | 11 | 0.31 |
| Haley Total | 22,206 | 18.16 | 6,842 | 11.6 | 14 | 0.32 |
| Figures are from January 1, 2023, to January 7, 2024. Numbers include broadcast television; “national” includes national cable and national broadcast. CITE SOURCE OF DATA AS: Vivvix CMAG with analysis by the Wesleyan Media Project. |
||||||
Ron DeSantis, combining his campaign and the Never Back Down and Fight Right super PACs, has aired almost 17,500 ads in Iowa at an estimated cost of $15.5 million. DeSantis has been far less active in New Hampshire, but the Never Back Down super PAC has been on the air nationally, with almost $9 million in ad buys (on just over 1,100 national spots).
Nikki Haley’s campaign, and the Stand for America Fund (SFA), have placed over 22,000 ad airings and have together spent $18.2 million in Iowa. Haley has also been on the air in New Hampshire–much more so than DeSantis–with a combined 6,800 ad airings (at an estimated cost of $11.6 million) from her campaign and super PAC.
Tim Scott Top Presidential Campaign Advertiser
Much of the spending in the presidential race this year has been done by outside groups, including many single-candidate super PACs, but Table 2 shows candidate-sponsored spending and television ad airings in the Republican primary campaign. The top candidate spender to this point was Tim Scott, who suspended his campaign in November 2023. Scott spent almost $6 million on 14,000 ad airings. Trump’s campaign is second on the list, with $4.5 million in spending on 12,000 ad airings. Next is Doug Burgum, the North Dakota governor who ended his campaign in December 2023. Perry Johnson spent almost $3 million on advertising, but the total number of airings was low given that many of the ads were placed nationally, not in local media markets.
Table 2: Volume and Spending by Republican Candidate Sponsors in the 2024 Nominations
| Sponsor | Est Spend (in $Ms) | Airings | First Air Date | Last Air Date |
|---|---|---|---|---|
| Scott, Tim | 5.95 | 14,051 | 24-May-23 | 14-Nov-23 |
| Trump, Donald | 4.53 | 12,175 | 26-Apr-23 | 7-Jan-24 |
| Burgum, Doug | 3.51 | 10,471 | 13-Jun-23 | 8-Nov-23 |
| Haley, Nikki | 3.41 | 9,835 | 1-Dec-23 | 7-Jan-24 |
| Johnson, Perry | 2.98 | 436 | 12-Feb-23 | 13-Sep-23 |
| Binkley, Ryan | 2.11 | 6,683 | 8-May-23 | 7-Jan-24 |
| Ramaswamy, Vivek | 1.52 | 3,127 | 29-Mar-23 | 17-Dec-23 |
| Desantis, Ron | 1.5 | 3,441 | 2-Nov-23 | 7-Jan-24 |
| Christie, Chris | 0.42 | 422 | 15-Dec-23 | 7-Jan-24 |
| Elder, Larry | 0.37 | 698 | 8-Sep-23 | 22-Sep-23 |
| Figures are from February 12, 2023, to January 7, 2024. Numbers include broadcast television and national cable for all Republican candidates. CITE SOURCE OF DATA AS: Vivvix CMAG with analysis by the Wesleyan Media Project. |
||||
If one adds spending from the Democratic and Independent candidates running for president (including Biden, Dean Phillips and Robert Kennedy, Jr.) to the Republican totals, there has been $41 million in spending by presidential candidates in this election cycle. That is down considerably from 2020, when candidates had spent a whopping $464 million on television ads by January 7. Much of that, however, came from the Bloomberg ($260 million) and Steyer ($145 million) campaigns.
In Figure 1, we look at airings in the same time periods over the course of the last four presidential campaigns, inclusive of any ads from all sponsors. Ad volume at this point in the 2020 cycle was off the charts at nearly 350,000 airings, but the bulk of that volume (265,295 airings) was from self-funded billionaires Tom Steyer and Michael Bloomberg. If we exclude those two sponsors (shown in black in Figure 1), 2024 volume exceeds television ad totals in each of the three prior presidential cycles through January 7 of each election year.
Figure 1: Volume of Presidential Ad Airings Over Time by Election Cycle
Figures are from January 1 of the off-year to January 7 of election year for each cycle.
Numbers include broadcast television and national cable for all sponsors.
CITE SOURCE OF DATA AS: Vivvix CMAG with analysis by the Wesleyan Media Project.
“Although the volume of ad airings in the 2024 cycle so far is less than what we saw in 2020 to date, that is largely because of the two outlier candidates who had unusually deep pockets and had accounted for over three quarters of the ads on air,” said Erika Franklin Fowler, co-director of the Wesleyan Media Project. “2024 activity to date is higher than what we saw by this point in 2012 and in 2016, largely because of earlier activity in summer and fall last year.”
Biden Focused on General Election
The Biden campaign, along with Super PACs, have spent about $27 million on 22,700 ad airings in support of the president (Table 3). The Biden campaign has spent about $8.5 million, while Future Forward USA Action has spent $14.6 million on television ads in support of Biden, some of that in combination with other groups.
Table 3: Volume and Spending by Biden and Larger Pro-Biden Sponsors
| Airings | Est Spend (in $Ms) | |
|---|---|---|
| Biden | 7,936 | 8.46 |
| Biden & DNC | 2,716 | 4.03 |
| Future Forward USA Action | 4,722 | 11.72 |
| Future Forward USA Action & Climate Power | 7,326 | 2.89 |
| Total | 22,700 | 27.1 |
| Figures are from February 8, 2023, to January 7, 2024. Numbers include broadcast television and national cable airings from the Biden campaign, coordinated airings between the campaign and the DNC and pro-Biden sponsors airing more than 500 airings. CITE SOURCE OF DATA AS: Vivvix CMAG with analysis by the Wesleyan Media Project. |
||
One of Biden’s competitors for the Democratic nomination, Dean Phillips, has spent an estimated $827,000 on about 1,200 ad airings, all of which are directed to voters in New Hampshire.
The Biden campaign, in contrast to the Republicans, has avoided the early primary and caucus states and is focusing its ads on those swing states that are expected to be key in the general election (Table 4). Top markets for the Biden campaign, shown in the first column, include those in Pennsylvania, Georgia, Michigan, Arizona, Nevada, and Wisconsin, though there is a small amount of spending in North Carolina and even a smaller amount in Florida.
“That Biden is spending in media markets like Raleigh and Charlotte, both in North Carolina, suggests that his campaign sees an opportunity in that state, which he lost in 2020. To be sure, though, spending in North Carolina to this point is relatively minor,” said Travis Ridout, co-director of the Wesleyan Media Project.
Pro-Biden groups, shown in the latter columns of Table 4, have been doing a lot of national ad spending, over $6 million worth. But the state-level spending is in similar locations, the major media markets in Georgia, Pennsylvania, Nevada, Arizona, Michigan and Wisconsin.
Table 4: Biden and Pro-Biden Group Spending and Airings by Media Market
| Biden Campaign + DNC | Pro-Biden Groups (all groups) | ||||
|---|---|---|---|---|---|
| Market | Est Spend (in $Ms) | Airings | Market | Est Spend (in $Ms) | Airings |
| Philadelphia | 1.97 | 1,392 | National | 6.47 | 1,359 |
| Atlanta | 1.94 | 1,857 | Atlanta | 1.85 | 1,754 |
| National | 1.71 | 189 | Philadelphia | 1.59 | 1,938 |
| Detroit | 1.61 | 848 | Phoenix | 1.59 | 2,371 |
| Phoenix | 1.28 | 1,657 | Las Vegas | 1.56 | 1,948 |
| Las Vegas | 1.25 | 1,219 | Detroit | 1.07 | 967 |
| Milwaukee | 0.72 | 745 | Milwaukee | 0.92 | 1,297 |
| Pittsburgh | 0.51 | 486 | Pittsburgh | 0.77 | 1,101 |
| Raleigh | 0.34 | 379 | Manchester, NH | 0.197 | 94 |
| Grand Rapids | 0.31 | 491 | Des Moines | 0.064 | 105 |
| Wilkes Barre | 0.23 | 365 | Green Bay | 0.029 | 27 |
| Madison | 0.19 | 345 | Flint | 0.017 | 18 |
| Green Bay | 0.14 | 420 | Erie | 0.016 | 20 |
| Lansing | 0.05 | 54 | Greensboro | 0.015 | 27 |
| Tucson | 0.04 | 60 | |||
| Orlando | 0.03 | 15 | |||
| Tampa | 0.03 | 15 | |||
| Charlotte | 0.03 | 19 | |||
| Reno | 0.02 | 49 | |||
| Flint | 0.02 | 25 | |||
| Figures are from January 1, 2023, to January 7, 2024 for all markets with more than $15k in spending and more than 15 airings. Numbers include broadcast television and national cable for the Biden campaign, ads coordinated between the Biden campaign and the DNC, and pro-Biden groups. CITE SOURCE OF DATA AS: Vivvix CMAG with analysis by the Wesleyan Media Project. |
|||||
Pro-DeSantis Super PAC Top Group Spender
Table 5 shows that Never Back Down, a super PAC supporting Ron DeSantis, is the top group spender in the presidential race so far, spending an estimated $32.7 million on over 20,000 ad airings. This is followed by SFA Fund, the pro-Haley committee, with over 19,000 ad airings costing an estimated $27.2 million.
Table 5: Top Groups in Presidential Race (with at least 1,000 airings)
| Affiliation | First air | Last air | Airings | Est Cost (in $Ms) |
|
|---|---|---|---|---|---|
| Never Back Down (pro-DeSantis) | Republican | 16-Apr-23 | 11-Dec-23 | 20,578 | 32.72 |
| SFA Fund, Inc. (pro-Haley) | Republican | 1-Aug-23 | 7-Jan-24 | 19,227 | 27.18 |
| Make America Great Again Inc. (pro-Trump) | Republican | 31-Mar-23 | 7-Jan-24 | 16,830 | 31.23 |
| Future Forward USA Action & Climate Power | Democrat | 8-Jun-23 | 16-Nov-23 | 7,326 | 2.89 |
| Best Of America PAC (pro-Burgum) | Republican | 26-Jul-23 | 5-Nov-23 | 6,011 | 11.93 |
| Win It Back PAC (anti-Trump) | Republican | 11-Jul-23 | 29-Aug-23 | 5,386 | 4.72 |
| Trust In The Mission PAC (pro-Scott) | Republican | 2-Jun-23 | 3-Nov-23 | 5,243 | 5.82 |
| Fight Right Inc. (pro-DeSantis) | Republican | 23-Nov-23 | 7-Jan-24 | 4,776 | 6.1 |
| Future Forward USA Action | Democrat | 8-Feb-23 | 12-Nov-23 | 4,722 | 11.72 |
| American Exceptionalism PAC (pro-Ramaswamy) | Republican | 2-Aug-23 | 18-Oct-23 | 1,254 | 1.17 |
| Figures are from February 8, 2023, to January 7, 2024. CITE SOURCE OF DATA AS: Vivvix CMAG with analysis by the Wesleyan Media Project. |
|||||
About the Data
Television ad totals reported here are from Vivvix CMAG (unless otherwise specified) and refer to broadcast television. All cost estimates for television are precisely that: estimates.
Stay tuned for updates on digital advertising in our next release.
About This Report
The Wesleyan Media Project provides real-time tracking and analysis of all political television advertising in an effort to increase transparency in elections. Housed in Wesleyan’s Quantitative Analysis Center – part of the Allbritton Center for the Study of Public Life – the Wesleyan Media Project is the successor to the Wisconsin Advertising Project, which disbanded in 2009. It is directed by Erika Franklin Fowler, professor of government at Wesleyan University, Michael M. Franz, professor of government at Bowdoin College and Travis N. Ridout, professor of political science at Washington State University. WMP personnel include Breeze Floyd (Program Manager), Dominique Monserrat (Research Coordinator), Pavel Oleinikov (Associate Director, QAC), Furkan Cakmak (Post-Doctoral Fellow), Natália de Paula Moreia (Post-Doctoral Fellow) and Meiqing Zhang (Post-Doctoral Fellow).
The Wesleyan Media Project’s real-time tracking in 2024 is supported by Wesleyan University and the John S. and James L. Knight Foundation. The Wesleyan Media Project is partnering again this year with OpenSecrets, to provide added information on outside group disclosure and candidate status.
Periodic releases of data will be posted on the project’s website and dispersed via LinkedIn, Bluesky @wesmediaproject.bsky.social and Twitter @wesmediaproject. To be added to our email update list, click here.
For more information contact: media@wesleyan.edu.
About Wesleyan University
Wesleyan University, in Middletown, Conn., is known for the excellence of its academic and co-curricular programs. With more than 2,900 undergraduates and 200 graduate students, Wesleyan is dedicated to providing a liberal arts education characterized by boldness, rigor and practical idealism. For more, visit www.wesleyan.edu.
About the John S. and James L. Knight Foundation
We are social investors who support democracy by funding free expression and journalism, arts and culture in community, research in areas of media and democracy, and in the success of American cities and towns where the Knight brothers once had newspapers. Learn more at kf.org and follow @knightfdn on social media.


