Record-Breaking Volume of Congressional Campaign Ads on TV, an Increase of 28% Over 2022
(MIDDLETOWN, CT) March 14, 2024 – Advertising in the presidential race has turned to a trickle as Joe Biden and Donald Trump have all-but-secured their parties’ nominations for president, but House and Senate races have seen record volumes of advertising. As of March 10, $163 million had been spent this election cycle on broadcast television advertising in House and Senate races, amounting to over 300,000 ad airings (Table 1), which is 28% more airings than the 2022 campaign at this point and more than 50,000 airings more than the prior record set in 2018.
Top Senate races include those in California (where over $31 million was spent before the state’s top-two primary), Maryland (an open seat), West Virginia (another open seat), Ohio (where incumbent Sherrod Brown faces a tough reelection bid), and Montana (where incumbent Jon Tester faces a tough fight). Top House races so far include New York’s 3rd district (with a recent special election), California’s 22nd district, Alabama’s 1st district, North Carolina’s 13th district and Alabama’s 2nd district.
In many of these races, outside group spending has been intense. Across all pro-Democratic congressional ads in the cycle-to-date, over 1 in 3 have come from supportive groups. Thirty percent of pro-Republican ads in House and Senate races have been sponsored by outside groups. Outside groups on the Democratic side in House races have sponsored nearly 60 percent of ads supportive of Democratic candidates. Early ad spending in congressional races often feature a lot of supportive groups, who try to set the agenda in competitive campaigns or critique the legislative efforts of vulnerable incumbents.
“Control of the House and Senate is up for grabs this year,” said Michael Franz, co-director of the Wesleyan Media Project. “We expect a lot of outside group spending throughout the election year, as every competitive congressional race could mean the difference between one of the parties winning or losing control of the chamber.”
Table 1: Top Five House and Senate Races, Cycle-to-Date
| Race | Total airings | Total Est. cost (in Ms) | pro-Dem total | pro-GOP | Dem grp % | GOP grp % |
|---|---|---|---|---|---|---|
| NY-03 | 8,978 | 15.5 | 6,006 | 2,972 | 44.9% | 73.9% |
| CA-22 | 8,744 | 2.46 | 5,794 | 2,950 | 48.7% | 47.7% |
| AL-01 | 8,320 | 2.38 | 0 | 8,320 | 44.0% | |
| NC-13 | 7,726 | 4.4 | 0 | 7,726 | 13.3% | |
| AL-02 | 7,690 | 1.8 | 3,749 | 3,941 | 58.3% | 1.4% |
| MT-Sen | 57,925 | 13.15 | 32,485 | 25,440 | 31.6% | 17.9% |
| CA-Sen | 50,508 | 31.64 | 50,492 | 16 | 25.8% | 0.0% |
| OH-Sen | 30,105 | 22.25 | 5,750 | 24,355 | 15.2% | 37.8% |
| MD-Sen | 15,514 | 11.08 | 15,514 | 0 | 0.0% | |
| WV-Sen | 12,088 | 6.09 | 1,818 | 10,270 | 100.0% | 72.1% |
| All House | 128,484 | 66.64 | 48,638 | 79,796 | 58.7% | 26.5% |
| All Senate | 188,231 | 96.55 | 111,276 | 76,955 | 23.8% | 34.1% |
| Total | 316,715 | 163.2 | 159,914 | 156,751 | 34.4% | 30.2% |
| Figures are from January 1, 2023, through March 10, 2024. Numbers include broadcast television for all sponsors. CITE SOURCE OF DATA AS: Vivvix CMAG with analysis by the Wesleyan Media Project. |
||||||
Record-breaking Congressional Ad Volumes
The volume of ad airings on broadcast television in House and Senate races exceeds that of the past seven federal election cycles, as Figure 1 shows. The 316,000 ad airings to date in this cycle is much larger than the 246,000 ad airings to this same date in the 2019-2020 cycle and larger also than the comparable period in the 2017-18 cycle. In the 2011-2012 and 2015-2016 cycles, fewer than 100,000 ads had aired on broadcast television to this point. (These totals, unless otherwise noted in this report, do not include spending on local cable, radio, or digital platforms.)
Figure 1: Volume of Airings in Congressional Races by Cycle (through March 10)
Figures are from January 1 of the off-year of the cycle through March 10 of the second year of the cycle.
Numbers include broadcast television for all sponsors.
CITE SOURCE OF DATA AS: Vivvix CMAG with analysis by the Wesleyan Media Project.
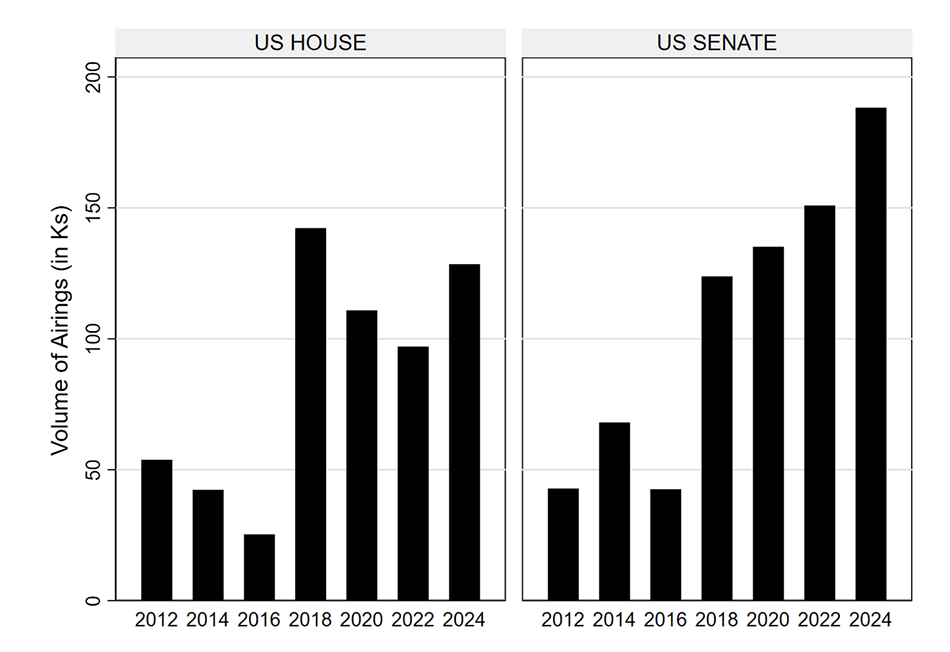
The jump in ad volumes is chiefly in Senate races, which exceeds the 2022 cycle (in the same period) by nearly 40,000 ads and has the most Senate ads to-date in the 12 years shown in Figure 2. House ads in 2024 are a bit off the pace of 2018, when Democrats saw a good chance of regaining control of the chamber, but they are more frequent than the other five election cycles back to 2012.
Figure 2: Volume of Airings in House and Senate Races by Cycle (through March 10)
Figures are from January 1 of the off-year of the cycle through March 10 of the second year of the cycle.
Numbers include broadcast television for all sponsors.
CITE SOURCE OF DATA AS: Vivvix CMAG with analysis by the Wesleyan Media Project.
Schiff Dominates CA Senate Spending
In the Senate race in California–which advanced Democrat Adam Schiff and Republican Steve Garvey out of the top-two primary–broadcast ad spending was dominated by Schiff, with $13.4 million spent on advertising. Democrat Katie Porter spent $7.8 million on ads, while the group Fairshake spent $5.7 million opposing Porter, in one ad calling her “a fake” and “an accomplished actor.” Standing Strong PAC, which supported Schiff, spent almost $4 million on ads attacking Garvey, calling him “too conservative for California” and someone who voted for Trump in 2016 and 2020. Some have argued that these ads were intended to boost his candidacy among Republican voters, with the hope Garvey would advance to the general election, making it more likely Adam Schiff would win in November. She Speaks for Me sponsored a small ad buy supporting Democrat Barbara Lee, who did not air any ads on broadcast television.
Table 2: Ad Spending in California Senate Race, Cycle-to-Date
| Affiliation | First air | Last Air | Ad airings | Est. Cost (in Ms) |
|
|---|---|---|---|---|---|
| Early, Eric | Republican | 12-Feb-24 | 3-Mar-24 | 16 | 0.02 |
| Fairshake | Democrat | 13-Feb-24 | 5-Mar-24 | 5,664 | 5.75 |
| Porter, Katie | Democrat | 10-Jan-24 | 10-Mar-24 | 11,664 | 7.8 |
| Schiff, Adam | Democrat | 10-Jan-24 | 10-Mar-24 | 25,790 | 13.38 |
| She Speaks For Me | Democrat | 7-Nov-23 | 25-Jan-24 | 676 | 0.76 |
| Standing Strong PAC | Democrat | 20-Feb-24 | 10-Mar-24 | 6,698 | 3.93 |
| Total | 50,508 | 31.64 | |||
| Figures are from January 1, 2023, through March 10, 2024. Numbers include broadcast television for all sponsors. CITE SOURCE OF DATA AS: Vivvix CMAG with analysis by the Wesleyan Media Project. |
|||||
David Trone has Airwaves to Himself in Maryland
In the race for the Democratic nomination for Senate in Maryland, David Trone, an incumbent member of the U.S. House representing the state’s 6th congressional district, has accounted for almost all of the $11 million in ad spending. Angela Alsobrooks, the current County Executive of Prince George’s County, has spent only $345,000 on broadcast ads. The Democratic primary for the open seat is May 14, and the winner is expected to face the former governor, Larry Hogan.
Table 3: Ad Spending in Maryland Senate Race, Cycle-to-Date
| Affiliation | First air | Last Air | Ad airings | Est. Cost (in Ms) |
|
|---|---|---|---|---|---|
| Alsobrooks, Angela | Democrat | 13-Feb-24 | 10-Mar-24 | 492 | 0.35 |
| Trone, David | Democrat | 9-May-23 | 10-Mar-24 | 15,022 | 10.74 |
| Total | 15,514 | 11.08 | |||
| Figures are from January 1, 2023, through March 10, 2024. Numbers include broadcast television for all sponsors. CITE SOURCE OF DATA AS: Vivvix CMAG with analysis by the Wesleyan Media Project. |
|||||
Early Montana Senate Spending Robust
In Montana, over $13 million has been spent on ads so far. Incumbent Jon Tester’s campaign has spent just over $3 million on ads, while the liberal group Last Best Place has spent $5.8 million attacking Tim Sheehy, a contender for the Republican nomination. Sheehy’s campaign, combined with the NRSC, has spent about $2.4 million on ads. Another group, More Jobs Less Government, has spent $1.2 million in support of Sheehy. All told, Tester and Last Best Place have combined to air over 32,000 ads to-date, compared to about 25,000 ads on the Republican side. This is shaping up to be a very competitive, hard-fought, and ad-rich campaign.
Table 4: Ad Spending in Montana Senate Race, Cycle-to-Date
| Affiliation | First air | Last Air | Ad airings | Est. Cost (in Ms) |
|
|---|---|---|---|---|---|
| Last Best Place PAC | Democrat | 12-Sep-23 | 10-Mar-24 | 10,271 | 5.78 |
| Montana Policy Action | Republican | 29-Jan-24 | 13-Feb-24 | 388 | 0.25 |
| More Jobs Less Government | Republican | 17-Jan-24 | 22-Feb-24 | 2,721 | 1.23 |
| Sheehy, Tim | Republican | 28-Jul-23 | 20-Feb-24 | 18,806 | 2.04 |
| Sheehy, Tim & NRSC | Republican | 25-Jan-24 | 10-Mar-24 | 2,091 | 0.33 |
| Tester, Jon | Democrat | 7-Nov-23 | 10-Mar-24 | 22,214 | 3.03 |
| Veterans On Duty, Inc. | Republican | 14-Feb-24 | 27-Feb-24 | 1,434 | 0.48 |
| Total | 57,925 | 13.15 | |||
| Figures are from January 1, 2023, through March 10, 2024. Numbers include broadcast television for all sponsors. CITE SOURCE OF DATA AS: Vivvix CMAG with analysis by the Wesleyan Media Project. |
|||||
Ohio Race Shaping Up to Be Very Competitive
The Ohio Senate race has already seen $22 million in ad spending, which accounts for over 30,000 ad airings. The biggest spenders so far are two Republicans seeking their party’s nomination on March 19: Matt Dolan, with $4.9 million in spending and Bernie Moreno, with $4.4 million in spending. Incumbent Sherrod Brown is already on the air, having spent $2.4 million on nearly 5,000 spots. Brown has also benefited from early spending by Duty and Country PAC, which sponsored nearly 900 airings last fall.
Table 5: Ad Spending in Ohio Senate Race, Cycle-to-Date
| Affiliation | First air | Last Air | Ad airings | Est. Cost (in Ms) |
|
|---|---|---|---|---|---|
| American Fuel & Petrochemical Manufacturers | Republican | 12-Feb-24 | 5-Mar-24 | 295 | 0.24 |
| Brown, Sherrod | Democrat | 1-Feb-24 | 10-Mar-24 | 4,878 | 2.43 |
| Buckeye Leadership Fund | Republican | 5-Mar-24 | 10-Mar-24 | 1,340 | 1.53 |
| Buckeye Values PAC | Republican | 12-Feb-24 | 3-Mar-24 | 556 | 0.70 |
| Citizens For Sanity | Republican | 6-Sep-23 | 6-Oct-23 | 488 | 0.73 |
| Club For Growth Action | Republican | 7-Feb-24 | 10-Mar-24 | 3,195 | 2.93 |
| Dolan, Matt | Republican | 30-Nov-23 | 10-Mar-24 | 7,329 | 4.87 |
| Duty And Country | Democrat | 12-Sep-23 | 8-Oct-23 | 870 | 0.69 |
| Leadership For Ohio Fund | Republican | 9-Jan-24 | 10-Mar-24 | 3,275 | 3.65 |
| Moreno, Bernie | Republican | 9-Nov-23 | 10-Mar-24 | 7,829 | 4.40 |
| Save America Fund | Democrat | 31-Jan-23 | 31-Jan-23 | 2 | 0.00 |
| Win It Back PAC | Republican | 8-Mar-24 | 10-Mar-24 | 48 | 0.08 |
| Total | 30,105 | 22.25 | |||
| Figures are from January 1, 2023, through March 10, 2024. Numbers include broadcast television for all sponsors. CITE SOURCE OF DATA AS: Vivvix CMAG with analysis by the Wesleyan Media Project. |
|||||
Ad Spending in West Virginia Mostly Pro-Republican
In the West Virginia Senate race, ad spending has topped $6 million this cycle. The bulk of the spending in this race has supported Republican candidates and has been done by groups. A super PAC called Defend American Jobs has spent $1.5 million in support of Governor Jim Justice’s bid for the Senate, while a group called Protect West Virginia Values has spent over $400,000 in support of Alex Mooney, a current member of Congress. Other groups were active in the race last year before Democratic incumbent Joe Manchin decided not to run for reelection. The 1,800 spots from Duty and Honor, for example, touted Manchin’s ability to work across the aisle.
Table 6: Ad Spending in West Virginia Senate Race, Cycle-to-Date
| Affiliation | First air | Last Air | Ad airings | Est. Cost (in Ms) |
|
|---|---|---|---|---|---|
| Club For Growth Action | Republican | 30-Apr-23 | 19-Dec-23 | 1,603 | 0.91 |
| Conservative Americans PAC | Republican | 6-Dec-23 | 20-Dec-23 | 993 | 0.60 |
| Defend American Jobs | Republican | 22-Jan-24 | 10-Mar-24 | 2,030 | 1.51 |
| Duty And Honor | Democrat | 22-Apr-23 | 20-May-23 | 1,818 | 0.88 |
| Justice, Jim | Republican | 12-Jan-24 | 29-Jan-24 | 895 | 0.15 |
| Mooney, Alex | Republican | 27-Apr-23 | 10-Mar-24 | 1,968 | 0.40 |
| One Nation | Republican | 19-Apr-23 | 16-May-23 | 2,022 | 1.18 |
| Protect West Virginia Values | Republican | 24-Feb-24 | 8-Mar-24 | 759 | 0.47 |
| Total | 12,088 | 6.09 | |||
| Figures are from January 1, 2023, through March 10, 2024. Numbers include broadcast television for all sponsors. CITE SOURCE OF DATA AS: Vivvix CMAG with analysis by the Wesleyan Media Project. |
|||||
Presidential Advertising Slows
While congressional advertising has been high this election cycle, presidential advertising has been low by historical standards. Figure 3 shows the volume of airings in the presidential race by cycle, which has declined this cycle compared to the past two. About 216,000 ads have aired on broadcast television this cycle through March 10, down from the over 1 million ads that had aired to this point in 2020, a number buoyed by massive spending by Tom Steyer and Michael Bloomberg.
Figure 3: Volume of Airings in Presidential Race by Cycle (through March 10)
Figures are from January 1 of the off-year of the cycle through March 10 of the second year of the cycle.
Numbers include broadcast television for all sponsors.
CITE SOURCE OF DATA AS: Vivvix CMAG with analysis by the Wesleyan Media Project.
Ad volumes in the presidential race have been particularly slow over the past month with only Haley and Trump left in the Republican primary through Super Tuesday, as shown by the black line in Figure 4. The large declines in 2020 were also a function of Steyer and Bloomberg dropping out of the campaign after Super Tuesday.
Figure 4: Weekly Volume of Airings in Presidential Race by Cycle (through March 10)
Figures are from January 1 of the off-year of the cycle through March 10 of the second year of the cycle.
Numbers include broadcast television for all sponsors.
CITE SOURCE OF DATA AS: Vivvix CMAG with analysis by the Wesleyan Media Project.
About 15,000 ads have aired on broadcast television in the past month, with most of them coming from Nikki Haley or the SFA Fund, a group supportive of Haley (Table 7). Most of the pro-Haley spots aired in Michigan and South Carolina before the primaries in those states, and Haley did very little advertising in advance of the wider set of Super Tuesday contests. Donald Trump’s campaign has spent $440,000 on ads in the past month, with almost all of those placed in South Carolina. Trump also aired a few ads on national cable.
Joe Biden’s estimated campaign ad spending on broadcast stations was even less at $184,000. Those ads were scattered around the general election swing states of Michigan, Pennsylvania and Wisconsin.
Table 7: Airings and Spending in Presidential Race by Sponsor (Since February 12)
| Sponsor | Airings | Est. Cost (in Ms) |
|---|---|---|
| Haley, Nikki | 6,888 | 2.01 |
| SFA Fund, Inc. | 3,010 | 2.46 |
| American Fuel & Petrochemical Manufacturers | 2,270 | 1.24 |
| Donald Trump | 2,024 | 0.44 |
| No Labels | 120 | 0.12 |
| Ryan Binkley | 93 | 0.004 |
| Joe Biden | 78 | 0.18 |
| We Deserve Better | 27 | 0.21 |
| Make America Great Again Inc. | 26 | 0.47 |
| American Values 2024 | 11 | 0.003 |
| Unleash Prosperity Now | 10 | 0.009 |
| Building America's Future | 7 | 0.58 |
| American Civil Liberties Union, Inc. | 3 | 0.11 |
| Total | 14,567 | 7.82 |
| Figures are from February 12 to March 10, 2024. Numbers include broadcast television for all sponsors. CITE SOURCE OF DATA AS: Vivvix CMAG with analysis by the Wesleyan Media Project. |
||
Biden-supporting PAC Books $133 Million in General Election Advertising
Although the Biden campaign has refrained from investing much in television advertising this past month, the pro-Biden group, Future Forward, has its eye on massive spending. The group has booked over $133 million in advertising on broadcast and local cable stations before election day. All of this pre-booked spending is slated to start after the Democratic National Convention in late August. This includes $16 million in broadcast advertising in Atlanta, $14 million each in broadcast advertising in Detroit and Philadelphia and $12 million in broadcast advertising in Phoenix. Future Forward also has $2.9 million booked in Omaha, surely a bid for one of Nebraska’s 5 electoral college votes, three of which are allocated to the winner of each congressional district. Since outside groups typically pay more for advertising than candidates, booking this time early may be one way to try to make dollars spread further.
Biden Outspending Trump by More Than 5:1 on Meta and Google Properties
Joe Biden’s campaign (including DNC coordinated and Biden Victory Fund spending) has totaled more than $23 million dollars on Meta and Google cycle-to-date compared to just over $4 million Donald Trump’s campaign (including joint fundraising) as shown in Table 8. Biden is spending much more on Facebook and Instagram than on Google whereas Trump is dividing funds more equally between the two platforms.
“In 2016, Donald Trump’s campaign made headlines for spending half of his advertising budget on digital ads,” said Erika Franklin Fowler, co-director of the Wesleyan Media Project. “Eight years later, it is Joe Biden’s campaign that is going all-out on online advertising spending nearly as much on Meta as on traditional television, and nearly 61% on digital once you include Google spending.”
Table 8: Trump and Biden Spending on TV, Meta, and Google (Cycle-to-Date)
| Bcast TV + Nat'l Cable (in Ms) | Meta (in Ms) | Google (in Ms) | Meta + Google (in Ms) | % Digital | |
|---|---|---|---|---|---|
| Biden | 14.9 | 14.7 | 8.4 | 23.0 | 60.8% |
| Trump | 7.2 | 2.2 | 2.0 | 4.2 | 36.5% |
| Figures are from January 1, 2023 to March 10, 2024 for Meta and January 1, 2023 to March 9, 2024 for Google. Numbers for television include broadcast television and national cable. Numbers for digital include not just spending on the candidate’s pages (for Meta) but any spending that is identified through the “paid for by” disclaimer information as being coordinated spending from Biden Victory Fund for Biden or Trump Save America Joint Fundraising Committee for Trump. CITE SOURCE OF DATA AS: Vivvix CMAG, Meta Ad Library, and Google Transparency Report with analysis by the Wesleyan Media Project. |
|||||
Immigration Top Issue on Republicans’ Agenda
Table 9 shows the top issues mentioned in Senate advertising in the cycle to March 10, divided by the party of the supported candidate. Next to each issue is the percentage of all ad airings that make a mention of the issue. Because ads may mention more than one issue, the percentages add to more than 100 percent.
Pro-Republican advertising in the Senate has focused on the topic of immigration, with national defense and the budget coming in second and third. Among pro-Democratic ads, prescription drugs, housing and jobs are top issues.
Table 9: Top Issues in U.S. Senate Races (Cycle-to-Date)
| Pro-Dem Ads (111,276 airings) | Pro-Rep Ads (76,955 airings) | ||
|---|---|---|---|
| Prescription Drugs | 38.4% | Immigration | 44.6% |
| Housing | 35.5% | National Defense | 24.9% |
| Jobs | 22.4% | Budget | 24.2% |
| Health care | 19.0% | Jobs | 24.1% |
| Financial services | 18.8% | Drugs/drug abuse | 21.6% |
| Economy | 16.4% | International Affairs | 19.3% |
| Corruption | 16.0% | China | 18.6% |
| Campaign finance | 15.6% | Economy | 15.6% |
| Budget | 15.1% | Prescription drugs | 15.3% |
| Energy/environment | 13.9% | Public safety | 14.9% |
| Figures are from January 1, 2023 to March 10, 2024. Numbers include broadcast television for all sponsors. CITE SOURCE OF DATA AS: Vivvix CMAG with analysis by the Wesleyan Media Project. |
|||
The difference between the Republican and Democratic issue agendas is even more stark in House advertising (Table 10). Seventy percent of pro-Republican ads in House races over the past month have mentioned immigration, compared to just 13 percent of pro-Democratic ads. Public safety is the number two issue for Republican advertising. On the Democratic side, health care and abortion are the top issues.
“It’s clear that Republicans, at least at this moment, are running on immigration and public safety,” said Travis Ridout, co-director of the Wesleyan Media Project. “It’s an issue combination that Republicans tried in some places in 2022 without much luck, but the politics of immigration now may be different than they were two years ago.”
Table 10: Top Issues in U.S. House Races (Cycle-to-Date)
| Pro-Dem Ads (48,638 airings) | Pro-Rep Ads (79,796 airings) | ||
|---|---|---|---|
| Health care | 42.5% | Immigration | 70.8% |
| Abortion | 36.2% | Public Safety | 31.4% |
| Taxes | 33.4% | Budget | 26.7% |
| Women's rights | 23.1% | Drugs/drug abuse | 16.4% |
| Prescription drugs | 19.9% | Taxes | 15.3% |
| Public Safety | 19.0% | International Affairs | 14.8% |
| Budget | 16.9% | Economy | 10.9% |
| Social Security | 14.2% | China | 8.3% |
| Immigration | 12.6% | Inflation | 8.3% |
| Energy/environment | 12.0% | Energy/environment | 8.1% |
| Figures are from January 1, 2023 to March 10, 2024. Numbers include broadcast television for all sponsors. CITE SOURCE OF DATA AS: Vivvix CMAG with analysis by the Wesleyan Media Project. |
|||
About the Data
All television data reported here are from Vivvix CMAG. Unless otherwise specified, most advertising references refer to broadcast television and national cable. All cost estimates for television are precisely that: estimates.
Meta (Facebook and Instagram) spending data come from the ad library aggregate reports, which provide spending information for each page name and disclaimer combination. Totals in this report reflect spending between January 1, 2023 and March 10, 2024. These totals are calculated by subtracting the reported cumulative spending (as reported by Facebook as the total spent since May 2018) for the March 10, 2024 report and subtracting the cumulative spending reported for December 31, 2022.
For Google ads, we downloaded the weekly reports from the platform’s Transparency Report. The totals reflected in this release are current as of March 9, 2024, the day on which we pulled the transparency report. Google spending is from the following time periods: January 1, 2023 and March 9 2024.
About this Report
The Wesleyan Media Project provides real-time tracking and analysis of all political television advertising in an effort to increase transparency in elections. Housed in Wesleyan’s Quantitative Analysis Center – part of the Allbritton Center for the Study of Public Life – the Wesleyan Media Project is the successor to the Wisconsin Advertising Project, which disbanded in 2009. It is directed by Erika Franklin Fowler, professor of government at Wesleyan University, Michael M. Franz, professor of government at Bowdoin College and Travis N. Ridout, professor of political science at Washington State University. WMP personnel include Breeze Floyd (Program Manager), Dominique Monserrat (Research Coordinator), Pavel Oleinikov (Associate Director, QAC), Furkan Cakmak (Post-Doctoral Fellow), Natália de Paula Moreia (Post-Doctoral Fellow) and Meiqing Zhang (Post-Doctoral Fellow).
The Wesleyan Media Project’s real-time tracking in 2024 is supported by Wesleyan University and the John S. and James L. Knight Foundation. The Wesleyan Media Project is partnering again this year with OpenSecrets, to provide added information on outside group disclosure and candidate status.
Periodic releases of data will be posted on the project’s website and dispersed via LinkedIn, Bluesky @wesmediaproject.bsky.social and Twitter @wesmediaproject. To be added to our email update list, click here.
For more information contact: media@wesleyan.edu.
About Wesleyan University
Wesleyan University, in Middletown, Conn., is known for the excellence of its academic and co-curricular programs. With more than 2,900 undergraduates and 200 graduate students, Wesleyan is dedicated to providing a liberal arts education characterized by boldness, rigor and practical idealism. For more, visit www.wesleyan.edu.
About the John S. and James L. Knight Foundation
We are social investors who support democracy by funding free expression and journalism, arts and culture in community, research in areas of media and democracy, and in the success of American cities and towns where the Knight brothers once had newspapers. Learn more at kf.org and follow @knightfdn on social media.


