Parties, Republican Groups Staying Out of Presidential Race,
but Trump Advertising at Same Pace as Romney in 2012;
Senate Advertising Heats Up: Outside Group Activity Continues to Break Records;
Third of Group Ads are Dark Money
September 20, 2016
![]()
Report Highlights
• Pro-Clinton ads dominating in most markets (Figures 1 & 2)
• Party ads and pro-GOP group ads down in Pres. race (Table 2)
• Pres. advertising is more negative in 2016 (Table 3)
• Only Clinton reaching out through Spanish-Language advertising (Go to section)
• Pres. ad spending nearly $600M for more than 700K ads (Table 4)
• Jobs and employment top the list of presidential issues (Table 11)
• Libertarian candidate places ads outside of swing states (Go to section)
• Senate race ads sponsored by outside groups reach an all-time high (Figure 3)
• 2016 Senate advertising heats up in last month ( Table 5)
• Top US Senate races, PA and NV leading way (Table 6)
• NC, MT and MO leading 2016 Governor races (Table 7)
• MT, ME and MN top list of US House races (Table 8)
• Top group advertisers in 2016 election cycle (Table 9)
• Dark money makes up a third of Senate advertising (Table 10)
![]()
(MIDDLETOWN, CT) September 20, 2016 – Although Donald Trump and his allies are now advertising in battleground states, advertising favoring Trump has not kept pace with advertising favoring Clinton. Since August 19, the date the Trump campaign aired its first ad in the general election, the Clinton campaign and allied organizations (such as Priorities USA Action) have aired almost 62,000 ads, compared with about 27,000 spots by Trump and groups that support him.
![]()
“Pro-Clinton ads have outnumbered pro-Trump ads by over two to one in the past month, and yet the polls have moved in Trump’s direction during that same time frame,” said Travis Ridout, co-director of the Wesleyan Media Project. “That doesn’t necessarily mean that ads aren’t working this year, but it does suggest that the larger media narrative has been more important than exposure to advertising in moving voters.”
![]()
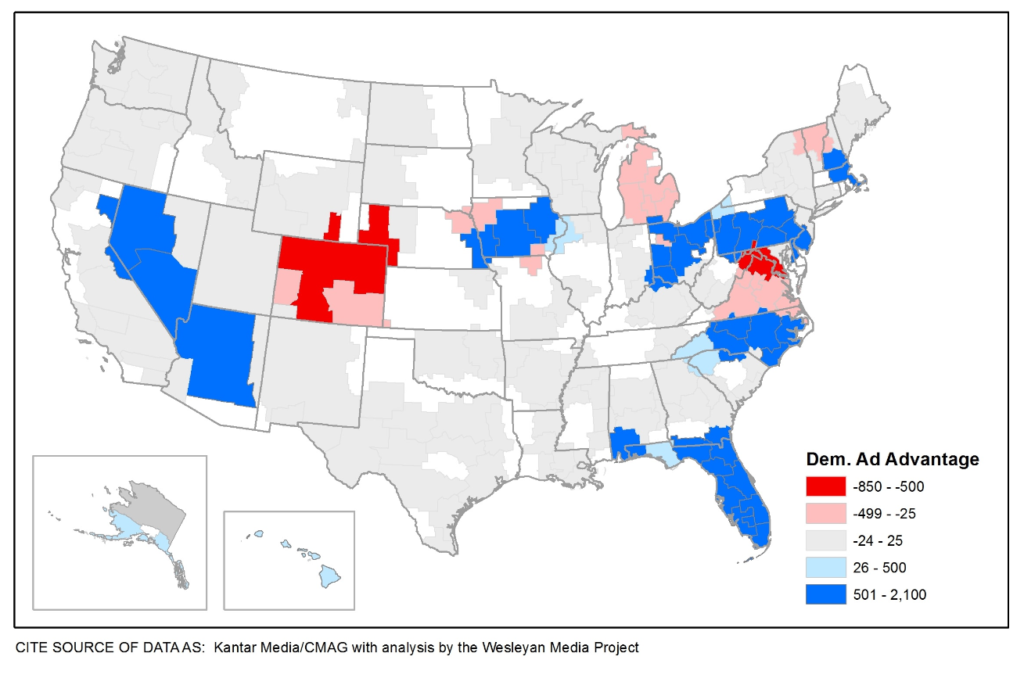
Figure 1 shows the geographic advertising advantage for each candidate with red showing Trump advantages and blue showing Clinton advantages.
Figure 1: Advertising Advantages in the Presidential Race, by Market (Since August 19)
![]()
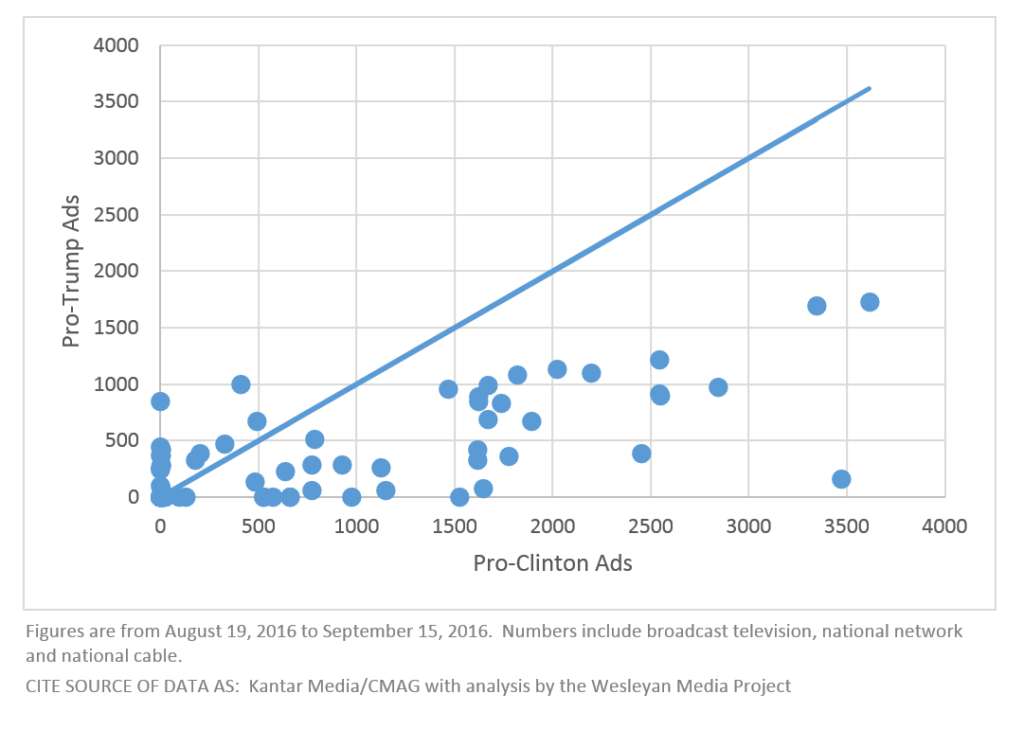
Figure 2 provides further illustration of the market advantages by plotting the number of pro-Clinton ads in each media market on the x-axis and the number of pro-Trump ads in each media market on the y-axis. The dots above the line show the small number of media markets in which pro-Trump ads have outnumbered pro-Clinton ads. These markets are mainly found in those states in which Clinton has had a decent polling lead, including Michigan (Lansing, Detroit and Grand Rapids), Virginia (Roanoke), and Colorado (Colorado Springs, Denver and Grand Junction). They also include some very small media markets in battleground states, such as Ottumwa and Sioux City in Iowa, Lima in Ohio and Burlington, Vermont, which reaches parts of New Hampshire.
Figure 2: Plot of Clinton and Trump ads by Media Market (Since August 19)
![]()
In most media markets, however, pro-Clinton ads have dominated. Table 1 lists the 20 media markets that have received the greatest number of ads in the past month, broken down by party. The last column shows that pro-Democratic ads range from 60 percent of the total in Toledo to 85 percent of the total in Las Vegas.
![]()
Table 1: Volume of Presidential Ads by Media Market (Since August 19)
| Market | Dem Ads | Dem Est. Cost (in Ms) | Rep Ads | Rep Est. Cost (in Ms) | Total Ads | Total Cost (in Ms) | % Dem |
|---|---|---|---|---|---|---|---|
| Orlando | 3,614 | 4.2 | 1,716 | 1.9 | 5,330 | 6.1 | 67.8 |
| Tampa | 3,342 | 3.2 | 1,698 | 1.4 | 5,040 | 4.6 | 66.3 |
| Charlotte | 2,843 | 1.8 | 964 | 0.7 | 3,807 | 2.5 | 74.7 |
| W. Palm Beach | 2,537 | 1.2 | 1,217 | 0.5 | 3,754 | 1.7 | 67.6 |
| Greensboro | 2,539 | 0.7 | 916 | 0.3 | 3,455 | 0.9 | 73.5 |
| Raleigh | 2,548 | 1.4 | 892 | 0.5 | 3,440 | 1.9 | 74.1 |
| Cleveland | 2,193 | 2.1 | 1,092 | 0.8 | 3,285 | 2.9 | 66.8 |
| Philadelphia | 2,025 | 1.8 | 1,128 | 1.2 | 3,153 | 3.0 | 64.2 |
| Columbus | 1,820 | 1.3 | 1,081 | 0.7 | 2,901 | 2.0 | 62.7 |
| Las Vegas | 2,447 | 1.4 | 381 | 0.3 | 2,865 | 1.8 | 85.4 |
| Jacksonville | 1,668 | 0.5 | 977 | 0.3 | 2,645 | 0.9 | 63.1 |
| Dayton | 1,738 | 0.7 | 829 | 0.4 | 2,567 | 1.1 | 67.7 |
| Pittsburgh | 1,894 | 1.1 | 668 | 0.5 | 2,562 | 1.6 | 73.9 |
| Cincinnati | 1,625 | 0.9 | 883 | 0.5 | 2,508 | 1.4 | 64.8 |
| Harrisburg | 1,624 | 0.7 | 836 | 0.5 | 2,460 | 1.2 | 66.0 |
| Toledo | 1,467 | 0.7 | 959 | 0.4 | 2,426 | 1.1 | 60.5 |
| Wilmington | 1,673 | 0.2 | 677 | 0.1 | 2,350 | 0.3 | 71.2 |
| Des Moines | 1,780 | 0.8 | 353 | 0.2 | 2,206 | 1.0 | 80.7 |
| Reno | 1,610 | 0.5 | 407 | 0.2 | 2,064 | 0.7 | 78.0 |
| Cedar Rapids | 1,613 | 0.5 | 325 | 0.1 | 2,005 | 0.6 | 80.4 |
| Figures are from August 19, 2016 to September 15, 2016. Numbers include broadcast television, national network and national cable. CITE SOURCE OF DATA AS: Kantar Media/CMAG with analysis by the Wesleyan Media Project. |
|||||||
Compared to the same period in 2012, the volume of television advertising is down in the presidential race (Table 2). In 2012, 152,000 ads aired in the presidential race between August 19 and September 15, but only 89,000 ads aired during that same time period in the current cycle. On the Democratic side, group advertising is actually up 65 percent over 2012 totals (over 11,500 compared to just over 7,000 in 2012), but Clinton has aired nearly 27,500 fewer ads than Obama did during the same period.
![]()
“Contrary to what we saw this summer, the major reason for the decline in advertising on the Republican side over the last month is not that the Trump campaign has been sitting back but that outside groups have not come in to help him like they did with Romney in 2012,” said Erika Franklin Fowler, co-director of the Wesleyan Media Project. “In fact, the Trump campaign actually put more ads on the air in the August 19 to September 15 period than did the Romney campaign four years ago.”
![]()
Another factor contributing to the decline of advertising in the presidential race is that the political parties have been absent, unlike in 2012 when the Republican Party, especially, paid for a considerable number of ads.
![]()
Table 2: Presidential Ad Totals by Party and Sponsorship in 2012 and 2016
| Candidates | Party/ Coordinated | Groups | Total | ||
|---|---|---|---|---|---|
| 2012 Pro-Democratic | |||||
| Ads aired | 77,731 | 1,096 | 7,015 | 85,842 | |
| Row % | 90.6% | 1.3% | 8.2% | ||
| Est. Cost | $40.0M | $0.5M | $3.4M | ||
| 2012 Pro-Republican | |||||
| Ads aired | 22,489 | 7,801 | 36,800 | 67,090 | |
| Row % | 33.5% | 11.6% | 54.9% | ||
| Est. Cost | $13.8M | $5.4M | $29.0M | ||
| 2016 Pro-Democratic | |||||
| Ads aired | 50,267 | 11,549 | 61,816 | ||
| Row % | 81.3% | 18.7% | |||
| Est. Cost | $33.5M | $9.3M | |||
| % count chg | -35.3% | 64.6% | -28.0% | ||
| 2016 Pro-Republican | |||||
| Ads aired | 23,435 | 3,803 | 27,238 | ||
| Row % | 86.0% | 14.0% | |||
| Est. Cost | $14.2M | $3.2M | |||
| % count chg | 4.2% | -89.7% | -59.4% | ||
| Figures are from August 19, 2016 to September 15, 2016. Numbers include broadcast television, national network and national cable. CITE SOURCE OF DATA AS: Kantar Media/CMAG with analysis by the Wesleyan Media Project. |
|||||
Libertarian Johnson Focuses Outside Swing States
Trump and Clinton are not the only candidates on the air. In the past month, Libertarian Gary Johnson has aired almost 1,700 ads across the country. But instead of focusing all of his efforts in the most competitive battleground states, he has been concentrating his advertising efforts in states such as Maine, Oregon, Utah, Washington, Wisconsin and his home state of New Mexico. Still, his ad totals are very small in comparison to the Democratic and Republican tickets.
![]()
Presidential Ad Race Filled With Attacks
The numbers confirm what most people assumed from the start: this presidential race would be a nasty one. As Table 3 shows, 53.4 percent of ad airings in the past month have been negative (up from 48 percent for the comparable period in 2012), which we define as ads focused solely on an opponent. Another 27.9 percent have been contrast (down from 41 percent in 2012), which are those mentioning both the favored candidate and the opponent. Just 18.7 percent of ads have been positive, those focused solely on the favored candidate, but that is up from only 11 percent in the comparable period in 2012.
Clinton and Trump have taken different approaches with their advertising. Just over 60 percent of Clinton’s ads have attacked Trump while 31 percent have been positive, focusing on Clinton. Trump, on the other hand, has by and large used contrast ads, which both promote himself and attack Clinton. He has aired no positive ads. The groups that support the candidates have been extremely negative; all pro-Clinton group-sponsored ads have been negative, while 93.7 percent of pro-Trump group-sponsored ads have been negative.
![]()
Table 3: Tone of Presidential Advertising
| Pro-Clinton | Negative | Contrast | Positive | |
|---|---|---|---|---|
| Candidate | 60.9% | 7.7% | 31.4% | |
| Group | 100.0% | 0.0% | 0.0% | |
| Pro-Trump | Negative | Contrast | Positive | |
| Candidate | 11.4% | 88.6% | 0.0% | |
| Group | 93.7% | 0.0% | 6.3% | |
| Overall | 53.4% | 27.9% | 18.7% | |
| Figures are from August 19 to September 15, 2016. Numbers include broadcast television, national network and national cable. CITE SOURCE OF DATA AS: Kantar Media/CMAG with analysis by the Wesleyan Media Project |
||||
Clinton Reaches Out to Spanish-Language Voters
Since September 7, Clinton has aired 3 different Spanish-language ads a total of 447 times; Trump has aired none. (Prior to September 7, Clinton hadn’t aired a Spanish language ad since late June). The bulk of Clinton’s Spanish-language advertising was seen in Las Vegas, but her campaign has also aired Spanish-language ads in Miami, Orlando and Tampa. Three pro-Clinton groups—El Super PAC Voto Latino, Latino Victory Fund and Priorities USA Action—have combined for another 397 Spanish-language ads in the past month (8/19 to 9/15). These ads aired in Denver, Las Vegas, Miami and Orlando.
![]()
Cycle-to-Date Spending Almost $600 Million in Presidential Race
Estimated spending on advertising in the presidential race, starting from January 1, 2015, is now at $578 million, with just over 700,000 total ad airings (Table 4). At the same time, spending on ads in US Senate races for the 2015-16 election cycle has topped $319 million, which has purchased over 388,000 ad airings. Spending on gubernatorial and U.S. House races have both topped $100 million. All told, over $1 billion have been spent on federal and gubernatorial races to date this cycle.
![]()
Table 4: Spending and Ad Counts in 2015-16 Election Cycle
| Est. Cost (in Millions) | Airings | |
|---|---|---|
| President | 578.1 | 700,452 |
| Governor | 101.8 | 275,914 |
| US House | 105.3 | 192,556 |
| US Senate | 319.6 | 388,004 |
| Federal and Governor Total | 1,104.9 | 1,556,926 |
| Ballot Measures | 65.5 | 89,346 |
| Figures are from January 1, 2015 to September 15, 2016. Numbers include broadcast television (national network and national cable are included in presidential totals). CITE SOURCE OF DATA AS: Kantar Media/CMAG with analysis by the Wesleyan Media Project. |
||
Proportion of Outside Group Ads in 2016 Senate Races at All-Time High; Over Half of Republican Airings Sponsored by Groups
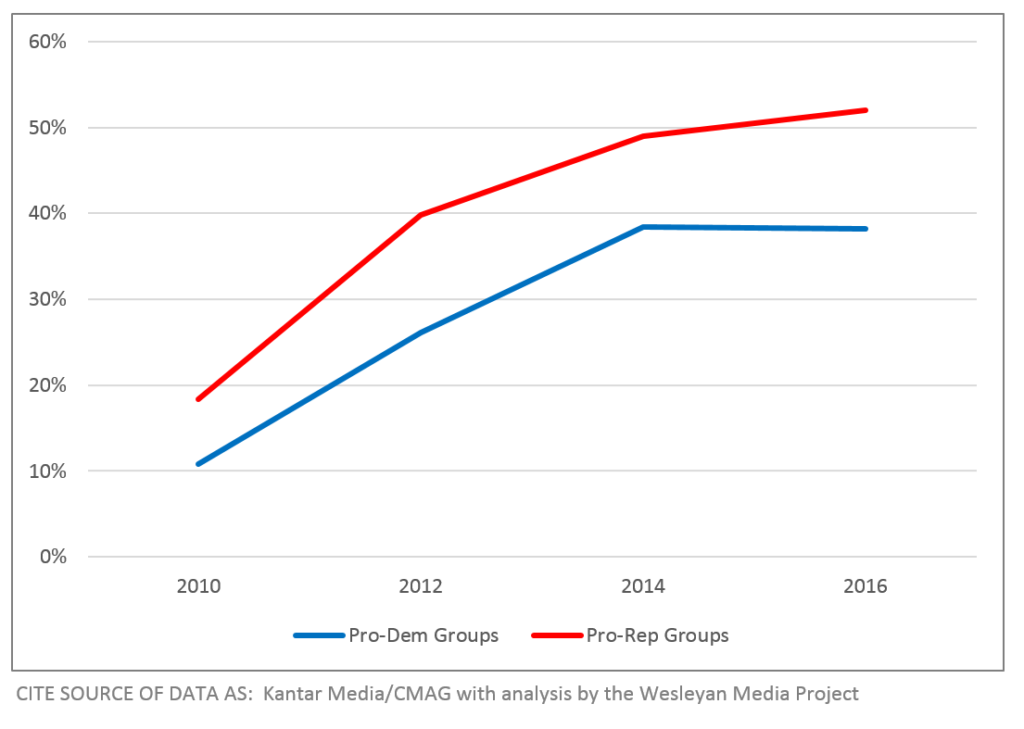
Total airings in Senate races in 2016 are down from 2012 levels, but the involvement of outside groups as a proportion of all airings is breaking records. Outside groups have sponsored over 45 percent of all Senate airings in the 2016 election cycle-to-date, and as shown in Figure 3, Republican groups have sponsored nearly 52 percent of all pro-Republican Senate airings (up from 49 percent in 2014, 40 percent in 2012 and 18 percent in 2010). Democratic groups have sponsored nearly 40 percent of pro-Democratic Senate airings, essentially the same proportion they aired in 2014, which is up dramatically from 26 percent in 2012 and 11 percent in 2010.
![]()
Figure 3: Percent of Senate Ads by Outside Groups, Cycle-to-Date
![]()
2016 Senate Advertising in Last Month is Up Over 2012 Levels
Although 2016 cycle-to-date Senate advertising totals are lower than 2012, in the last month Senate advertising has outpaced 2012 totals for the comparable period by 6 percent overall (Table 5). Most of the increase has been driven by more Republican advertising (a 12 percent increase compared to 2012 totals). Candidate-sponsored advertising on both sides of the aisle is down dramatically, dropping by nearly 20 percent on the Democratic side and by a full third on the Republican side. Outside groups, meanwhile, have increased their number of airings, as have party-sponsored airings, which are up dramatically over 2012 totals.
“It seems clear that the party committees and especially pro-Republican groups are putting more energy into the race for the U.S. Senate than they are for the White House,” said Michael Franz, co-director or the Wesleyan Media Project. “As the presidential race tightens, however, it will be interesting to see if pro-Trump ads from either the RNC or conservative super PACs show up on television screens in competitive states.”
![]()
Table 5: Senate Ad Totals by Party and Sponsorship in 2012 and 2016
| Candidates | Party/ Coordinated | Groups | Total | ||
|---|---|---|---|---|---|
| 2012 Pro-Democratic | |||||
| Ads aired | 36,980 | 5,524 | 13,023 | 56,062 | |
| Row % | 66.0% | 9.9% | 23.2% | ||
| Est. Cost | $16.6M | $1.5M | $6.0M | ||
| 2012 Pro-Republican | |||||
| Ads aired | 30,757 | 3,994 | 19,568 | 54,543 | |
| Row % | 56.4% | 7.3% | 35.9% | ||
| Est. Cost | $14.4M | $0.5M | $11.4M | ||
| 2016 Pro-Democratic | |||||
| Ads aired | 29,785 | 12,319 | 14,370 | 56,474 | |
| Row % | 52.7% | 21.8% | 25.4% | ||
| Est. Cost | $15.6M | $2.1M | $14.6M | ||
| % count chg | -19.5% | 123.0% | 10.3% | 0.7% | |
| 2016 Pro-Republican | |||||
| Ads aired | 20,526 | 16,584 | 23,905 | 61,015 | |
| Row % | 33.6% | 27.2% | 39.2% | ||
| Est. Cost | $12.2M | $5.6M | $19.4M | ||
| % count chg | -33.3% | 315.2% | 22.2% | 11.9% | |
| Figures are from August 19 to September 15 in each year. Numbers include broadcast television, national network and national cable. CITE SOURCE OF DATA AS: Kantar Media/CMAG with analysis by the Wesleyan Media Project. |
|||||
Pennsylvania, Nevada Senate Races Top Charts
Races for the U.S. Senate have heated up over the past month, with races in Pennsylvania, Nevada, Indiana, Ohio and New Hampshire drawing the most attention (Table 6). Among the most competitive races, Democrats held ad advantages in Pennsylvania, Nevada, New Hampshire, Wisconsin and Colorado, while Republicans held huge advantages in Ohio, Missouri, Florida, and Indiana; Republicans have also held advantages in North Carolina and Arizona. Group spending has been especially important in the Pennsylvania race, where groups have accounted for almost 60 percent of advertising in the past month (over 6,400 ads from pro-Democratic groups and nearly 5,000 from pro-Republican ones).
![]()
Table 6: Ad Volume and Spending in Top US Senate Races (Since August 19)
| State | Airings | Est Cost (in Ms) | Dem Adv. | Pro-Dem Cand. | Pro-Dem Group | Pro-Dem Pty/ Coord | Pro-Rep Cand. | Pro-Rep Group | Pro-Rep Pty/ Coord |
|---|---|---|---|---|---|---|---|---|---|
| PA | 18,265 | 9.9 | 2,907 | 2,325 | 6,451 | 1,810 | 2,020 | 4,947 | 712 |
| NV | 13,871 | 6.5 | 901 | 2,717 | 3,372 | 1,297 | 1,231 | 2,653 | 2,601 |
| IN | 12,424 | 4.9 | -1,516 | 5,389 | 65 | 0 | 686 | 2,319 | 3,965 |
| OH | 11,393 | 7.4 | -4,523 | 2,166 | 728 | 541 | 3,168 | 3,527 | 1,263 |
| NH | 8,510 | 16.9 | 1,466 | 1,936 | 2,881 | 171 | 1,432 | 1,581 | 509 |
| MO | 8,092 | 3.7 | -2,110 | 1,349 | 197 | 1,445 | 3,049 | 1,512 | 540 |
| WI | 7,815 | 3.1 | 2,141 | 4,845 | 133 | 0 | 1,398 | 1,439 | 0 |
| FL | 6,089 | 4.5 | -2,375 | 1,398 | 459 | 0 | 381 | 1,604 | 2,247 |
| NC | 5,402 | 4.0 | -1,106 | 2,064 | 84 | 0 | 948 | 1,502 | 804 |
| AZ | 4,556 | 3.4 | -1,562 | 1,497 | 0 | 0 | 796 | 1,452 | 811 |
| IL | 2,920 | 1.0 | 172 | 1,546 | 0 | 0 | 6 | 1,368 | 0 |
| LA | 2,780 | 1.2 | -2,760 | 10 | 0 | 0 | 2,769 | 1 | 0 |
| IA | 2,270 | 1.4 | -414 | 928 | 0 | 0 | 1,342 | 0 | 0 |
| CO | 1,289 | 0.9 | 1,289 | 1,289 | 0 | 0 | 0 | 0 | 0 |
| GA | 710 | 0.4 | -710 | 0 | 0 | 0 | 710 | 0 | 0 |
| ID | 327 | 0.05 | -327 | 0 | 0 | 0 | 327 | 0 | 0 |
| KY | 315 | 0.2 | 235 | 275 | 0 | 0 | 40 | 0 | 0 |
| AR | 167 | 0.07 | -167 | 0 | 0 | 0 | 167 | 0 | 0 |
| VT | 51 | 0.03 | 51 | 51 | 0 | 0 | 0 | 0 | 0 |
| AK | 38 | 0.006 | -38 | 0 | 0 | 0 | 38 | 0 | 0 |
| KS | 18 | 0.01 | -18 | 0 | 0 | 0 | 18 | 0 | 0 |
| Figures are from August 19, 2016 to September 15, 2016. Numbers include broadcast television, national network and national cable. CITE SOURCE OF DATA AS: Kantar Media/CMAG with analysis by the Wesleyan Media Project. | |||||||||
![]()
Republican groups have also been advertising heavily in Ohio (over 3,500 airings, accounting for 44 percent of pro-Republican advertising), Nevada (over 2,600 airings and 41 percent of GOP ads on air), and Indiana (over 2,300 airings, a third of the Republican total). Seven other contests have seen roughly 1,500 spots each from pro-Republican groups in the last month. Democratic groups have been heavily involved in Nevada (nearly 3400 airings and 46 percent of pro-Democratic spots) and New Hampshire (nearly 2900 airings and 58 percent of pro-Democratic ads). More specific information on which groups were active in each race can be found in the appendix tables.
North Carolina Tops Governor Race Spending
Races for governor have also heated up in the past month, with North Carolina’s race between incumbent Pat McCrory and challenger Roy Cooper seeing the most ad airings (over 11,000) and the most spending (almost $6 million), as Table 7 shows. Democrat Cooper has benefited from about 1,600 more ads than Republican McCrory. Also seeing plentiful advertising in the past month were gubernatorial races in Montana and Missouri, each of which experienced over 9,000 ad airings.
![]()
Table 7: Ad Volume and Spending in Top Governor Races (Since August 19)*
| State | Airings | Est Cost (in Ms) | Dem Adv. | Pro-Dem Cand. | Pro-Dem Group | Pro-Dem Pty/ Coord | Pro-Rep Cand. | Pro-Rep Group | Pro-Rep Pty/ Coord |
|---|---|---|---|---|---|---|---|---|---|
| NC | 11,398 | 6.0 | 1,684 | 5,695 | 846 | 0 | 3,391 | 0 | 1,466 |
| MT | 9,918 | 1.3 | -746 | 3,043 | 1,543 | 0 | 5,033 | 0 | 299 |
| MO | 9,048 | 3.8 | 2,550 | 5,799 | 0 | 0 | 3,249 | 0 | 0 |
| IN | 5,372 | 2.0 | 418 | 2,895 | 0 | 0 | 2,035 | 0 | 442 |
| WV | 3,420 | 0.9 | 1,016 | 890 | 1,328 | 0 | 1,202 | 0 | 0 |
| NH | 1,516 | 0.8 | -524 | 496 | 0 | 0 | 1,020 | 0 | 0 |
| VT | 1,377 | 0.4 | -785 | 76 | 220 | 0 | 761 | 320 | 0 |
| OR | 217 | 0.1 | -129 | 44 | 0 | 0 | 173 | 0 | 0 |
| UT | 92 | 0.1 | 90 | 91 | 0 | 0 | 1 | 0 | 0 |
| Figures are from August 19, 2016 to September 15, 2016. Numbers include broadcast television, national network and national cable. *For sponsor breakdowns see Table C in the appendix. CITE SOURCE OF DATA AS: Kantar Media/CMAG with analysis by the Wesleyan Media Project. | |||||||||
Table 8 shows the top ten US House races, ranked by the volume of ads since August 19. Montana’s at-large congressional seat has seen the most advertising, followed by Maine’s second congressional district race and Minnesota’s 8th congressional district. In 9 of the top 10 races (Florida’s second district is the exception), advertising on behalf of the Democratic candidate has been greater in volume than advertising on behalf of the Republican candidate.
![]()
Table 8: Ad Volume and Spending in Top House Races (Since August 19)
| District | Airings | Est. Cost (in Ms) | Dem Adv. | Pro-Dem Cand. | Pro-Dem Group | Pro-Dem Pty/ Coord | Pro-Rep Cand | Pro-Rep Group | Pro-Rep Pty/ Coord |
|---|---|---|---|---|---|---|---|---|---|
| MT01 | 4,109 | 0.5 | 845 | 2,477 | 0 | 0 | 1,632 | 0 | 0 |
| ME02 | 3,337 | 1.0 | 1,447 | 134 | 2,258 | 0 | 498 | 0 | 447 |
| MN08 | 3,317 | 2.2 | 1,479 | 622 | 958 | 818 | 573 | 0 | 346 |
| NY22 | 3,095* | 0.6 | 2,262 | 1,185 | 1,077 | 0 | 0 | 0 | 0 |
| FL18 | 2,288 | 1.0 | 114 | 1,201 | 0 | 0 | 744 | 130 | 213 |
| FL02 | 1,941 | 0.6 | -1,941 | 0 | 0 | 0 | 1,321 | 620 | 0 |
| NY23 | 1,901 | 0.6 | 1,179 | 1,540 | 0 | 0 | 361 | 0 | 0 |
| NE02 | 1,707 | 0.6 | 437 | 427 | 246 | 399 | 162 | 0 | 473 |
| MI07 | 1,641 | 0.5 | 973 | 1,307 | 0 | 0 | 334 | 0 | 0 |
| NY24 | 1,438 | 0.5 | 244 | 841 | 0 | 0 | 597 | 0 | 0 |
| Figures are from August 19, 2016 to September 15, 2016. Numbers include broadcast television, national network and national cable. *Totals include third party advertising. CITE SOURCE OF DATA AS: Kantar Media/CMAG with analysis by the Wesleyan Media Project. | |||||||||
Priorities USA Action is Top Group Advertiser
Several groups have become involved in the presidential and congressional campaigns, as Table 9 shows. At the top of the list is Priorities USA Action, which has aired almost 45,000 ads in the presidential race in support of Hillary Clinton. Though they haven’t aired ads since February and March, respectively, Right to Rise USA, a super PAC that supported Jeb Bush, and Conservative Solutions PAC, which supported Marco Rubio, are still the second and third biggest advertisers this election cycle. Thirteen of the groups on this list have been active through the end of the summer, while the rest were involved only in the presidential nomination phase of this election cycle.
Table 9: Top 20 Group Advertisers in 2015-16 Election Cycle
| Group Name | Date of First Ad | Date of Last Ad | Ads Aired | Pres. Ads | Sen. Ads | House Ads | Org Type |
|---|---|---|---|---|---|---|---|
| Priorities USA Action | 18-May-16 | 15-Sep-16 | 44,826 | 44,826 | 0 | 0 | superPAC |
| Right To Rise USA | 15-Sep-15 | 23-Feb-16 | 35,558 | 35,558 | 0 | 0 | superPAC |
| Conservative Solutions PAC | 1-Dec-15 | 18-Mar-16 | 30,169 | 30,169 | 0 | 0 | superPAC |
| Senate Majority PAC | 12-Aug-15 | 15-Sep-16 | 26,351 | 0 | 26,351 | 0 | superPAC |
| Freedom Partners Action Fund | 17-Mar-16 | 15-Sep-16 | 22,340 | 0 | 22,340 | 0 | superPAC |
| One Nation | 8-Oct-15 | 6-Sep-16 | 20,216 | 0 | 20,216 | 0 | 501c4 |
| U.S. Chamber of Commerce | 30-Jun-15 | 8-Sep-16 | 16,681 | 0 | 14,488 | 2,193 | 501c6 |
| Club for Growth Action | 6-May-15 | 30-Aug-16 | 12,559 | 6,548 | 938 | 5,073 | superPAC |
| Fighting for Ohio Fund | 6-May-16 | 4-Sep-16 | 10,593 | 0 | 10,593 | 0 | superPAC |
| Stand for Truth, Inc | 13-Jan-16 | 15-Mar-16 | 10,330 | 10,330 | 0 | 0 | superPAC |
| Women Vote | 1-Dec-15 | 15-Sep-16 | 8,336 | 1,305 | 6,731 | 300 | superPAC |
| American Future Fund | 27-Jan-16 | 15-Sep-16 | 8,072 | 5,288 | 2,784 | 0 | 501c4 |
| Rebuilding America Now PAC | 8-Jun-16 | 15-Sep-16 | 7,799 | 7,799 | 0 | 0 | superPAC |
| Our Principles PAC | 26-Jan-16 | 3-May-16 | 7,000 | 7,000 | 0 | 0 | superPAC |
| AFSCME People | 29-Apr-16 | 15-Sep-16 | 5,584 | 0 | 5,584 | 0 | PAC |
| New Day For America | 9-Jul-15 | 6-May-16 | 5,394 | 5,394 | 0 | 0 | superPAC |
| America Leads | 20-Jul-15 | 9-Feb-16 | 5,377 | 5,377 | 0 | 0 | superPAC |
| End Citizens United | 3-Mar-16 | 15-Sep-16 | 5,256 | 0 | 4,444 | 812 | PAC |
| NRA Political Victory Fund | 30-Jun-16 | 15-Sep-16 | 5,184 | 4,514 | 670 | 0 | PAC |
| Keep The Promise I | 12-Sep-15 | 1-Mar-16 | 4,957 | 4,957 | 0 | 0 | superPAC |
| Figures are from January 1, 2015, to September 15, 2016. Numbers include broadcast television, national network and national cable. CITE SOURCE OF DATA AS: Kantar Media/CMAG with analysis by the Wesleyan Media Project. Group classification by the Center for Responsive Politics. |
|||||||
Year of the Super PAC; More than a Third of Ads in Senate are Dark
Analysis done in conjunction with the Center for Responsive Politics reveals that full disclosure groups (mostly Super PACs) continue to dominate advertising in 2016, making up a majority of outside group advertising in federal races (Table 10). About 60 percent of group-sponsored advertising in Senate contests, more than three-quarters of group advertising in House races and over 90 percent of group ads in the presidential race were sponsored by groups that fully disclose their donors. However, “dark money” advertising, which is aired by 501cs that are not required to disclose their donors, comprises over a third of all outside group ads in Senate contests and nearly a quarter (22 percent) in House races cycle-to-date. A small percentage of ads were sponsored by groups that partially disclose; in many cases, this means that they disclose the groups that donate to them but those donors are themselves dark money groups.
![]()
Table 10: Group Advertisers and Donor Disclosure
| Ads | Est. Cost (in Millions) | % of total | ||
|---|---|---|---|---|
| President | Full | 184,605 | 246.5 | 91.9% |
| Partial | 1,635 | 1.2 | 0.8% | |
| None | 14,618 | 19.8 | 7.3% | |
| 200,858 | 267.5 | |||
| Senate | Full | 104,603 | 95.2 | 59.6% |
| Partial | 8,147 | 13.2 | 4.6% | |
| None | 62,838 | 80.1 | 35.8% | |
| 175,588 | 188.5 | |||
| House | Full | 18,737 | 11.0 | 76.0% |
| Partial | 521 | 0.3 | 2.1% | |
| None | 5,405 | 4.2 | 21.9% | |
| 24,663 | 15.5 | |||
| Figures are from January 1, 2015, to September 15, 2016. Numbers include broadcast television, national network and national cable. CITE SOURCE OF DATA AS: Kantar Media/CMAG with analysis by the Wesleyan Media Project. Group classification by the Center for Responsive Politics. |
||||
“With the election in its final days and millions of dollars in secret money giving a boost to both sides in tight senate and house races, the question for voters and constituents is who their new representatives in Congress may feel beholden to once they’re in office,” said Sheila Krumholz, executive director of the Center for Responsive Politics. “The public has very few avenues to track this kind of access and influence.”
Jobs Is Top Issue in Presidential Race
Clinton and Trump have both highlighted jobs and employment issues in their advertising with nearly 6 out of every 10 presidential ads mentioning those issues (nearly 67 percent of Clinton-sponsored ads and roughly 63 percent of Trump-sponsored ads). Pro-Clinton groups are attacking primarily on social and women’s issues along with foreign policy and immigration, while Pro-Trump groups are highlighting funding for the Clinton Foundation and its ties to big banks/corporations, with gun rights taking a distant third place.
![]()
Table 11: Top Issues in Presidential Race by Sponsor
| Clinton | Pro-Clinton Groups | Trump | Pro-Trump Groups |
|---|---|---|---|
| Jobs/Employment | Women's health | Jobs/Employment | Gov't ethics/scandal |
| Trade/globalization | Terrorism | Minimum wage | Wall Street |
| Energy/environment | Iraq/War in Iraq | Taxes | Gun control |
| Figures are from August 19, 2016 to September 15, 2016. CITE SOURCE OF DATA AS: Kantar Media/CMAG with analysis by the Wesleyan Media Project. |
|||
Appendix
Table A: US Senate Advertising by Race and Sponsor (since August 19)
| Race | Sponsor | Type | Party | Airings | Est. Cost (in Ms) |
|---|---|---|---|---|---|
| Alaska | MURKOWSKI, LISA | Candidate | Rep | 38 | 0.006 |
| Arkansas | BOOZMAN, JOHN | Candidate | Rep | 167 | 0.07 |
| Arizona | KIRKPATRICK, ANN | Candidate | Dem | 1,497 | 1.1 |
| Arizona | MCCAIN, JOHN | Candidate | Rep | 796 | 0.6 |
| Arizona | MCCAIN, JOHN & NATIONAL REPUBLICAN SENATORIAL COMMITTEE | Candidate & Party | Rep | 811 | 0.4 |
| Arizona | ARIZONA GRASSROOTS ACTION PAC | Group | Rep | 732 | 0.7 |
| Arizona | KELLIPAC | Group | Rep | 403 | 0.4 |
| Arizona | NATIONAL ASSOCIATION FOR GUN RIGHTS PAC | Group | Rep | 1 | 0.001 |
| Arizona | U.S. CHAMBER OF COMMERCE | Group | Rep | 316 | 0.2 |
| Colorado | BENNET, MICHAEL | Candidate | Dem | 1,289 | 0.9 |
| Florida | DE LA FUENTE, ROCKY | Candidate | Dem | 94 | 0.04 |
| Florida | GRAYSON, ALAN | Candidate | Dem | 425 | 0.09 |
| Florida | MURPHY, PATRICK | Candidate | Dem | 879 | 0.8 |
| Florida | AFSCME PEOPLE | Group | Dem | 125 | 0.2 |
| Florida | NARAL PRO-CHOICE AMERICA | Group | Dem | 201 | 0.1 |
| Florida | SENATE MAJORITY PAC | Group | Dem | 133 | 0.2 |
| Florida | RUBIO, MARCO | Candidate | Rep | 381 | 0.2 |
| Florida | RUBIO, MARCO & NATIONAL REPUBLICAN SENATORIAL COMMITTEE | Candidate & Party | Rep | 1,549 | 0.6 |
| Florida | AMERICAN FUTURE FUND | Group | Rep | 1,014 | 1.2 |
| Florida | AMERICANS FOR PROSPERITY | Group | Rep | 175 | 0.2 |
| Florida | LIBRE INITIATIVE | Group | Rep | 415 | 0.4 |
| Florida | NATIONAL REPUBLICAN SENATORIAL COMMITTEE | PARTY | Rep | 698 | 0.5 |
| Georgia | ISAKSON, JOHNNY | Candidate | Rep | 710 | 0.4 |
| Iowa | JUDGE, PATTY | Candidate | Dem | 928 | 0.4 |
| Iowa | GRASSLEY, CHUCK | Candidate | Rep | 1,342 | 0.9 |
| Idaho | CRAPO, MIKE | Candidate | Rep | 327 | 0.05 |
| Illinois | DUCKWORTH, TAMMY | Candidate | Dem | 1,546 | 0.7 |
| Illinois | KIRK, MARK | Candidate | Rep | 6 | 0.006 |
| Illinois | INDEPENDENT VOICE FOR ILLINOIS PAC | Group | Rep | 1,368 | 0.3 |
| Indiana | BAYH, EVAN | Candidate | Dem | 5,389 | 2.1 |
| Indiana | SENATE MAJORITY PAC | Group | Dem | 65 | 0.04 |
| Indiana | YOUNG, TODD | Candidate | Rep | 686 | 0.4 |
| Indiana | YOUNG, TODD & NATIONAL REPUBLICAN SENATORIAL COMMITTEE | Candidate & Party | Rep | 3,036 | 0.5 |
| Indiana | SENATE LEADERSHIP FUND | Group | Rep | 791 | 0.5 |
| Indiana | U.S. CHAMBER OF COMMERCE | Group | Rep | 1,528 | 1.1 |
| Indiana | NATIONAL REPUBLICAN SENATORIAL COMMITTEE | Party | Rep | 929 | 0.3 |
| Kansas | MORAN, JERRY | Candidate | Rep | 18 | 0.01 |
| Kentucky | GRAY, JIM | Candidate | Dem | 275 | 0.2 |
| Kentucky | PAUL, RAND | Candidate | Rep | 40 | 0.02 |
| Louisiana | PELLERIN, JOSH | Candidate | Dem | 10 | 0.005 |
| Louisiana | BOUSTANY, CHARLES | Candidate | Rep | 814 | 0.6 |
| Louisiana | FLEMING, JOHN | Candidate | Rep | 1,955 | 0.7 |
| Louisiana | ESA FUND | Group | Rep | 1 | 0.0005 |
| Missouri | KANDER, JASON | Candidate | Dem | 1,349 | 0.6 |
| Missouri | KANDER, JASON & DEMOCRATIC SENATORIAL CAMPAIGN COMMITTEE | Candidate & Party | Dem | 1,445 | 0.4 |
| Missouri | END CITIZENS UNITED | Group | Dem | 197 | 0.2 |
| Missouri | BLUNT, ROY | Candidate | Rep | 3,049 | 1.2 |
| Missouri | BLUNT, ROY & NATIONAL REPUBLICAN SENATORIAL COMMITTEE | Candidate & Party | Rep | 540 | 0.2 |
| Missouri | HEARTLAND RESURGENCE | Group | Rep | 143 | 0.04 |
| Missouri | NRA POLITICAL VICTORY FUND | Group | Rep | 486 | 0.3 |
| Missouri | ONE NATION | Group | Rep | 547 | 0.5 |
| Missouri | SENATE LEADERSHIP FUND | Group | Rep | 336 | 0.3 |
| North Carolina | ROSS, DEBORAH | Candidate | Dem | 2,064 | 1.1 |
| North Carolina | DEMOCRACY FOR AMERICA | Group | Dem | 84 | 0.05 |
| North Carolina | BURR, RICHARD | Candidate | Rep | 948 | 0.8 |
| North Carolina | BURR, RICHARD & NATIONAL REPUBLICAN SENATORIAL COMMITTEE | Candidate & Party | Rep | 804 | 0.2 |
| North Carolina | NRA POLITICAL VICTORY FUND | Group | Rep | 184 | 0.2 |
| North Carolina | ONE NATION | Group | Rep | 957 | 1.4 |
| North Carolina | SENATE LEADERSHIP FUND | Group | Rep | 361 | 0.3 |
| New Hampshire | HASSAN, MAGGIE | Candidate | Dem | 1,936 | 1.6 |
| New Hampshire | AFSCME PEOPLE | Group | Dem | 54 | 0.3 |
| New Hampshire | END CITIZENS UNITED | Group | Dem | 266 | 0.6 |
| New Hampshire | INDEPENDENCE USA PAC | Group | Dem | 780 | 2.0 |
| New Hampshire | MAJORITY FORWARD | Group | Dem | 616 | 2.1 |
| New Hampshire | NEA ADVOCACY FUND | Group | Dem | 402 | 1.6 |
| New Hampshire | PLANNED PARENTHOOD VOTES | Group | Dem | 278 | 0.7 |
| New Hampshire | SENATE MAJORITY PAC | Group | Dem | 367 | 0.9 |
| New Hampshire | WOMEN VOTE | Group | Dem | 118 | 0.4 |
| New Hampshire | DEMOCRATIC SENATORIAL CAMPAIGN COMMITTEE | Party | Dem | 171 | 0.04 |
| New Hampshire | AYOTTE, KELLY | Candidate | Rep | 1,432 | 1.3 |
| New Hampshire | GRANITE STATE SOLUTIONS | Group | Rep | 1,536 | 4.6 |
| New Hampshire | SECURITY IS STRENGTH PAC | Group | Rep | 45 | 0.2 |
| New Hampshire | NATIONAL REPUBLICAN SENATORIAL COMMITTEE | Party | Rep | 509 | 0.4 |
| Nevada | MASTO, CATHERINE CORTEZ | Candidate | Dem | 2,717 | 1.7 |
| Nevada | AFSCME PEOPLE | Group | Dem | 14 | 0.005 |
| Nevada | END CITIZENS UNITED | Group | Dem | 1,362 | 0.5 |
| Nevada | LCV VICTORY FUND | Group | Dem | 729 | 0.4 |
| Nevada | SENATE MAJORITY PAC | Group | Dem | 1,267 | 0.6 |
| Nevada | DEMOCRATIC SENATORIAL CAMPAIGN COMMITTEE | Party | Dem | 1,297 | 0.4 |
| Nevada | HECK, JOE | Candidate | Rep | 1,231 | 1.0 |
| Nevada | HECK, JOE & NATIONAL REPUBLICAN SENATORIAL COMMITTEE | Candidate & Party | Rep | 272 | 0.09 |
| Nevada | FREEDOM PARTNERS ACTION FUND | Group | Rep | 2,118 | 0.9 |
| Nevada | ONE NATION | Group | Rep | 195 | 0.05 |
| Nevada | SENATE LEADERSHIP FUND | Group | Rep | 340 | 0.1 |
| Nevada | NATIONAL REPUBLICAN SENATORIAL COMMITTEE | Party | Rep | 2,329 | 0.8 |
| Ohio | STRICKLAND, TED | Candidate | Dem | 2,166 | 1.6 |
| Ohio | STRICKLAND, TED & DEMOCRATIC SENATORIAL CAMPAIGN COMMITTEE | Candidate & Party | Dem | 541 | 0.3 |
| Ohio | AFSCME | Group | Dem | 728 | 0.5 |
| Ohio | PORTMAN, ROB | Candidate | Rep | 3,168 | 2.2 |
| Ohio | PORTMAN, ROB & NATIONAL REPUBLICAN SENATORIAL COMMITTEE | Candidate & Party | Rep | 43 | 0.03 |
| Ohio | FIGHTING FOR OHIO FUND | Group | Rep | 1,939 | 0.8 |
| Ohio | FREEDOM PARTNERS ACTION FUND | Group | Rep | 1,215 | 0.9 |
| Ohio | U.S. CHAMBER OF COMMERCE | Group | Rep | 373 | 0.3 |
| Ohio | NATIONAL REPUBLICAN SENATORIAL COMMITTEE | Party | Rep | 1,220 | 0.7 |
| Pennsylvania | MCGINTY, KATIE | Candidate | Dem | 2,325 | 1.2 |
| Pennsylvania | MCGINTY, KATIE & DEMOCRATIC SENATORIAL CAMPAIGN COMMITTEE | Candidate & Party | Dem | 1,146 | 0.4 |
| Pennsylvania | AFSCME PEOPLE | Group | Dem | 390 | 0.2 |
| Pennsylvania | END CITIZENS UNITED | Group | Dem | 1,047 | 0.5 |
| Pennsylvania | LCV VICTORY FUND | Group | Dem | 635 | 0.4 |
| Pennsylvania | PLANNED PARENTHOOD VOTES | Group | Dem | 497 | 0.2 |
| Pennsylvania | SENATE MAJORITY PAC | Group | Dem | 3,882 | 1.7 |
| Pennsylvania | DEMOCRATIC SENATORIAL CAMPAIGN COMMITTEE | Party | Dem | 664 | 0.5 |
| Pennsylvania | TOOMEY, PAT | Candidate | Rep | 2,020 | 1.3 |
| Pennsylvania | AMERICANS FOR PROSPERITY | Group | Rep | 280 | 0.1 |
| Pennsylvania | FREEDOM PARTNERS ACTION FUND | Group | Rep | 3,146 | 1.2 |
| Pennsylvania | INDEPENDENCE USA PAC | Group | Rep | 1,046 | 0.9 |
| Pennsylvania | ONE NATION | Group | Rep | 475 | 0.3 |
| Pennsylvania | NATIONAL REPUBLICAN SENATORIAL COMMITTEE | Party | Rep | 712 | 0.7 |
| Vermont | LEAHY, PATRICK | Candidate | Dem | 51 | 0.03 |
| Wisconsin | FEINGOLD, RUSS | Candidate | Dem | 4,845 | 1.5 |
| Wisconsin | ENVIRONMENTAL DEFENSE ACTION FUND | Group | Dem | 133 | 0.1 |
| Wisconsin | JOHNSON, RON | Candidate | Rep | 1,398 | 0.6 |
| Wisconsin | FREEDOM PARTNERS ACTION FUND | Group | Rep | 989 | 0.5 |
| Wisconsin | LET AMERICA WORK | Group | Rep | 450 | 0.4 |
Figures are from August 19, 2016 to September 15, 2016.
CITE SOURCE OF DATA AS: Kantar Media/CMAG with analysis by the Wesleyan Media Project.
Table B: US House Advertising by Race and Sponsor (since August 19)
| State | Race | Sponsor | Type | Party | Airings | Est. Cost (in Ms) |
|---|---|---|---|---|---|---|
| AK | AK01 | LINDBECK, STEVE | Candidate | Dem | 181 | 0.03 |
| AZ | AZ01 | DEMOCRATIC CONGRESSIONAL CAMPAIGN COMMITTEE | Party | Dem | 547 | 0.4 |
| AZ | AZ01 | ROGERS, WENDY | Candidate | Rep | 119 | 0.05 |
| AZ | AZ02 | HEINZ, MATT | Candidate | Dem | 837 | 0.3 |
| AZ | AZ02 | MCSALLY, MARTHA | Candidate | Rep | 401 | 0.3 |
| AZ | AZ05 | JONES, CHRISTINE | Candidate | Rep | 735 | 0.5 |
| AZ | AZ05 | STAPLEY, DON | Candidate | Rep | 26 | 0.03 |
| AZ | AZ09 | CENTER FORWARD | Group | Dem | 316 | 0.3 |
| CA | CA07 | BERA, AMI | Candidate | Dem | 459 | 0.2 |
| CA | CA20 | LUCIUS, CASEY | Candidate | Rep | 221 | 0.06 |
| CA | CA24 | CARBAJAL, SALUD | Candidate | Dem | 107 | 0.01 |
| CA | CA24 | NATIONAL REPUBLICAN CONGRESSIONAL COMMITTEE | Party | Rep | 582 | 0.07 |
| CA | CA36 | RUIZ, RAUL | Candidate | Dem | 598 | 0.1 |
| CA | CA52 | PETERS, SCOTT | Candidate | Dem | 66 | 0.04 |
| CA | CA52 | CENTER FORWARD | Group | Dem | 343 | 0.2 |
| CO | CO06 | CARROLL, MORGAN | Candidate | Dem | 314 | 0.4 |
| CO | CO06 | COFFMAN, MIKE | Candidate | Rep | 16 | 0.05 |
| DE | DE01 | BARNEY, SEAN | Candidate | Dem | 244 | 0.2 |
| DE | DE01 | BLUNT ROCHESTER, LISA | Candidate | Dem | 245 | 0.3 |
| DE | DE01 | VOTE VETS ACTION FUND | Group | Dem | 60 | 0.05 |
| FL | FL01 | EVERS, GREG | Candidate | Rep | 33 | 0.01 |
| FL | FL01 | GAETZ, MATT | Candidate | Rep | 421 | 0.1 |
| FL | FL01 | ZUMWALT, JAMES | Candidate | Rep | 29 | 0.01 |
| FL | FL01 | NORTH FLORIDA NEIGHBORS | Group | Rep | 43 | 0.03 |
| FL | FL02 | DUNN, NEAL | Candidate | Rep | 525 | 0.2 |
| FL | FL02 | SUKHIA, KEN | Candidate | Rep | 134 | 0.03 |
| FL | FL02 | THOMAS, MARY | Candidate | Rep | 662 | 0.1 |
| FL | FL02 | CLUB FOR GROWTH ACTION | Group | Rep | 207 | 0.1 |
| FL | FL02 | ESA FUND | Group | Rep | 236 | 0.1 |
| FL | FL02 | SENATE CONSERVATIVES ACTION | Group | Rep | 177 | 0.08 |
| FL | FL04 | MALIN, ED | Candidate | Rep | 6 | 0.0007 |
| FL | FL04 | MCCLURE, BILL | Candidate | Rep | 104 | 0.03 |
| FL | FL04 | RAY, LAKE | Candidate | Rep | 12 | 0.006 |
| FL | FL04 | RUTHERFORD, JOHN | Candidate | Rep | 40 | 0.02 |
| FL | FL04 | TANZLER, HANS | Candidate | Rep | 328 | 0.08 |
| FL | FL04 | CONSERVATIVES UNITED | Group | Rep | 21 | 0.006 |
| FL | FL05 | LAWSON, AL | Candidate | Dem | 30 | 0.009 |
| FL | FL06 | DESANTIS, RON | Candidate | Rep | 267 | 0.1 |
| FL | FL07 | MURPHY, STEPHANIE & DEMOCRATIC CONGRESSIONAL CAMPAIGN COMMITTEE | Cand. & Party | Dem | 77 | 0.04 |
| FL | FL09 | GRAYSON, DENA | Candidate | Dem | 199 | 0.9 |
| FL | FL10 | DEMINGS, VAL | Candidate | Dem | 116 | 0.1 |
| FL | FL10 | POE, BOB | Candidate | Dem | 1 | 0.001 |
| FL | FL10 | INDEPENDENCE USA PAC | Group | Dem | 320 | 0.3 |
| FL | FL13 | JOLLY, DAVID | Candidate | Rep | 23 | 0.02 |
| FL | FL18 | CHANE, JONATHAN | Candidate | Dem | 74 | 0.02 |
| FL | FL18 | PERKINS, RANDY | Candidate | Dem | 1,127 | 0.5 |
| FL | FL18 | DOMINO, CARL | Candidate | Rep | 135 | 0.06 |
| FL | FL18 | FREEMAN, MARK | Candidate | Rep | 235 | 0.09 |
| FL | FL18 | KOZELL, RICK | Candidate | Rep | 47 | 0.02 |
| FL | FL18 | MAST, BRIAN | Candidate | Rep | 137 | 0.07 |
| FL | FL18 | NEGRON, REBECCA | Candidate | Rep | 190 | 0.09 |
| FL | FL18 | MAST, BRIAN & NATIONAL REPUBLICAN CONGRESSIONAL COMMITTEE | Cand. & Party | Rep | 3 | 0.0008 |
| FL | FL18 | CONSERVATIVE CONGRESS NOW | Group | Rep | 130 | 0.08 |
| FL | FL18 | NATIONAL REPUBLICAN CONGRESSIONAL COMMITTEE | Party | Rep | 210 | 0.09 |
| FL | FL19 | BONGINO, DAN | Candidate | Rep | 31 | 0.02 |
| FL | FL19 | GOSS, CHAUNCEY | Candidate | Rep | 28 | 0.02 |
| FL | FL19 | ROONEY, FRANCIS | Candidate | Rep | 1,311 | 0.5 |
| FL | FL23 | CANOVA, TIM | Candidate | Dem | 341 | 0.3 |
| FL | FL23 | WASSERMAN-SCHULTZ, DEBBIE | Candidate | Dem | 326 | 0.3 |
| FL | FL25 | EDF ACTION | Group | Rep | 58 | 0.08 |
| FL | FL26 | TADDEO, ANNETTE | Candidate | Dem | 83 | 0.07 |
| FL | FL26 | CURBELO, CARLOS | Candidate | Rep | 85 | 0.2 |
| FL | FL26 | EDF ACTION | Group | Rep | 109 | 0.1 |
| FL | FL27 | ROS-LEHTINEN, ILEANA | Candidate | Rep | 253 | 0.3 |
| IA | IA01 | VERNON, MONICA | Candidate | Dem | 496 | 0.2 |
| IA | IA01 | HOUSE MAJORITY PAC | Group | Dem | 118 | 0.03 |
| IA | IA01 | BLUM, ROD | Candidate | Rep | 435 | 0.2 |
| IA | IA01 | NATIONAL REPUBLICAN CONGRESSIONAL COMMITTEE | Party | Rep | 67 | 0.01 |
| IA | IA03 | DEMOCRATIC CONGRESSIONAL CAMPAIGN COMMITTEE | Candidate | Dem | 93 | 0.03 |
| IA | IA03 | MOWRER, JIM | Candidate | Dem | 310 | 0.2 |
| IA | IA03 | YOUNG, DAVID | Candidate | Rep | 473 | 0.2 |
| IL | IL10 | SCHNEIDER, BRAD | Candidate | Dem | 95 | 0.2 |
| IL | IL10 | DOLD, ROBERT | Candidate | Rep | 20 | 0.07 |
| IL | IL12 | BARICEVIC, CJ | Candidate | Dem | 322 | 0.2 |
| IL | IL12 | BOST, MIKE | Candidate | Rep | 196 | 0.2 |
| IN | IN02 | COLEMAN, LYNN | Candidate | Dem | 174 | 0.05 |
| IN | IN02 | WALORSKI, JACKIE | Candidate | Rep | 342 | 0.1 |
| IN | IN09 | HOLLINGSWORTH, TREY | Candidate | Rep | 168 | 0.1 |
| KS | KS03 | YODER, KEVIN | Candidate | Rep | 34 | 0.02 |
| KY | KY06 | BARR, ANDY | Candidate | Rep | 275 | 0.1 |
| LA | LA02 | AMERICAN CHEMISTRY COUNCIL & NORTH AMERICA'S BUILDING TRADES UNIONS | Group | Dem | 223 | 0.1 |
| LA | LA03 | ELLISON, GREG | Candidate | Rep | 175 | 0.09 |
| LA | LA04 | JONES, MARSHALL | Candidate | Dem | 2 | 0.002 |
| LA | LA04 | BAUCUM, TREY | Candidate | Rep | 105 | 0.05 |
| LA | LA04 | JENKINS, OLIVER | Candidate | Rep | 61 | 0.03 |
| ME | ME02 | CAIN, EMILY | Candidate | Dem | 134 | 0.04 |
| ME | ME02 | END CITIZENS UNITED | Group | Dem | 812 | 0.2 |
| ME | ME02 | HOUSE MAJORITY PAC | Group | Dem | 1,446 | 0.5 |
| ME | ME02 | POLIQUIN, BRUCE | Candidate | Rep | 498 | 0.2 |
| ME | ME02 | NATIONAL REPUBLICAN CONGRESSIONAL COMMITTEE | Party | Rep | 447 | 0.09 |
| MI | MI01 | NATIONAL REPUBLICAN CONGRESSIONAL COMMITTEE | Party | Rep | 148 | 0.03 |
| MI | MI07 | DRISKELL, GRETCHEN | Candidate | Dem | 1,307 | 0.5 |
| MI | MI07 | WALBERG, TIM | Candidate | Rep | 334 | 0.07 |
| N/A | MI07 | WALBERG, TIM | Candidate | Rep | 11 | 0.003 |
| MN | MN02 | CRAIG, ANGIE | Candidate | Dem | 991 | 0.9 |
| MN | MN03 | BONOFF, TERRI | Candidate | Dem | 72 | 0.09 |
| MN | MN03 | DEMOCRATIC CONGRESSIONAL CAMPAIGN COMMITTEE | Party | Dem | 518 | 0.3 |
| MN | MN03 | PAULSEN, ERIK | Candidate | Rep | 210 | 0.3 |
| MN | MN08 | NOLAN, RICK | Candidate | Dem | 622 | 0.4 |
| MN | MN08 | HOUSE MAJORITY PAC | Group | Dem | 958 | 0.6 |
| MN | MN08 | DEMOCRATIC CONGRESSIONAL CAMPAIGN COMMITTEE | Party | Dem | 818 | 0.4 |
| MN | MN08 | MILLS, STEWART | Candidate | Rep | 573 | 0.4 |
| MN | MN08 | NATIONAL REPUBLICAN CONGRESSIONAL COMMITTEE | Party | Rep | 346 | 0.3 |
| MT | MT01 | JUNEAU, DENISE | Candidate | Dem | 2,477 | 0.3 |
| MT | MT01 | ZINKE, RYAN | Candidate | Rep | 1,632 | 0.2 |
| NE | NE02 | ASHFORD, BRAD | Candidate | Dem | 427 | 0.1 |
| NE | NE02 | CENTER FORWARD | Group | Dem | 164 | 0.06 |
| NE | NE02 | PAC OF CREDIT UNION NATIONAL ASSOCIATION | Group | Dem | 82 | 0.06 |
| NE | NE02 | DEMOCRATIC CONGRESSIONAL CAMPAIGN COMMITTEE | Party | Dem | 399 | 0.1 |
| NE | NE02 | BACON, DON | Candidate | Rep | 162 | 0.05 |
| NE | NE02 | NATIONAL REPUBLICAN CONGRESSIONAL COMMITTEE | Party | Rep | 473 | 0.1 |
| NH | NH01 | ASHOOH, RICH | Candidate | Rep | 74 | 0.04 |
| NH | NH02 | KUSTER, ANN | Candidate | Dem | 63 | 0.03 |
| NJ | NJ05 | GARRETT, SCOTT | Candidate | Rep | 14 | 0.06 |
| NV | NV03 | DEMOCRATIC CONGRESSIONAL CAMPAIGN COMMITTEE | Party | Dem | 376 | 0.2 |
| NV | NV03 | NATIONAL REPUBLICAN CONGRESSIONAL COMMITTEE & TARKANIAN, DANNY | Cand. & Party | Rep | 261 | 0.1 |
| NV | NV04 | KIHUEN, RUBEN & DEMOCRATIC CONGRESSIONAL CAMPAIGN COMMITTEE | Cand. & Party | Dem | 49 | 0.03 |
| NV | NV04 | HARDY, CRESENT | Candidate | Rep | 1 | 0.001 |
| NV | NV04 | HARDY, CRESENT & NATIONAL REPUBLICAN CONGRESSIONAL COMMITTEE | Cand. & Party | Rep | 52 | 0.03 |
| NV | NV04 | NATIONAL REPUBLICAN CONGRESSIONAL COMMITTEE | Party | Rep | 374 | 0.2 |
| NY | NY01 | THRONE-HOLST, ANNA | Candidate | Dem | 54 | 0.1 |
| NY | NY19 | TEACHOUT, ZEPHYR | Candidate | Dem | 97 | 0.03 |
| NY | NY21 | DERRICK, MIKE | Candidate | Dem | 524 | 0.1 |
| NY | NY21 | STEFANIK, ELISE | Candidate | Rep | 117 | 0.03 |
| NY | NY22 | MYERS, KIM | Candidate | Dem | 1,185 | 0.3 |
| NY | NY22 | HOUSE MAJORITY PAC | Group | Dem | 1,077 | 0.2 |
| NY | NY22 | BABINEC, MARTIN | Candidate | OTHER | 833 | 0.1 |
| NY | NY23 | PLUMB, JOHN | Candidate | Dem | 1,540 | 0.4 |
| NY | NY23 | REED, TOM | Candidate | Rep | 361 | 0.2 |
| NY | NY24 | DEACON, COLLEEN | Candidate | Dem | 841 | 0.2 |
| NY | NY24 | KATKO, JOHN | Candidate | Rep | 597 | 0.3 |
| NY | NY25 | SLAUGHTER, LOUISE | Candidate | Dem | 256 | 0.05 |
| OH | OH15 | STIVERS, STEVE | Candidate | Rep | 3 | 0.002 |
| OK | OK05 | GUILD, TOM | Candidate | Dem | 12 | 0.001 |
| OR | OR05 | AMERICAN CHEMISTRY COUNCIL & NORTH AMERICA'S BUILDING TRADES UNIONS | Group | Dem | 286 | 0.2 |
| PA | PA08 | SANTARSIERO, STEVE | Candidate | Dem | 189 | 0.2 |
| TX | TX23 | GALLEGO, PETE | Candidate | Dem | 263 | 0.3 |
| TX | TX23 | DEMOCRATIC CONGRESSIONAL CAMPAIGN COMMITTEE | Party | Dem | 185 | 0.1 |
| TX | TX23 | HURD, WILL | Candidate | Rep | 428 | 0.4 |
| UT | UT04 | OWENS, DOUG | Candidate | Dem | 613 | 0.2 |
| UT | UT04 | LOVE, MIA | Candidate | Rep | 470 | 0.2 |
| VA | VA05 | DITTMAR, JANE | Candidate | Dem | 656 | 0.09 |
| VA | VA10 | BENNETT, LUANN | Candidate | Dem | 464 | 0.9 |
| WA | WA05 | RODGERS, CATHY | Candidate | Rep | 1 | 0.0003 |
| WI | WI08 | NELSON, TOM | Candidate | Dem | 606 | 0.2 |
| WI | WI08 | GALLAGHER, MIKE | Candidate | Rep | 392 | 0.1 |
| WI | WI08 | LASEE, FRANK | Candidate | Rep | 16 | 0.001 |
Figures are from August 19, 2016 to September 15, 2016.
CITE SOURCE OF DATA AS: Kantar Media/CMAG with analysis by the Wesleyan Media Project.
![]()
Table C: Gubernatorial Advertising by Race and Sponsor (since August 19)
| Race | Sponsor | Type | Party | Airings | Est. Cost (in Ms) |
|---|---|---|---|---|---|
| IN | GREGG, JOHN | Candidate | Dem | 2,895 | 1.1 |
| IN | HOLCOMB, ERIC | Candidate | Rep | 2,035 | 0.7 |
| IN | RGA RIGHT DIRECTION PAC | Party | Rep | 442 | 0.1 |
| MO | KOSTER, CHRIS | Candidate | Dem | 5,799 | 2.3 |
| MO | GREITENS, ERIC | Candidate | Rep | 3,249 | 1.5 |
| MT | BULLOCK, STEVE | Candidate | Dem | 3,043 | 0.4 |
| MT | GOOD JOBS MONTANA | Group | Dem | 1,543 | 0.3 |
| MT | GIANFORTE, GREG | Candidate | Rep | 5,033 | 0.6 |
| MT | RGA RIGHT DIRECTION PAC | Party | Rep | 299 | 0.03 |
| NC | COOPER, ROY | Candidate | Dem | 5,695 | 3.0 |
| NC | NORTH CAROLINA CITIZENS FOR PROTECTING OUR SCHOOLS | Group | Dem | 846 | 0.5 |
| NC | MCCRORY, PAT | Candidate | Rep | 3,391 | 2.0 |
| NC | REPUBLICAN GOVERNORS ASSOCIATION | Party | Rep | 1,466 | 0.5 |
| NH | CONNOLLY, MARK | Candidate | Dem | 183 | 0.1 |
| NH | VAN OSTERN, COLIN | Candidate | Dem | 313 | 0.2 |
| NH | EDELBLUT, FRANK | Candidate | Rep | 173 | 0.09 |
| NH | GATSAS, TED | Candidate | Rep | 613 | 0.3 |
| NH | SUNUNU, CHRIS | Candidate | Rep | 234 | 0.1 |
| OR | BROWN, KATE | Candidate | Dem | 44 | 0.02 |
| OR | PIERCE, BUD | Candidate | Rep | 173 | 0.08 |
| UT | WEINHOLTZ, MIKE | Candidate | Dem | 91 | 0.09 |
| UT | HERBERT, GARY | Candidate | Rep | 1 | 0.001 |
| VT | MINTER, SUE | Candidate | Dem | 76 | 0.02 |
| VT | OUR VT | Group | Dem | 220 | 0.1 |
| VT | SCOTT, PHIL | Candidate | Rep | 761 | 0.2 |
| VT | A STRONGER VERMONT | Group | Rep | 320 | 0.09 |
| WV | JUSTICE, JIM | Candidate | Dem | 890 | 0.2 |
| WV | GOOD JOBS WEST VIRGINIA | Group | Dem | 1,328 | 0.5 |
| WV | COLE, BILL | Candidate | Rep | 1,202 | 0.3 |
Figures are from August 19, 2016 to September 15, 2016.
CMAG classifies both RGA and RGA Right Direction PAC as parties, as both explicitly mention RGA (“Republican Governors Assn.”).
CITE SOURCE OF DATA AS: Kantar Media/CMAG with analysis by the Wesleyan Media Project.
![]()
Download a PDF of this report here
![]()
![]()
About This Report
Data reported here do not cover local cable buys, only broadcast television, national network and national cable buys. We include all ads that mention individuals running for office, and therefore sums may include issue advocacy advertising. All cost estimates are precisely that: estimates. Disclosure categorization information on outside groups comes from the Center for Responsive Politics.
The Wesleyan Media Project provides real-time tracking and analysis of all political television advertising in an effort to increase transparency in elections. Housed in Wesleyan’s Quantitative Analysis Center – part of the Allbritton Center for the Study of Public Life – the Wesleyan Media Project is the successor to the Wisconsin Advertising Project, which disbanded in 2009. It is directed by Erika Franklin Fowler, associate professor of government at Wesleyan University, Michael M. Franz, associate professor of government at Bowdoin College and Travis N. Ridout, professor of political science at Washington State University. WMP staff include Laura Baum (Project Manager), Dolly Haddad (Project Coordinator) and Matthew Motta (Research Associate).
The Wesleyan Media Project is supported by grants from The John S. and James L. Knight Foundation and Wesleyan University. Data provided by Kantar Media/CMAG with analysis by the Wesleyan Media Project using Academiclip, a web-based coding tool. The Wesleyan Media Project is partnering this year with both the Center for Responsive Politics, to provide added information on outside group disclosure, and Ace Metrix, to assess ad effectiveness.
Periodic releases of data will be posted on the project’s website and dispersed via Twitter @wesmediaproject.
![]()
For more information contact:
Heather Tolley-Bauer, htolleybauer@wesleyan.edu, (860) 398-9018
![]()
About Wesleyan University
Wesleyan University, in Middletown, Conn., is known for the excellence of its academic and co-curricular programs. With more than 2,900 undergraduates and 200 graduate students, Wesleyan is dedicated to providing a liberal arts education characterized by boldness, rigor and practical idealism. For more, visit www.wesleyan.edu.
About the John S. and James L. Knight Foundation
Knight Foundation supports transformational ideas that promote quality journalism, advance media innovation, engage communities and foster the arts. We believe that democracy thrives when people and communities are informed and engaged. For more, visit www.knightfoundation.org.
About the Center for Responsive Politics
The Center for Responsive Politics is the nation’s premier research group tracking money in U.S. politics and its effect on elections and public policy. Nonpartisan, independent and nonprofit, the organization aims to create a more educated voter, an involved citizenry and a more transparent and responsive government. CRP’s award-winning website, OpenSecrets.org, is the most comprehensive resource available anywhere for federal campaign contribution and lobbying data and analysis.
![]()


