
Image: OpenSecrets
Super PACs dominate 2016;
“Dark Money” a consistent but growing presence since 2000;
Outside Groups at all-time high in share of ads aired;
most groups active in only one election cycle
August 24, 2016
(MIDDLETOWN, CT) August 24, 2016 – A new historical analysis of political advertising data by the Wesleyan Media Project, in partnership with the Center for Responsive Politics, reveals several important findings about the involvement of outside groups in elections over the past decade and a half. In particular, the report provides an in-depth assessment of outside group advertising (2.4 million airings) over time, examining trends in the activity of different types of groups (as defined by their donor disclosure) and the involvement of different groups at various points in an election cycle.
For our August 2016 election report, click here.
Highlights of the special report
- There has been a vast increase in the volume of advertising sponsored by outside groups between 2000 and 2016.
- The share of ads sponsored by outside groups between 2000 and 2016 has increased dramatically.
- Whereas 527 organizations dominated advertising in 2004, super PACs now sponsor the most outside group advertising.
- Dark money groups (also known as non-disclosing groups) have been a consistent presence since 2000 and are much more active before the FEC’s 60-day reporting window. The overall volume of ad buys from dark money groups has increased in recent cycles, and even though the share of ads from dark money groups has declined relative to super PACs, their raw ad totals remain high.
- The vast majority of groups are active in a single election cycle.
For the last nine election cycles, the Wesleyan Media Project and its predecessor, the Wisconsin Advertising Project, have coded political ads airing on local broadcast television stations across the country. As part of that work, both projects have tracked airings by candidates and formal party organizations in addition to outside groups who not only advocate on behalf of or in opposition to candidates for federal and state office but also advertise about issues and public policy debates, often highlighting—in a positive or negative light—the policy positions of those candidates. Outside groups come in many forms, which vary in the extent to which they report donors to federal or state campaign finance regulators, with some (specifically “dark money” organizations) not publicly reporting their donors.
This report focuses on the efforts of outside groups in federal elections since 2000, documenting both the growing presence of these groups in federal elections over the last nine election cycles and the many different types of groups involved in federal elections and how they are involved. We pay special attention to dark money groups and their activity relative to the FEC reporting windows.
Group-Sponsored Ads Skyrocket since 2000
The motivation for this report is one important fact: Outside group involvement in television advertising in federal elections has grown substantially over the past decade and a half for which the Wesleyan Media Project has tracking data. In our previous work, we have established some of the following:
- Outside groups sponsored more than half of all Republican primary ads in the 2012 and 2016 presidential race but were largely inactive in such primary election contests in previous years.
- Outside groups aired more ads in the 2012 presidential general election than in any previous presidential election.
- Outside groups sponsored nearly 30 percent of all ads aired in congressional primary and general elections in 2012 and 2014.
- Groups are much more heavily involved in competitive contests than non-competitive ones.
For our analyses, we examined all ads aired in federal elections between 2000 and 2016. The Wisconsin Advertising Project tracked ads in the top 75 media markets in the election of 2000; that number expanded to the top 100 markets in 2002 and 2004. The Wesleyan Media Project tracked ads in the top 100 markets in 2006 and expanded to include all 210 media markets from 2008 through 2016 (2008 data were analyzed by Wisconsin). We also only include ads aired on local broadcast stations and national cable networks, excluding local cable buys, radio ads, and print and digital ads.
First, the volume of ads sponsored by groups has increased considerably over time. Tracking data show just under 80,000 airings by outside groups in federal elections in 2000—about 10 percent of all ads—compared to nearly 880,000 in the 2012 election cycle, which accounted for more than 1 in every 4 ads aired that election cycle.
Second, and as shown in Figure 1, group advertising as a proportion of all ads on the air has also grown steadily since 2006. Group-sponsored advertising accounted for 14 percent of all airings in 2004 (groups sponsored 1 in every 5 presidential ads that year but only 4 percent of congressional ads) but rose to nearly a third (32.5 percent) of all airings in 2016 cycle-to-date.
Figure 1: Outside Group Activity as a Percentage of All Federal Airings (Primary & General Election)
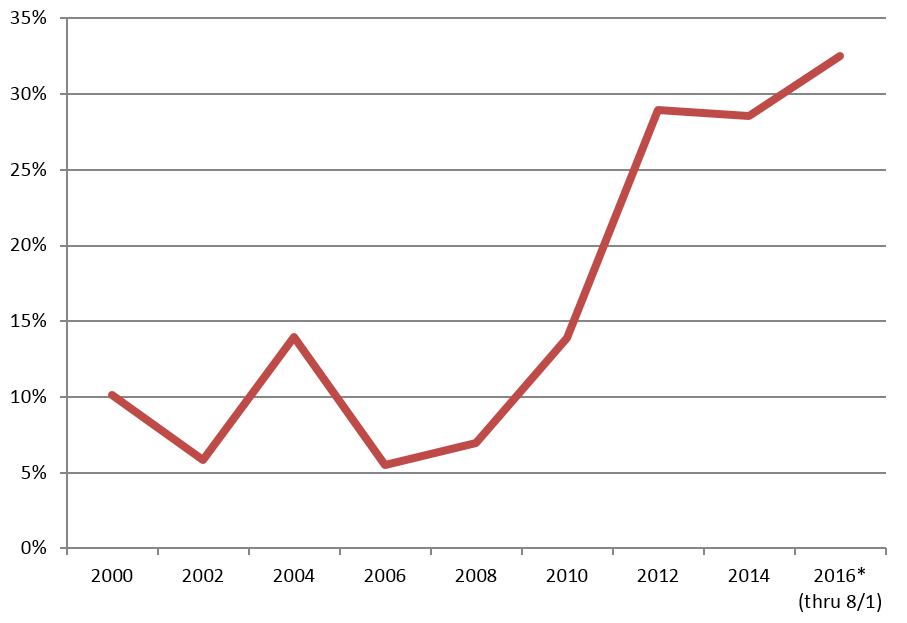
Figures include all available primary and general election broadcast television, national network and national cable television advertising airings for each cycle.
*2016 figures are through 8/1/16 only.
CITE SOURCE OF DATA AS: Kantar Media/CMAG with analysis by the Wesleyan Media Project.
Download chart data as a .csv
![]()
Importantly, candidates have sponsored the majority of ad airings in every year since 2000, but in the aggregate, their share of advertising—as well as the share of spending by formal party organizations[1]—has declined. Moreover, in some of the most competitive House and Senate races across the country, it is not uncommon for outside groups to sponsor the majority of ads that mention or picture the candidates on the ballot.
![]()
Outside Groups and Types of Disclosure
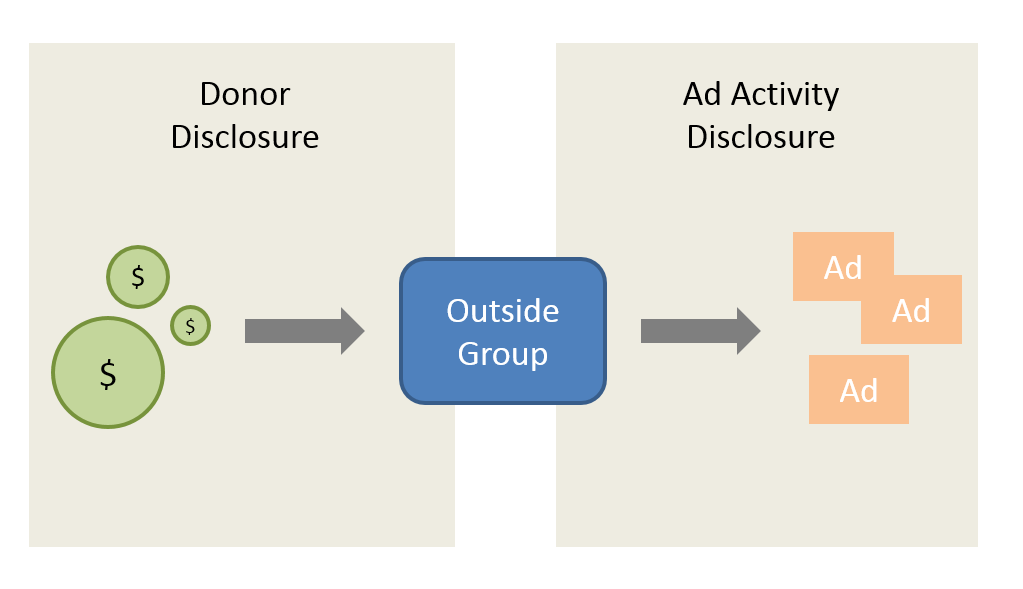
The trends noted above are important in their own right, but they miss important changes happening from election cycle to election cycle in the sponsorship of political ads. In particular, the types of groups active on the airwaves—and the regulations that govern how transparent they are (i.e., how much information they report) to the public—have fluctuated considerably. In this report we consider six major group types and discuss rules related to the public disclosure of (1) their donors, and (2) their political ad activity in primary and election periods (see Figure 2).
![]()
Figure 2: Two Types of Disclosure (Donor Contributions vs. Advertising Activity)
![]()
Classifying the Donor Disclosure of Outside Groups
For this analysis, we rely on the Center for Responsive Politics’ (CRP’s) categorization of each group that sponsored ads in federal elections into one of three types: (1) full-disclosure groups, such as most (but not all) super PACs; (2) non-disclosing (“dark money”) groups that do not disclose any donors, such as most 501c4 groups; and (3) partial-disclosure groups.
The last category consists, by and large, of super PACs that have received substantial contributions from non-disclosing groups. More specifically, we label any super PACs with non-transparent donors as “partial” disclosure groups if they receive some of their funding from non-transparent donors and as non-disclosing if they receive all of their funding from non-transparent donors.[2].
Table 1 below lists these six types of outside groups and how their donor disclosure is classified by CRP depending upon the specific information they report. For example, PACs can only be classified as full disclosure whereas super PACs might be full, partial or dark depending upon what they report. For more information on these groups, see the Center for Responsive Politics’ glossary.
![]()
Table 1: Groups and Types of Donor Disclosure
| Group | Description | Type of Donor Disclosure | Examples | ||
|---|---|---|---|---|---|
| Full | Partial | None/Dark | |||
| PAC | Can contribute directly to candidates (with limits). They are the only group in this table that can do so. Must report donors and expenditures (ad activity) to FEC. | X | EMILY’s List | ||
| Super PAC | Must report contributions (donors) and expenditures (ad activity) to the FEC— and are therefore technically transparent — but they can accept contributions of unlimited size from groups that are not fully transparent. | X | X | X | Priorities USA; American Crossroads |
| 527 | Political organizations that report all donations only to the IRS — not the Federal Election Commission — but they often behave like super PACs in how they accept and report donations from dark money sources. | X | X | X | Swift Boat Veterans for Truth |
| 501c4 | Groups whose principal goal, broadly construed, is promoting the “social welfare.” They do not have to publicly disclose their donors. | X* | X | X | Crossroads GPS; Americans for Prosperity |
| 501c6 | Business leagues like the Chamber of Commerce. Disclosure rules same as for c4s. | X* | X | X | U.S. Chamber of Commerce |
| 501c5 | Labor unions. Considered disclosing groups because their revenues are derived from hundreds of thousands, sometimes millions, of dues paying members and because they are required to file detailed financial reports to the Department of Labor. | X | Service Employees International Union | ||
| *Some (very few) 501cs voluntarily disclose all of their donors. Note: FEC is the Federal Election Commission, the federal agency that monitors and enforces federal campaign finance laws |
|||||
All groups airing ads in federal elections from 2000 to 2016 were placed into one of the donor disclosure categories described above depending upon group type and actual reporting; however, the disclosure for any particular group can change from cycle to cycle. For example, if a super PAC fully discloses its donors in one cycle, it would be classified as a full-disclosure group for that particular cycle. If, however, it reported non-disclosing entities as contributors in another election cycle, it would receive a partial-disclosure categorization for that cycle. Many groups also change classifications across time. A group might have organized and filed as a 527 in 2004, changed to a c4 in 2008, and re-classified and organized as a super PAC in 2012.
Identifying a group’s organizational type at a particular point in time is a difficult task, and thus these classifications by CRP are a “best guess” based upon when ads are aired and knowledge gleaned from disclosure reports (i.e., itemized lists of donors) to the Federal Election Commission.
![]()
Changes in Group Types (By Donor Disclosure) Over Time
Figure 3 shows the percentage of advertising sponsored by four main types of groups (we collapse c4s, c5s, and c6s into one category)—and how those percentages have changed over time. In 2000, for instance, 501cs were the dominant group type, accounting for about 63 percent of group-sponsored advertising. Recall, again, that about 10 percent of all ads aired in federal races that year were from outside groups. Traditional PACs sponsored about 29 percent of ad airings in 2000. 527 organizations accounted for just over 4 percent of airings.[3]
Over time, the percentage of ads sponsored by traditional PACs, which disclose their contributions and spending to the Federal Election Commission, has declined considerably, accounting for under 10 percent of group-sponsored ad airings from 2010 to today. In 2004, 527 organizations became extremely popular, accounting for almost 2 in 3 ad airings that year, but since 2010 advertising by 527 organizations has been negligible.
Super PACs first came into existence in the 2010 election cycle, accounting for 14 percent of airings. Since that time, they have sponsored an increasing percentage of ads, perhaps due to their ability to raise unlimited funds and engage in explicit electioneering. In the current election cycle, super PACs have accounted for over 72 percent of group-sponsored advertising.
Non-profit 501c organizations, most of which are not required to disclose publicly their donors, have waxed and waned in popularity over time, but they have sponsored over a third of all advertising in every year except for 2004 (when 527s were extremely popular) and in 2016 (when super PACs have dominated). It is worth noting, however, that a focus on percentage breakdowns across groups undervalues the volume of advertising from different types of groups. For example, while 501c groups accounted for a lower share of group-sponsored ads in 2014 in comparison to 2010, their ad volume in 2014 was nearly double what it was in 2010, and considerably higher than in earlier, pre-Citizens United, cycles.
![]()
Figure 3: Percentage of Group-Sponsored Ads by Group Type
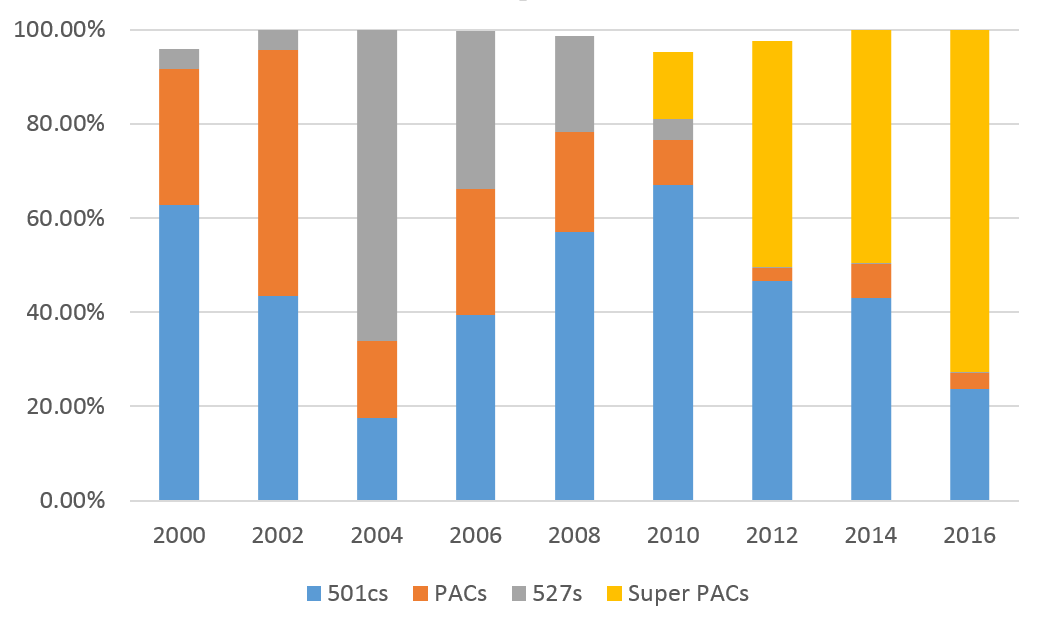
Figures include primary and general election broadcast television, national network and national cable television advertising airings.
*2016 figures are through 8/1/16 only.
CITE SOURCE OF DATA AS: Kantar Media/CMAG with analysis by the Wesleyan Media Project.
Disclosure categorization from the Center for Responsive Politics.
Download data as a .csv
![]()
To help illustrate this rise more clearly, Table 2 use CRP’s classification to show the increase in dark money advertising in federal races over time. Presidential dark money airings rose from 23,487 in 2008 to 172,591 in 2012. Senate dark money airings were at an all-time high in 2014 at a total of 171,075 airings, and even though U.S. House dark money airings declined a bit in 2014, the volume of activity is still well above pre-2008 levels.
![]()
Table 2: Dark Money (Non-Disclosure) Group Airings over Time
| Cycle | All Federal | Pres | Senate | House |
|---|---|---|---|---|
| 2000 | 34,178 | 13,176 | 9,660 | 11,342 |
| 2002 | 6,633 | - | 4,740 | 1,893 |
| 2004 | 15,460 | 8,994 | 3,281 | 3,185 |
| 2006 | 15,540 | - | 7,294 | 8,246 |
| 2008 | 158,310 | 23,487 | 108,968 | 31,926 |
| 2010 | 125,959 | - | 61,655 | 64,304 |
| 2012 | 383,345 | 172,591 | 149,826 | 60,928 |
| 2014 | 215,014 | - | 171,075 | 43,939 |
| CITE SOURCE OF DATA AS: Kantar Media/CMAG with analysis by the Wesleyan Media Project. Disclosure categorization from the Center for Responsive Politics. |
||||
Next we plot the volume of activity by donor disclosure (top panel) and the proportion of each donor disclosure type relative to all group advertising (bottom panel).
Figure 4 plots results for presidential primary airings since 2000. As shown clearly in the graph, outside group activity in presidential primaries has grown over time, and 2016 was no exception. The bulk of the activity came from 527s in 2004 and 2008 and from super PACs in 2012 and 2016.
![]()
Figure 4: Outside Group Ad Volume and Proportion in Presidential Primaries 2000 – 2016*
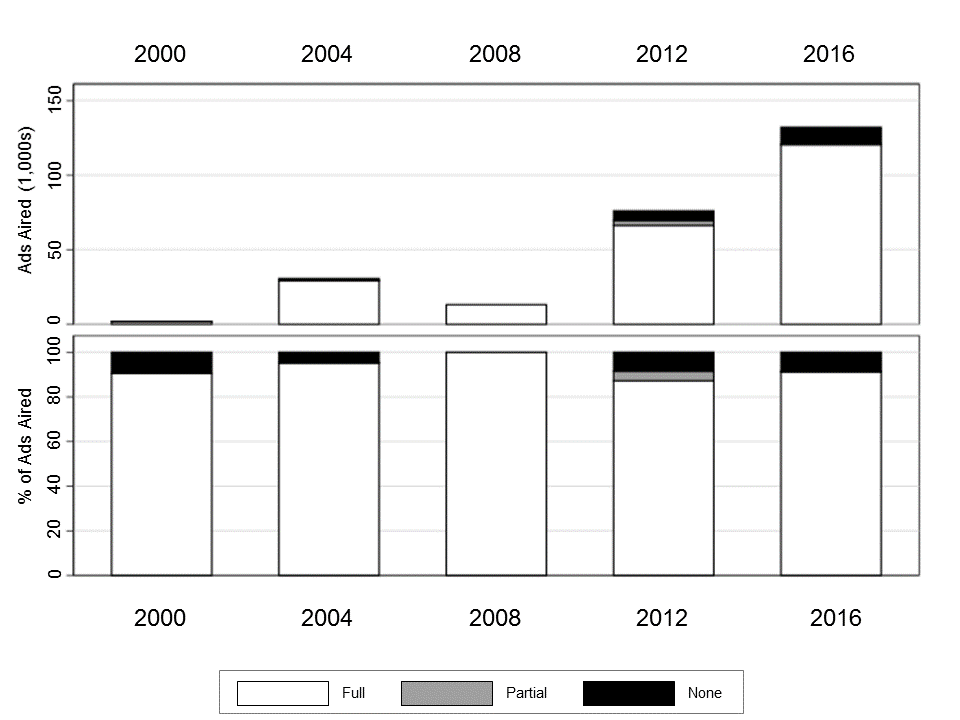
Figures include broadcast television, national network and national cable advertising airings.
*2016 data through 8/1/16 only.
CITE SOURCE OF DATA AS: Kantar Media/CMAG with analysis by the Wesleyan Media Project.
Disclosure categorizations from the Center for Responsive Politics.
![]()
Figure 5 plots results for presidential general election airings since 2000. The figure shows clearly how outside groups played a small role in the 2000 general election, weighing in with fewer than 22,000 airings total. The 2004 presidential election by contrast, which was the first after passage of the Bipartisan Campaign Reform Act (BCRA), saw more than a five-fold increase in outside group airings (to nearly 122,000 total). Further, full-disclosure groups comprised the vast majority of airings. Indeed, as noted above, 2004 was the election where 527 groups were most active, and those groups report donors to the IRS.
![]()
Figure 5: Outside Group Ad Volume and Proportion in Presidential General Elections 2000 – 2016*
Figures include general election broadcast television, national network and national cable advertising airings.
*2016 data through 8/1/16 only.
CITE SOURCE OF DATA AS: Kantar Media/CMAG with analysis by the Wesleyan Media Project.
Disclosure categorizations from the Center for Responsive Politics.
![]()
Group activity waned in 2008 with just over 35,000 group ads across all 210 media markets. There are a number of possible explanations for this. For one, then-Senator Obama opted out of the presidential public funding system, and supportive groups likely did perceive him as needing their help. The Republican nominee, John McCain, was hardly a fan of outside groups, being the architect of BCRA. Plus the election was tilted in Obama’s favor for almost the entire contest, lowering the perceived need for outside groups to make public appeals on the airwaves.
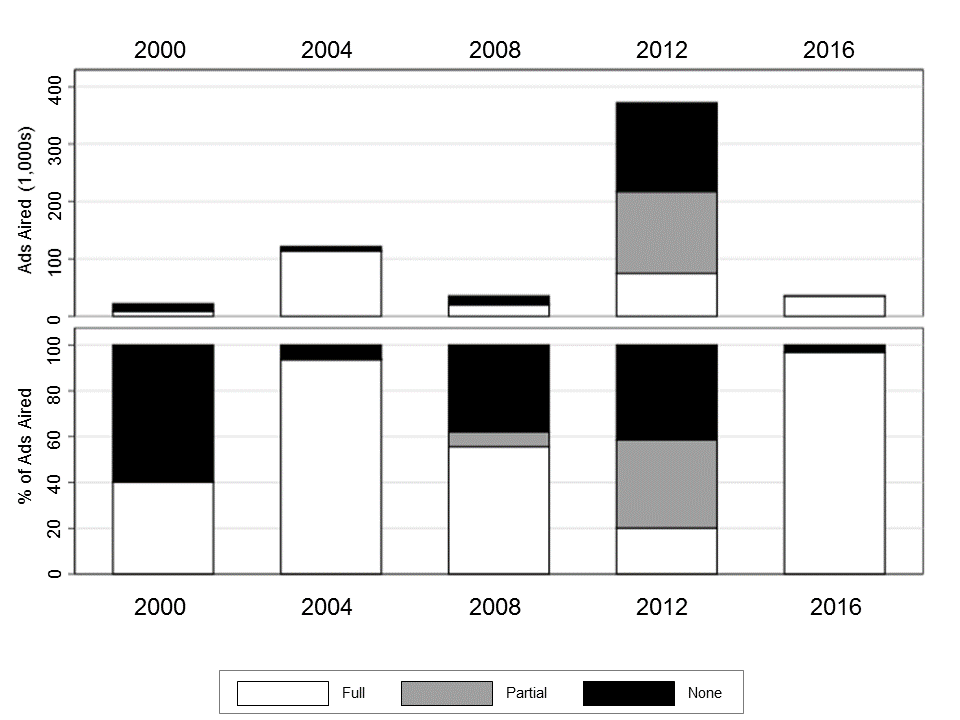
Despite this decline in airings in 2008, outside group efforts exploded to over 370,000 airings in 2012 in the first presidential cycle post-Citizens United. In addition, dark money comprised the plurality of ads on air with over 40 percent of all group airings coming from these groups.
The general election in 2016 so far has seen comparatively low rates of group advertising (and the vast majority of it from full-disclosure groups) due in part to the lack of advertising by groups backing Trump and the reticence among traditional large GOP advertisers to get involved in the presidential race. (Comparative U.S. Senate and U.S. House primary graphs can be found in Appendix A).
![]()
Trends in Ad Activity by Groups within an Election Cycle
The rules governing federal campaign finance disclosure not only vary by the sponsoring organization but by the timing and content of political ads. “Disclosure windows” refer to the timing of when groups must report specific election-related advertising activity to the Federal Election Commission (FEC).
![]()
Figure 6: Disclosure windows for “issue ads” aired by 501c groups
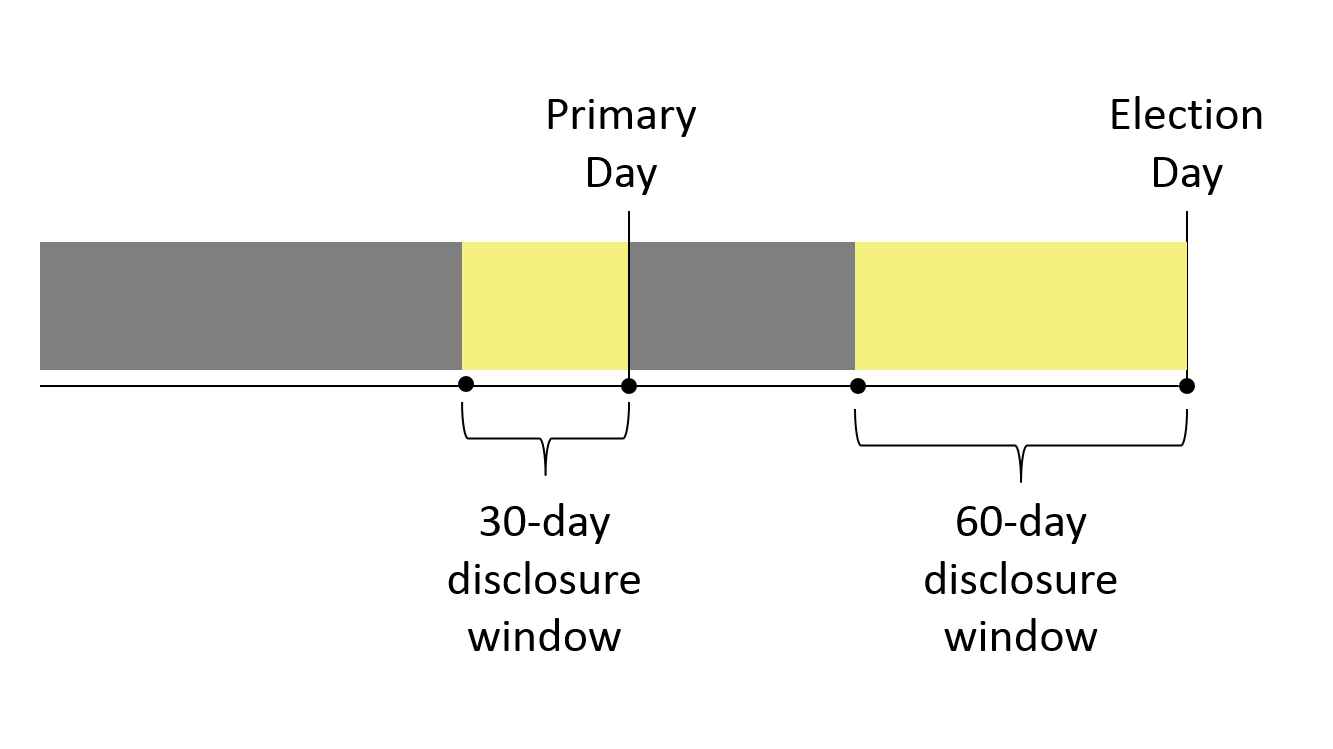
Note: Gray windows vary in size depending upon how early or late a primary occurs relative to Election Day.
![]()
Any ads that expressly call for the election or defeat of federal candidates—whenever they air—must be reported to the FEC. Not all ads that merely mention or picture a federal candidate must be reported, however. Ads that do not expressly advocate for or against candidates are often referred to as “issue ads.” According to FEC rules, issue advertising within 30 or fewer days to a primary election and 60 or fewer days to a general election must be reported. (These windows took effect starting in 2004, subsequent to the passage of the Bi-Partisan Campaign Reform Act.) However, 501(c) nonprofit advertisers (as opposed to FEC committees like PACs and super PACs, which must report all spending) do not need to report “issue advocacy” activity to the FEC if they air such advertising prior to the reporting windows (in the grey sections of Figure 6). Wesleyan Media Project data are critically important to tracking levels of dark money advertising outside of these key reporting windows: indeed, this activity may not be reported anywhere else.
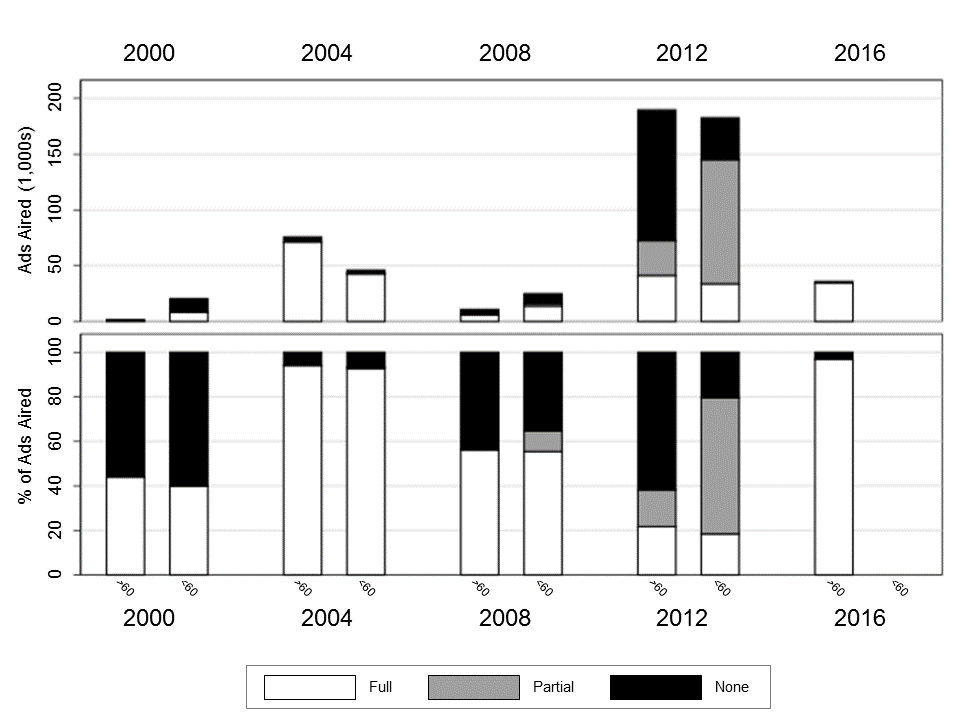
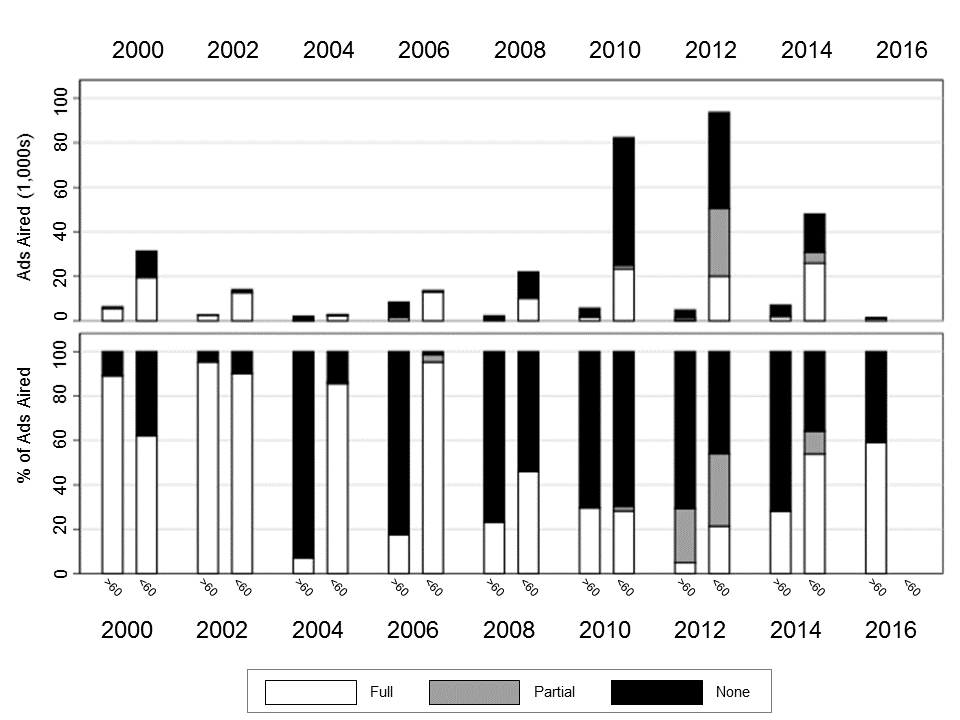
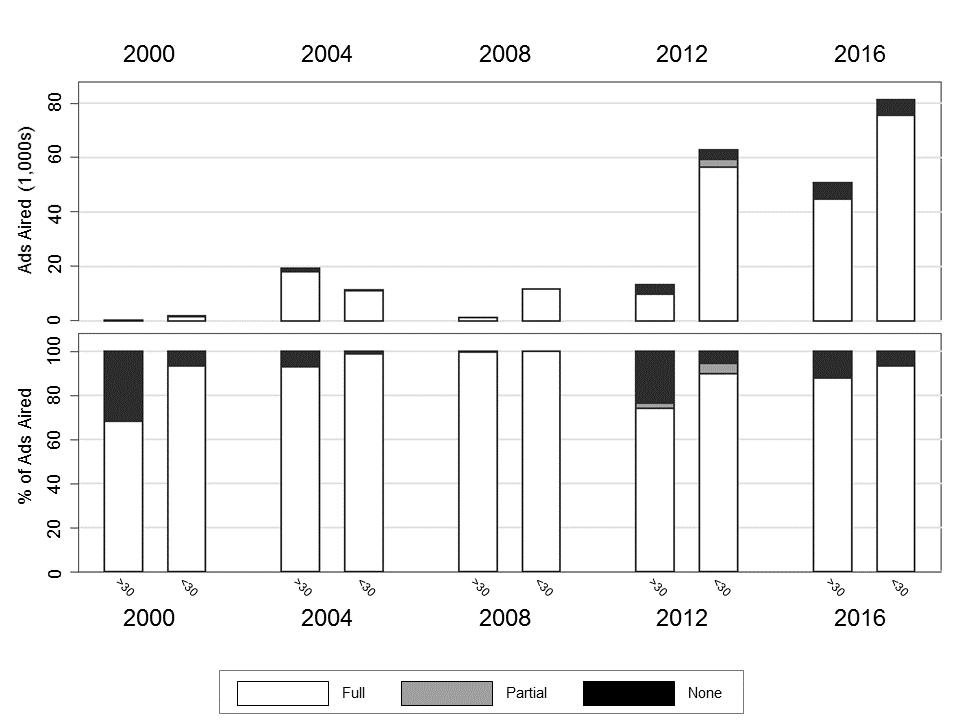
Given that, we counted the number of ads aired by outside groups in and outside of the primary and general election disclosure windows, looking at the share of that spending by the type of organization. We examined all ads that mentioned or pictured a candidate for federal office in each election cycle. The top panels of the figures in this section (Figures 7-9) show the total ad counts for different types of outside groups in the general election (top panel) along with the proportion of group airings from full, partial and non-disclosing entities (bottom panel). For each year, there are two bars in each panel. The first bar (labeled >60) displays the volume (top) and proportion (bottom) of group activity before the general election reporting window kicks in at 60 days prior to Election Day; the second bar (labeled <60) shows the volume and proportion of group activity during the 60-day reporting window immediately preceding Election Day.
Turning to Figure 7, which shows group activity in presidential airings, in 2000, we see the vast majority (93 percent) of airings occurred within 60 days of the general election, though non-disclosing groups were more prominent than full-disclosure groups both within and outside the 60-day window. The 2004 presidential election by contrast, which was the first after passage of the Bipartisan Campaign Reform Act (BCRA), saw more airings before the 60 day window than after it.
As discussed above, group activity waned in 2008 but exploded both before and after the reporting windows of the general election in 2012, the first post-Citizens United. In 2008 dark money comprised more than 40 percent of advertising before the reporting window and over a third of advertising within the window whereas, dark money organizations dominated in 2012 (clocking in with more than 60 percent of group airings) prior to the 60-day reporting window. Partial disclosure groups were responsible for the plurality of group airings inside the 60 day FEC reporting window.
![]()
Figure 7: Outside Group Ad Volume and Proportion in Presidential General Elections 2000 – 2016* by Disclosure Reporting Windows
Figures include general election broadcast television, national network and national cable advertising airings.
*2016 data through 8/1/16 only.
CITE SOURCE OF DATA AS: Kantar Media/CMAG with analysis by the Wesleyan Media Project.
Disclosure categorizations from the Center for Responsive Politics.
![]()
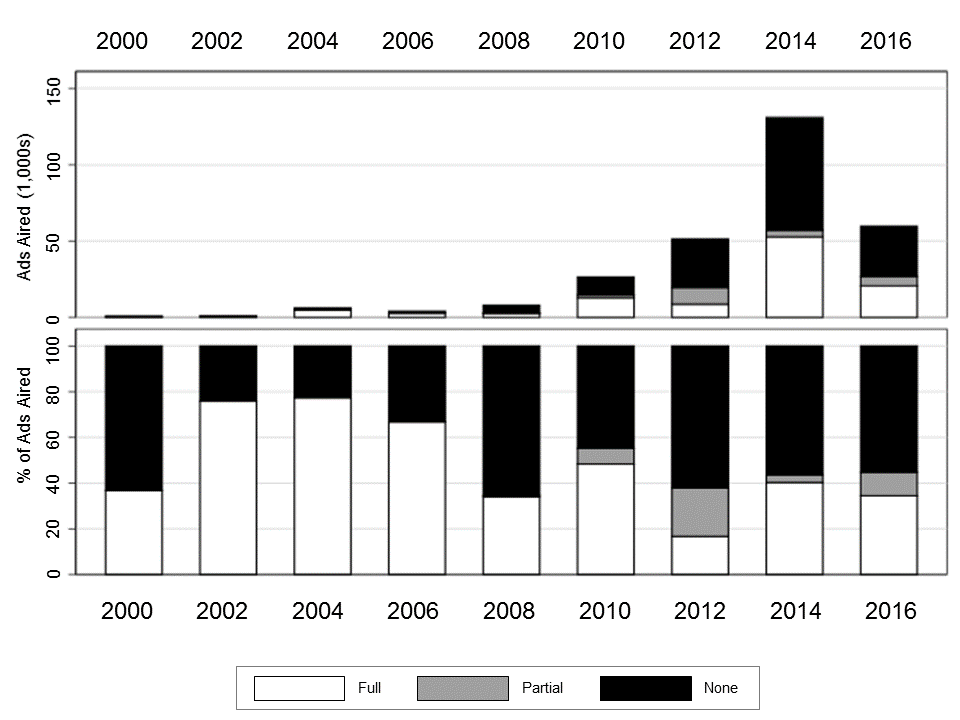
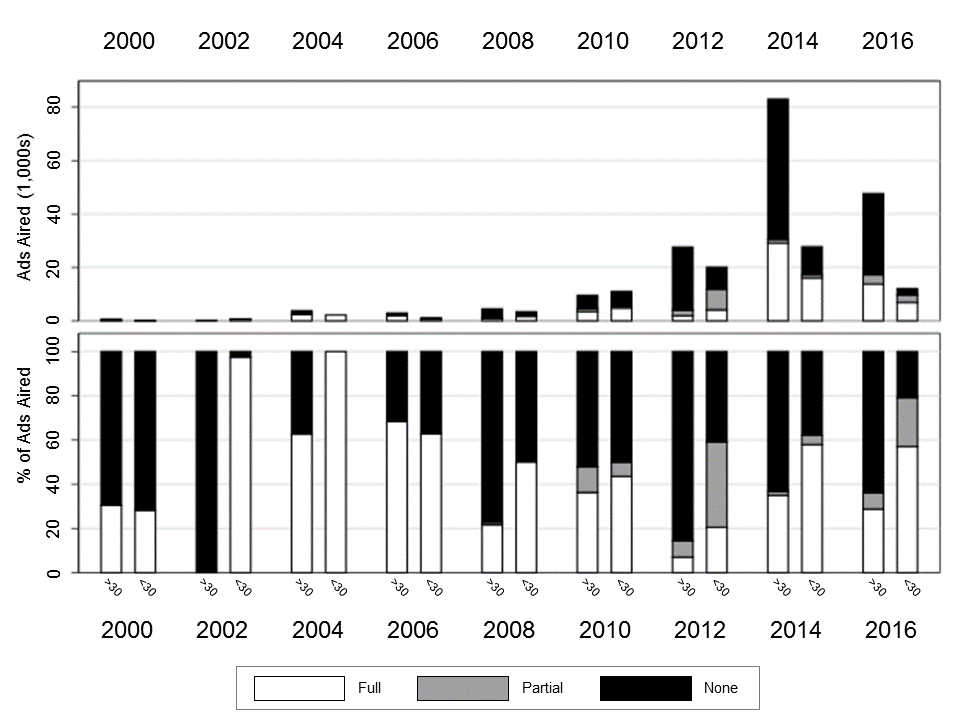
Turning to outside group airings in U.S. Senate races (Figure 8), we see a clearer trend toward more group involvement over time, with 2016 not much different from 2014 in terms of activity prior to the 60 day general election window (it is important to note that the 2016 bar is not yet complete as several states’ primary elections had not yet happened as of August 1 ). With the sole exception of 2002, dark money (non-disclosure) advertising has always comprised a larger share of group activity prior to the 60 day FEC reporting window than during it (the pattern is similar in primaries; see Appendix B).
![]()
Figure 8: Outside Group Ad Volume and Proportion in U.S. Senate General Elections 2000 – 2016* by Disclosure Reporting Windows
Figures include general election broadcast television advertising airings.
*2016 data through 8/1/16 only.
CITE SOURCE OF DATA AS: Kantar Media/CMAG with analysis by the Wesleyan Media Project. Disclosure categorizations from the Center for Responsive Politics.
![]()
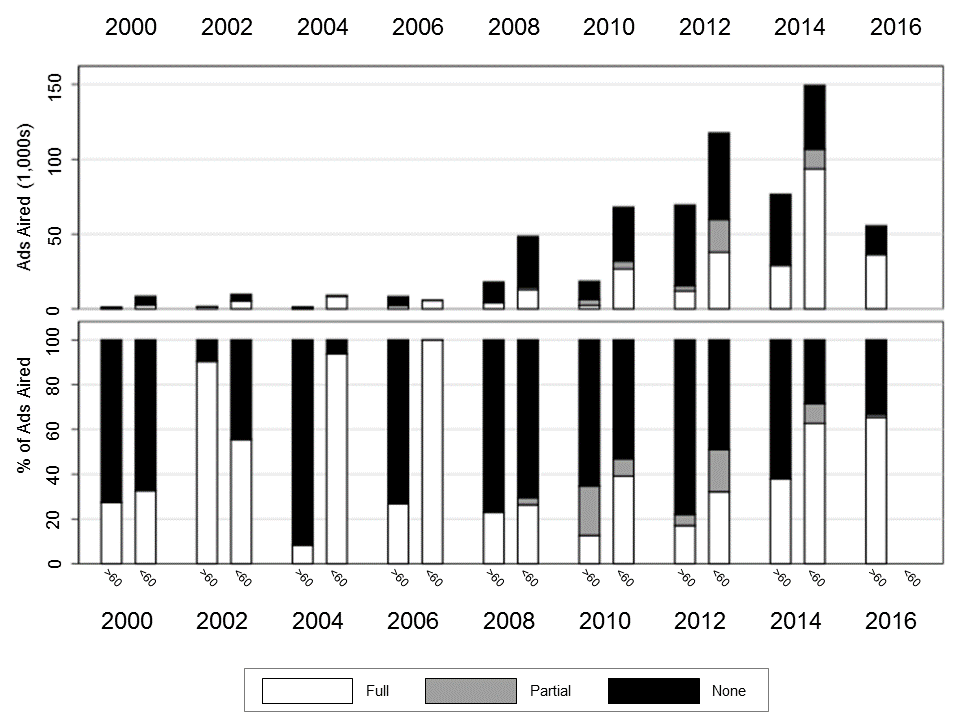
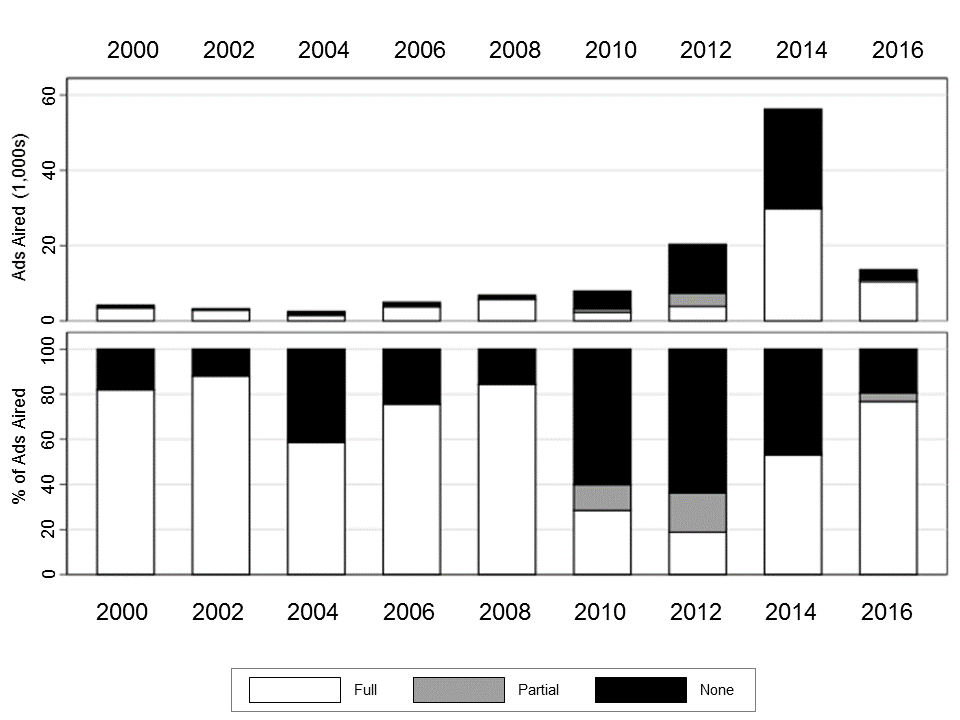
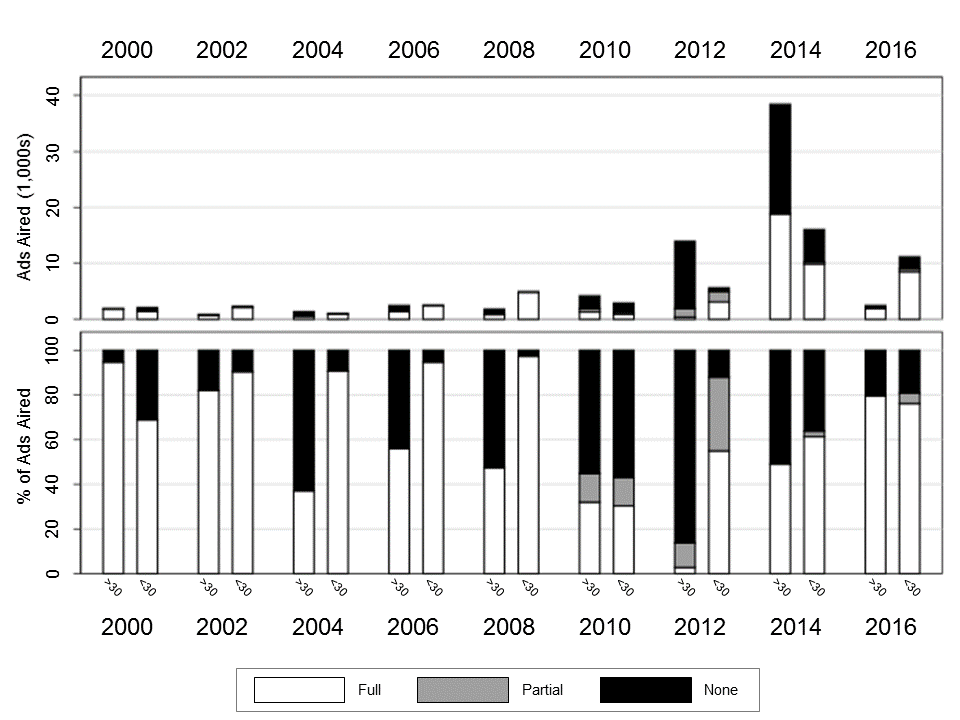
Group advertising in U.S. House races (Figure 9) was more prominent in terms of sheer volume in 2000 than it was again in any cycle until 2010 when control of the chamber was in doubt. Group airings rose again in 2012 but dropped off in 2014 when control of the chamber was safely in the hands of Republicans. Similar to trends in U.S. Senate groups, dark money advertisers comprised larger proportions of total group activity before the FEC reporting windows kicked in at 60 days prior to the general election (again, trends are similar for primaries; see Appendix B).
![]()
Figure 9: Outside Group Ad Volume and Proportion in U.S. House General Elections 2000 – 2016* by Disclosure Reporting Windows
Figures include general election broadcast television advertising airings.
*2016 data through 8/1/16 only.
CITE SOURCE OF DATA AS: Kantar Media/CMAG with analysis by the Wesleyan Media Project.
Disclosure categorizations from the Center for Responsive Politics.
![]()
Few Repeat Players
Most of the groups involved in political advertising are not repeat players. The vast majority of them “pop up” and then disappear (or transform into another group) before the next cycle. We looked at group names as expressed in the ads’ tagline and collapsed ads by a group across its possible donor disclosure types. For example, Club for Growth has organized as a PAC, super PAC, and c4. We count the group as a single entity.
The average length of participation by an outside group is just 1.4 cycles, and 79.7 percent of the groups we examined (501 out of 629) participated in only a single election cycle. Fewer than 10 percent of groups participated in more than two election cycles, and one only group (The League of Conservation Voters) participated in all 9 election cycles. The short existence of many of these groups makes it more difficult for voters to learn much about them and hold them accountable for the messages that they send.
That said, more ads come from the more established groups that have advertised in more election cycles, as Figure 10 shows. For instance, the five groups that were active in eight of the nine election cycles account for over 10 percent of total ad airings.
![]()
Figure 10: Number of Election Cycles in Which Groups Advertised
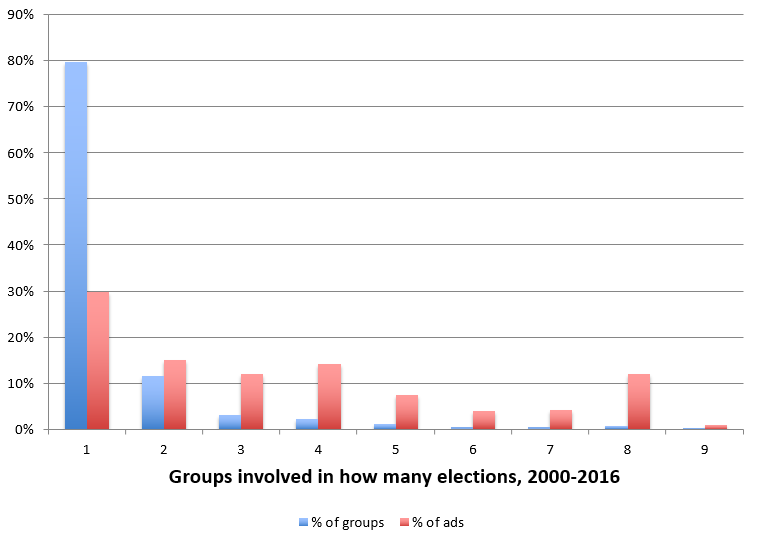
CITE SOURCE OF DATA AS: Kantar Media/CMAG with analysis by the Wesleyan Media Project and the Center for Responsive Politics.
![]()
We provide separate to this report three additional tables that break out spending totals by various outside groups. In Table 3, we collapse and report ad totals by the top 50 groups in ad airings between 2000 and 2016. In Table 4 we report the top 10 advertisers (by ads aired) in each of the nine election cycles for which we have data.
We also show the proportion of ad totals by these groups that occurred outside the 30 and 60-day reporting windows. For example, as noted in Table 3, the top advertising group in 2014 was Senate Majority PAC, which aired 51,015 ads in Senate races that year. Nearly six out of every ten of those advertisements (57 percent) aired outside of the FEC primary and general election reporting windows. Crossroads GPS, the second largest group advertiser in 2014, aired a total of 34,577 ads, 30,907 of which were for U.S. Senate and the remaining 3,670 were for U.S. House. Nearly half (46 percent) of the 34,577 ads aired outside of the FEC disclosure reporting windows.
Provided separate to this document are several files covering 2000-2016. We have pulled out 2016 groups in web-tables below for ease of access.
-
- Table 4a: Top 10 Groups in 2016
| Group | Type | Disc. Type | All Ads (fed races) | Pres Ads | Senate Ads | House Ads | % Outside Disclosure Window** | Races |
|---|---|---|---|---|---|---|---|---|
| Right To Rise USA | super PAC | Full | 35,067 | 35,067 | 0 | 0 | 68 | Pres |
| Conservative Solutions PAC | super PAC | Full | 29,797 | 29,797 | 0 | 0 | 17 | Pres |
| Priorities USA Action | super PAC | Full | 27,990 | 27,990 | 0 | 0 | 100 | Pres |
| Senate Majority PAC | super PAC | Full | 19,428 | 0 | 19,428 | 0 | 98 | Sen: FL, NH, NV, OH, PA |
| One Nation | 501c4 | None | 17,256 | 0 | 17,256 | 0 | 99 | Sen: IA, IN, MO, NH, NV, OH, PA |
| US Chamber of Commerce | 501c6 | None | 14,132 | 0 | 12,023 | 2,109 | 81 | Sen: AZ, FL, IL, IN, NH, NV, OH, PA, WI House: AL02, GA03, IL18, KS01, KY01 |
| Club for Growth | super PAC | Full | 13,572 | 8,279 | 1,304 | 3,989 | 25 | Pres Sen: LA |
| Stand for Truth | super PAC | Full | 10,176 | 10,176 | 0 | 0 | 4 | Pres |
| Freedom Partners | super PAC | Full | 9,405 | 0 | 9,405 | 0 | 97 | Sen: IN, NV, OH, PA, WI |
| Fighting For Ohio Fund | super PAC | Full | 7,540 | 0 | 7,540 | 0 | 100 | Sen: OH |
| Figures include general election broadcast television, national network and national cable advertising airings. Group categorizations by the Center for Responsive Politics *For complete listings of groups 2000-2016 see the link to download Table 4 above **National cable and national network airings are excluded from the % Outside Disclosure Window figures. CITE SOURCE OF DATA AS: Kantar Media/CMAG with analysis by the Wesleyan Media Project. |
||||||||
-
- Table 5a: Top 10 Groups by Ad Airings Outside Disclosure Reporting Windows in 2016
| Group | Group Type | Disc. Type | Airings in Disc. Window | Airings Outside Disc. Window | Total Airings | % Outside Disc. Window** | Races |
|---|---|---|---|---|---|---|---|
| Priorities USA Action | super PAC | Full | 0 | 27,990 | 27,990 | 100% | Pres |
| Right To Rise USA | super PAC | Full | 11,060 | 23,021 | 34,081 | 68% | Pres |
| Senate Majority PAC | super PAC | Full | 459 | 18,969 | 19,428 | 98% | Sen: FL, NH, NV, OH, PA |
| One Nation | 501c4 | None | 227 | 17,029 | 17,256 | 99% | Sen: IA, IN, MO, NH, NV, OH, PA |
| US Chamber of Commerce | 501c6 | None | 2,670 | 11,462 | 14,132 | 81% | Sen: AZ, FL, IL, IN, NH, NV, OH, PA, WI House: AL02, GA03, IL18, KS01, KY01 |
| Freedom Partners Action Fund | super PAC | Full | 307 | 9,098 | 9,405 | 97% | Sen: IN, NV, OH, PA, WI |
| Fighting For Ohio Fund | super PAC | Full | 8 | 7,532 | 7,540 | 100% | Sen: OH |
| Conservative Solutions PAC | super PAC | Full | 24,401 | 5,084 | 29,485 | 17% | Pres |
| Conservative Solutions Project | 501c4 | None | 0 | 4,446 | 4,446 | 100% | Pres |
| America Leads | super PAC | Full | 1,064 | 4,151 | 5,215 | 80% | Pres |
| Figures include general election broadcast television, national network and national cable advertising airings. Group categorizations by the Center for Responsive Politics *For complete listings of groups 2000-2016 see the link to download Table 5 above **National cable and national network airings are excluded from the Percent Outside Disclosure Window figures. CITE SOURCE OF DATA AS: Kantar Media/CMAG with analysis by the Wesleyan Media Project. |
|||||||
![]()
Concluding Thoughts
Outside groups are a huge presence in contemporary American elections. Many have worried subsequent to cases such as Citizens United v. FEC that “dark money” groups would dominate ad spending in federal elections. Others have worried that super PACs would “hide” donations by accepting contributions from largely non-disclosing sources. This report is intended to examine the share of this kind of spending across election cycles and in various moments of the campaign season where reporting requirements of ad activity are less robust. We let the reader draw the normative implications from the underlying analysis.
Certainly, the majority of group in presidential elections is full disclosure, with the obvious exception of 2012 (though see primary spending between 2000 and 2016, which is almost entirely from full disclosure groups). Full disclosure ads account for a larger share of group spending in more recent House and Senate elections, as well.
That said, even though the majority of spending by groups may be full disclosure, the total volume of spending that is undisclosed has been rising. Moreover, comparisons of groups with candidates and parties highlight gaps in transparency. If candidate and party spending were depicted on the figures in this report, there would be only white bars, as these political actors fully report donors and expenditures to the FEC.
One laudable goal of campaign finance reformers, then, might be to push for laws that demand more reporting of donors by groups that air ads that mention or picture federal candidates for office. All of the spending in the dark and grey shaded sections of Figure 6-8 are on ads where voters would be hard-pressed to learn any information about the underlying source of the groups’ war chests.
![]()
Appendix A: Primary Advertising by Donor Disclosure Type
Figure A1 shows ad volumes for senatorial primary advertising since 2000. While outside group volume was not as prominent in 2016 compared to 2014, it has (even though not quite complete) surpassed 2012 levels. Further, the proportion of dark money advertisers involved in 2016 is comparable to both 2012 and 2014 in which dark money advertising has comprised roughly 60 percent of all group ads on air.
![]()
Figure A1: Outside Group Ad Volume and Proportion in Senatorial Primaries 2000 – 2016*
Figures include broadcast television, national network and national cable advertising airings.
*2016 data through 8/1/16 only and not yet complete for the following states: Alaska, Arizona, Connecticut, Delaware, Florida, Hawaii, Kansas, Louisiana, Massachusetts, Michigan, Minnesota, Missouri, New Hampshire, Rhode Island, Tennessee, Vermont, Washington, Wisconsin, and Wyoming.
CITE SOURCE OF DATA AS: Kantar Media/CMAG with analysis by the Wesleyan Media Project. Disclosure categorization from the Center for Responsive Politics.
![]()
Figure A2 shows the results for U.S. House primary advertising since 2000. Similar to senatorial races, outside group activity was not as prominent in 2016 compared to 2014, but unlike the Senate, 2016 levels are down compared to 2012 races. Also unlike senatorial races, groups involved in the past two cycles have trended toward full donor disclosure.
![]()
Figure A2: Outside Group Ad Volume and Proportion in U.S. House Primaries 2000 – 2016*
Figures include broadcast television, national network and national cable advertising airings.
*2016 data through 8/1/16 only and not yet complete for the following states: Alaska, Arizona, Connecticut, Delaware, Florida, Hawaii, Kansas, Louisiana, Massachusetts, Michigan, Minnesota, Missouri, New Hampshire, Rhode Island, Tennessee, Vermont, Washington, Wisconsin, and Wyoming.
CITE SOURCE OF DATA AS: Kantar Media/CMAG with analysis by the Wesleyan Media Project. Disclosure categorization from the Center for Responsive Politics.
![]()
![]()
Appendix B: Trends in Ad Activity across Reporting Windows by Donor Disclosure
![]()
Figure B1 shows the volume of group activity in presidential primaries over time broken down by the 30 day disclosure window for each primary state. As shown in the figure, presidential advertising within the 30 day reporting window usually always outpaced advertising before it (with 2004 being the only exception). Invariably, however, dark money advertising was more prominent outside of the 30 day reporting window.
![]()
Figure B1: Outside Group Ad Volume and Proportion in Presidential Primaries 2000 – 2016, by Disclosure Reporting Windows
Figures include broadcast television, national network and national cable advertising airings.
CITE SOURCE OF DATA AS: Kantar Media/CMAG with analysis by the Wesleyan Media Project.
Disclosure categorization from the Center for Responsive Politics.
![]()
Figure B2 shows the trends in volume and proportion of group advertising in senate primaries. In contrast to the presidential airings, group activity during senatorial primaries was more prominent outside the 30 day reporting window. Similar to presidential races, however, dark money made up a larger share of group advertising outside the 30 day primary reporting window.
![]()
Figure B2: Outside Group Ad Volume and Proportion in Senate Primaries 2000 – 2016, by Disclosure Reporting Windows
Figures include broadcast television, national network and national cable advertising airings.
*2016 data through 8/1/16 only and not yet complete for the following states: Alaska, Arizona, Connecticut, Delaware, Florida, Hawaii, Kansas, Louisiana, Massachusetts, Michigan, Minnesota, Missouri, New Hampshire, Rhode Island, Tennessee, Vermont, Washington, Wisconsin, and Wyoming.
CITE SOURCE OF DATA AS: Kantar Media/CMAG with analysis by the Wesleyan Media Project.
Disclosure categorization from the Center for Responsive Politics.
![]()
Figure B3 shows the trends in volume and proportion of group advertising in U.S. House primaries. Trends in U.S. House races are less clear on the volume side; however, the trend of dark money advertising making up a larger proportion of advertising outside the disclosure window holds for U.S. House races.
![]()
Figure B3: Outside Group Ad Volume and Proportion in U.S. House Primaries 2000 – 2016, by Disclosure Reporting Windows
Figures include broadcast television, national network and national cable advertising airings.
*2016 data through 8/1/16 only and not yet complete for the following states: Alaska, Arizona, Connecticut, Delaware, Florida, Hawaii, Kansas, Louisiana, Massachusetts, Michigan, Minnesota, Missouri, New Hampshire, Rhode Island, Tennessee, Vermont, Washington, Wisconsin, and Wyoming.
CITE SOURCE OF DATA AS: Kantar Media/CMAG with analysis by the Wesleyan Media Project.
Disclosure categorization from the Center for Responsive Politics.
Download a PDF of this report here
About this Report
Data reported here do not cover local cable buys, only broadcast television, national network and national cable buys. We include all ads that mention individuals running for office, and therefore sums may include issue advocacy advertising. All cost estimates are precisely that: estimates. Disclosure categorization information on outside groups comes from the Center for Responsive Politics.
The Wesleyan Media Project provides real-time tracking and analysis of all political television advertising in an effort to increase transparency in elections. Housed in Wesleyan’s Quantitative Analysis Center – part of the Allbritton Center for the Study of Public Life – the Wesleyan Media Project is the successor to the Wisconsin Advertising Project, which disbanded in 2009. It is directed by Erika Franklin Fowler, associate professor of government at Wesleyan University, Michael M. Franz, associate professor of government at Bowdoin College and Travis N. Ridout, professor of political science at Washington State University. WMP staff include Laura Baum (Project Manager), Dolly Haddad (Project Coordinator) and Matthew Motta (Research Associate).
The Wesleyan Media Project is supported by grants from The John S. and James L. Knight Foundation and Wesleyan University. Data provided by Kantar Media/CMAG with analysis by the Wesleyan Media Project using Academiclip, a web-based coding tool. The Wesleyan Media Project is partnering this year with both the Center for Responsive Politics, to provide added information on outside group disclosure, and Ace Metrix, to assess ad effectiveness.
Periodic releases of data will be posted on the project’s website and dispersed via Twitter @wesmediaproject.
For more information contact:
media@wesleyan.edu
About Wesleyan University
Wesleyan University, in Middletown, Conn., is known for the excellence of its academic and co-curricular programs. With more than 2,900 undergraduates and 200 graduate students, Wesleyan is dedicated to providing a liberal arts education characterized by boldness, rigor and practical idealism. For more, visit www.wesleyan.edu.
About the John S. and James L. Knight Foundation
Knight Foundation supports transformational ideas that promote quality journalism, advance media innovation, engage communities and foster the arts. We believe that democracy thrives when people and communities are informed and engaged. For more, visit www.knightfoundation.org.
About the Center for Responsive Politics
The Center for Responsive Politics is the nation’s premier research group tracking money in U.S. politics and its effect on elections and public policy. Nonpartisan, independent and nonprofit, the organization aims to create a more educated voter, an involved citizenry and a more transparent and responsive government. CRP’s award-winning website, OpenSecrets.org, is the most comprehensive resource available anywhere for federal campaign contribution and lobbying data and analysis.
[1] Formal party organizations include the Democratic and Republican National Committees, their congressional campaign committees (e.g., the National Republican Congressional Committee), and state and local committees (e.g., the Maine Democratic Party). — back to report
[2] For example, Stephen Colbert in 2011 set up a super PAC called Americans for a Better Tomorrow, Tomorrow and then set-up a parallel 501c4. He asked viewers to donate to the nonprofit, and then contributed those sums back to the super PAC. — back to report
[3] Percentages in the table do not necessarily add to 100 percent because some groups took on multiple forms, and we were unable to identify which part of the group paid for the ads; we also don’t break out corporate spending, so-called Carey Committee spending (groups that have both a PAC and super PAC) and spending by coalitions whose partners take on different legal forms. These groups in total account for a very small share of political ad spending. — back to report


