Photo: Gage Skidmore/Flickr
TV Ad Volumes Similar to Past Years
(MIDDLETOWN, CT) May 14, 2020 – A new analysis from the Wesleyan Media Project, in partnership with the Center for Responsive Politics, shows that advertising in U.S. Senate races is heating up.
Maine has the most intense Senate race in the country so far, judging by the number of airings. Between January 1 and May 10, 2020, about 23,000 television ads had aired at a cost of $9.6 million (Table 1). In terms of total dollars spent on advertising, North Carolina tops the list, with just under $11 million in spending on broadcast TV ads. The vast majority of that money either attacked GOP incumbent Thom Tillis or supported one of the Democratic challengers (the bulk of it for Cal Cunningham) in advance of the March 3 party primary in the state. Notably, almost all of the spending in North Carolina preceded the primary, whereas spending in Maine has continued through the end date of this analysis, May 10. Democrats will hold their primary in Maine in July.
A trio of Southern states, Alabama, Georgia and Kentucky, has also seen considerable advertising so far. Alabama has a GOP primary run-off scheduled for July 14 featuring former Senator Jeff Sessions, and Georgia has two Senate elections. The Democrats will hold a primary on June 3 in Georgia to determine who will square off against incumbent David Purdue. The other election is a special election to fill Johnny Isakson’s seat (currently held through a gubernatorial appointment by Kelly Loeffler, who is also a candidate). It will be a blanket primary with all candidates facing each other on one ballot in the November election.
Table 1: TV Airings and Spending by Race in U.S. Senate
| State | Airings | Pro-Dem | Pro-Rep | Total $ | Dem cand ($) | Rep cand ($) | Dem group ($) | Rep group ($) |
|---|---|---|---|---|---|---|---|---|
| Maine | 22,988 | 14,798 | 8,190 | 9,642,920 | 1,746,430 | 2,183,780 | 3,834,540 | 1,878,170 |
| North Carolina | 18,167 | 17,383 | 784 | 10,954,280 | 1,122,510 | 0 | 9,006,850 | 327,870 |
| Alabama | 14,420 | 0 | 13,792 | 3,701,480 | 0 | 2,456,900 | 0 | 1,020,670 |
| Kentucky | 13,972 | 9,309 | 4,663 | 4,103,050 | 2,473,260 | 1,497,040 | 0 | 132,750 |
| Georgia | 12,587 | 1,508 | 11,079 | 5,543,890 | 416,870 | 2,282,870 | 0 | 2,844,150 |
| Michigan | 10,362 | 7,252 | 3,110 | 4,943,870 | 865,090 | 559,280 | 2,862,770 | 656,730 |
| Iowa | 9,139 | 8,134 | 1,005 | 4,512,180 | 77,910 | 0 | 3,654,410 | 779,860 |
| Montana | 7,013 | 1,083 | 5,930 | 802,740 | 0 | 431,060 | 371,680 | 0 |
| Arizona | 6,356 | 4,386 | 1,970 | 3,240,760 | 1,496,910 | 708,640 | 693,880 | 341,330 |
| South Carolina | 4,103 | 3,643 | 460 | 1,519,260 | 1,282,540 | 0 | 0 | 236,720 |
| Texas | 4,097 | 3,781 | 234 | 3,200,800 | 382,000 | 0 | 2,600,530 | 163,370 |
| Colorado | 1,734 | 1,169 | 565 | 1,013,190 | 0 | 0 | 722,360 | 290,830 |
| Kansas | 1,431 | 0 | 1,431 | 371,680 | 0 | 301,880 | 0 | 69,800 |
| Louisiana | 1,016 | 0 | 1,016 | 484,400 | 0 | 0 | 0 | 484,400 |
| Oklahoma | 631 | 0 | 631 | 171,520 | 0 | 171,520 | 0 | 0 |
| Massachusetts | 185 | 185 | 0 | 75,810 | 75,810 | 0 | 0 | 0 |
| New Mexico | 117 | 0 | 117 | 26,310 | 0 | 26,310 | 0 | 0 |
| Nebraska | 66 | 63 | 3 | 5,160 | 4,810 | 350 | 0 | 0 |
| Arkansas | 39 | 0 | 39 | 2,520 | 0 | 2,520 | 0 | 0 |
| Tennessee | 35 | 0 | 35 | 98,260 | 0 | 98,260 | 0 | 0 |
| New Hampshire | 3 | 0 | 3 | 2,930 | 0 | 2,930 | 0 | 0 |
| Illinois | 2 | 0 | 2 | 4,530 | 0 | 4,530 | 0 | 0 |
| Numbers include ads aired on broadcast television between January 1, 2020, and May 10, 2020. Spending by formal party organizations is reflected in the airing and spending totals (as are any ads from third party candidates) but is not separated out in columns in this table. CITE SOURCE OF DATA AS: Kantar/CMAG with analysis by the Wesleyan Media Project. |
||||||||
The largest group spender in these Senate races (for ads airing in 2020) is Senate Majority PAC, a Democratic super PAC that has spent $6.2 million on advertising in the Senate races in Colorado, Iowa, Maine, Michigan and Montana (Table 2). Another Democratic group, VoteVets, has spent $5.4 million in North Carolina and Texas.
Classifications by the Center for Responsive Politics (CRP) reveal that several of the top spending groups do not disclose all of their donors. The CRP classifies groups as full-disclosure groups (meaning they disclose contributor lists to the Federal Election Commission), non-disclosing dark money groups (which are not required to disclose publicly their donors; these are most often 501c4 non-profits), and partial-disclosure groups (those that disclose donors but also accept contributions from dark money sources).
Senate Majority PAC and VoteVets partially disclose (meaning they accept some contributions from non-disclosing sources), while One Nation, a Republican 501c that has spent $3 million, and Majority Forward, a 501c that has spent $2.9 million, do not disclose any of their donors. All told, 48 percent of spending by group-sponsored ads in Senate races since the start of the year was from partially disclosing groups. Thirty-nine percent was from non-disclosing groups, and only 13 percent was from fully disclosing super PACs, traditional PACs, or Carey committees (which are hybrids of traditional and super PACs).
Table 2: TV Airings and Spending by Group in U.S. Senate Races
| Sponsor | Lean | Type | Disclosing | Est. Spend ($) | Airings | Campaigns |
|---|---|---|---|---|---|---|
| Senate Majority PAC | Democrat | superPAC | p | 6,195,350 | 11,389 | CO, IA, ME, MI, MT |
| VoteVets | Democrat | Carey | p | 5,447,210 | 6,824 | NC, TX |
| One Nation | Republican | 501c4 | n | 3,096,630 | 2,872 | AZ, GA, IA, ME |
| Majority Forward | Democrat | 501c4 | n | 2,918,440 | 5,624 | AZ, ME, MI |
| Carolina Blue | Democrat | superPAC | p | 2,275,460 | 3,320 | NC |
| Vote Vets Action Fund | Democrat | 501c4 | n | 1,838,150 | 3,055 | MI, NC |
| Faith and Power Pac | Democrat | superPAC | p | 1,825,100 | 2,389 | NC |
| Club for Growth | Republican | PAC | y | 1,152,170 | 1,234 | GA |
| Doctor Patient Unity | Republican | 501c4 | n | 881,620 | 1,413 | AZ, GA, LA, TX |
| Maine Momentum | Democrat | 501c4 | n | 800,260 | 3,184 | ME |
| 1820 Pac | Republican | superPAC | y | 723,280 | 1,022 | ME |
| Iowa Forward | Democrat | 501c4 | n | 660,010 | 1,191 | IA |
| Taxpayers Protection Alliance | Republican | 501c4 | n | 609,740 | 1,427 | IA, KY, NC |
| Better Future Michigan | Republican | 501c4 | n | 545,330 | 1,797 | MI |
| Fighting for Alabama Fund Inc | Republican | superPAC | y | 511,830 | 1,261 | AL |
| Senate Leadership Fund | Republican | superPAC | y | 488,460 | 1,557 | GA |
| America First Policies, Inc. | Republican | 501c4 | n | 464,790 | 1,262 | AL, MI |
| Club for Growth Action | Republican | superPAC | y | 425,270 | 1,168 | AL, KS |
| NRDC Action Votes | Democrat | PAC | y | 410,700 | 336 | MI |
| Unite for Colorado | Republican | 501c4 | n | 290,830 | 565 | CO |
| Conservation Colorado & Rocky Mountain Values | Democrat | 501c4 | n | 261,140 | 359 | CO |
| Security Is Strength Pac | Republican | superPAC | y | 236,720 | 460 | SC |
| Lone Star Forward Org | Democrat | superPAC | y | 230,720 | 599 | TX |
| Advancing AZ | Democrat | 501c4 | n | 179,030 | 355 | AZ |
| EDF Action Votes | Democrat | superPAC | p | 158,670 | 356 | MI |
| LCV Victory Fund | Democrat | superPAC | p | 156,460 | 347 | MI |
| Protect Our Care | Democrat | 501c4 | n | 150,260 | 597 | MT |
| Tax March | Democrat | 501c4 | n | 107,460 | 85 | ME |
| The Alabama-Coushatta Tribe of Texas | Other | 501c10 | y | 54,900 | 82 | TX |
| The Lincoln Project | Democrat | superPAC | y | 50,470 | 119 | AZ |
| Alaska Wilderness League Action | Democrat | PAC | y | 33,280 | 52 | CO |
| Moveon.Org Political Action | Democrat | Carey | y | 28,140 | 15 | CO, ME |
| Keep Kansas Great Pac | Republican | superPAC | y | 23,890 | 83 | KS |
| Moveon.Org | Democrat | Carey | y | 20,710 | 29 | AZ, ME |
| Numbers include ads aired on broadcast television between January 1, 2020, and May 10, 2020. In the disclosing column, “y” indicates full disclosure, “p” indicates partial disclosure and “n” indicates no disclosure. CITE SOURCE OF DATA AS: Kantar/CMAG with analysis by the Wesleyan Media Project. Group classification provided by the Center for Responsive Politics. |
||||||
Table 3 shows that Democratic Senate candidates have an advantage when it comes to ad spending, with $34 million being spent in support of their campaigns compared to $20 million in support of Republican Senate candidates. A lot of this spending was committed to primary campaigns, though, and so the totals do not allow for an inference on likely spending by each side in the general election. Still, to this point 61 percent of ad spending (and 44 percent of airings) has come from groups, most on the Democratic side and most attacking Republicans or supporting the likely Democratic nominee.
Table 3: Airings and Spending in U.S. Senate Races, 2020
| Candidate (airings) | Candidate ($) | Party (airings) | Party ($) | Group (airings) | Group ($) | Total Airings | Total $ | |
|---|---|---|---|---|---|---|---|---|
| Democratic | 31,633 | 9,944,140 | 836 | 497,050 | 40,225 | 23,747,020 | 72,694 | 34,188,210 |
| Republican | 39,566 | 10,727,870 | 0 | 0 | 15,493 | 9,226,650 | 55,059 | 19,954,520 |
| Other | 0 | 0 | 0 | 0 | 710 | 278,810 | 710 | 278,810 |
| Total | 71,199 | 20,672,010 | 836 | 497,050 | 56,428 | 33,252,480 | 128,463 | 54,421,540 |
| Numbers include ads aired on broadcast television between January 1, 2020, and May 10, 2020. CITE SOURCE OF DATA AS: Kantar/CMAG with analysis by the Wesleyan Media Project. |
||||||||
Table 4 looks at ad spending during the same time frame in the campaigns of 2014, 2016, and 2018. Races in 2014 most directly compare to this year’s races as the Senate’s six-year terms mean that the same states are holding elections. In 2020, pro-Democratic groups account for 55 percent of all pro-Democratic airings, up slightly from 2014, while the volume of pro-Democratic group ads is up 64 percent from 2014. In fact, pro-Democratic groups have aired more ads this cycle than in any of the other cycles noted in the table. By contrast, pro-GOP groups account for 28 percent of pro-Republican efforts this year, a lower rate than in the 2014, 2016, and 2018 campaigns.
Table 4: Airings and Spending by Sponsor in U.S. Senate Races, 2014-2020
| Candidates | Party/Coord | Groups | Total | ||
|---|---|---|---|---|---|
| 2014 Pro-Democratic | Ads aired | 23,480 | 0 | 24,577 | 48,057 |
| Row % | 48.9 | 0.0 | 51.1 | ||
| Est. Cost ($) | 7,475,747 | 0 | 14,188,039 | 21,663,786 | |
| 2014 Pro-Republican | Ads aired | 36,962 | 0 | 42,133 | 79,095 |
| Row % | 46.7 | 0.0 | 53.3 | ||
| Est. Cost ($) | 22,901,989 | 0 | 24,868,730 | 47,770,719 | |
| 2016 Pro-Democratic | Ads aired | 25,459 | 2,083 | 14,119 | 41,661 |
| Row % | 61.1 | 5.0 | 33.9 | ||
| Est. Cost ($) | 21,180,330 | 1,137,670 | 20,181,190 | 42,499,190 | |
| 2016 Pro-Republican | Ads aired | 23,821 | 0 | 14,935 | 38,756 |
| Row % | 61.5 | 0.0 | 38.5 | ||
| Est. Cost ($) | 15,159,900 | 0 | 19,599,130 | 34,759,030 | |
| 2018 Pro-Democratic | Ads aired | 26,913 | 0 | 13,886 | 40,799 |
| Row % | 66.0 | 0.0 | 34.0 | ||
| Est. Cost ($) | 7,035,970 | 0 | 5,956,250 | 12,992,220 | |
| 2018 Pro-Republican | Ads aired | 51,451 | 0 | 25,678 | 77,129 |
| Row % | 66.7 | 0.0 | 33.3 | ||
| Est. Cost ($) | 13,077,970 | 0 | 10,446,880 | 23,524,850 | |
| 2020 Pro-Democratic | Ads aired | 31,633 | 836 | 40,225 | 72,694 |
| Row % | 43.5 | 1.2 | 55.3 | ||
| Est. Cost ($) | 9,944,140 | 497,050 | 23,747,020 | 34,188,210 | |
| 2020 Pro-Republican | Ads aired | 39,566 | 0 | 15,493 | 55,059 |
| Row % | 71.9 | 0.0 | 28.1 | ||
| Est. Cost ($) | 10,727,870 | 0 | 9,226,650 | 19,954,520 | |
| Numbers include ads aired on broadcast television between January 1 and May 10 in each year. CITE SOURCE OF DATA AS: Kantar/CMAG with analysis by the Wesleyan Media Project. |
|||||
South Carolina, Kentucky Top Digital Spending in Senate
Spending has also heated up on digital advertising in Senate contests. Table 5 shows the top Senate campaign or single candidate super PAC spenders in 2020; all top 15 spenders were candidates. At the top of the list is Democrat Jaime Harrison who has spent over $1.6 million on Facebook and Google advertising. Close behind is Democrat Amy McGrath, who is challenging Mitch McConnell in Kentucky—number three on the list. Incumbent Lindsey Graham of South Carolina has also spent more than $1 million on digital ads on the two platforms.
Table 5: Facebook and Google Spend by Senate Candidate (Top Spenders)
| State | Party | Sponsor | Facebook Spend ($) | Google Spend ($) | Total Spend ($) |
|---|---|---|---|---|---|
| SC | DEM | Harrison, Jaime | 1,319,007 | 343,000 | 1,662,007 |
| KY | DEM | McGrath, Amy | 851,812 | 754,400 | 1,606,212 |
| KY | REP | McConnell, Mitch | 1,142,516 | 322,900 | 1,465,416 |
| SC | REP | Graham, Lindsey O. | 891,978 | 131,000 | 1,022,978 |
| AZ | DEM | Kelly, Mark | 735,538 | 190,100 | 925,638 |
| ME | DEM | Gideon, Sara | 687,312 | 160,900 | 848,212 |
| CO | DEM | Hickenlooper, John W. | 358,347 | 105,100 | 463,447 |
| GA | DEM | Warnock, Raphael | 354,380 | 42,000 | 396,380 |
| NC | DEM | Cunningham, Cal | 307,616 | 0 | 307,616 |
| AZ | REP | McSally, Martha | 147,733 | 148,400 | 296,133 |
| MI | DEM | Peters, Gary | 255,305 | 38,700 | 294,005 |
| GA | REP | Loeffler, Kelly | 204,724 | 55,900 | 260,624 |
| MT | REP | Daines, Steve | 190,190 | 0 | 190,190 |
| ME | REP | Collins, Susan M. | 112,660 | 71,300 | 183,960 |
| KS | DEM | Bollier, Barbara | 117,816 | 60,700 | 178,516 |
| Numbers include spending between January 2 and May 9 for Facebook and January 5 and May 9 for Google. See “About the Data” section at the end of this report for more information on our methodology. |
|||||
Table 6 shows spending by candidates and single-candidate super PACs in all Senate races. The top single candidate super PAC on the list is Carolina Blue, which is supporting Cal Cunningham in North Carolina. That group has spent just under $90,000 on Facebook and Google ads since the start of the year.
Table 6: Facebook and Google Spend by Senate Candidate (All)
| State | Party | Sponsor | SupportsOpposes | Facebook Spend ($) | Google Spend ($) | Total Spend ($) |
|---|---|---|---|---|---|---|
| AK | IND | Gross, Al Dr. | 12,354 | 2,500 | 14,854 | |
| AK | REP | Sullivan, Dan | 15,976 | 7,300 | 23,276 | |
| AL | REP | Moore, Roy Stewart | 5,066 | 0 | 5,066 | |
| AL | REP | Fighting For Alabama Fund | pro-Byrne | 7,406 | 6,800 | 14,206 |
| AL | UN | Parrish, Michael | 600 | 0 | 600 | |
| AL | REP | Sessions, Jefferson B | 38,498 | 0 | 38,498 | |
| AL | REP | Byrne, Bradley Roberts | 18,379 | 2,400 | 20,779 | |
| AL | DEM | Jones, Doug | 79,487 | 20,200 | 99,687 | |
| AL | REP | Tuberville, Thomas H | 76,204 | 6,000 | 82,204 | |
| AR | IND | Whitfield, Daniel Allen | 1,729 | 0 | 1,729 | |
| AR | REP | Cotton, Thomas | 17,912 | 11,000 | 28,912 | |
| AZ | REP | Brittain, Craig R | 100 | 0 | 100 | |
| AZ | REP | Mccarthy, Daniel | 26,582 | 0 | 26,582 | |
| AZ | DEM | Kelly, Mark | 735,538 | 190,100 | 925,638 | |
| AZ | REP | Mcsally, Martha | 147,733 | 148,400 | 296,133 | |
| CO | DEM | Spaulding, Stephany Rose | 793 | 0 | 793 | |
| CO | DEM | Underwood, Erik M. | 200 | 0 | 200 | |
| CO | REP | Gardner, Cory | 62,994 | 25,200 | 88,194 | |
| CO | DEM | Hickenlooper, John W. | 358,347 | 105,100 | 463,447 | |
| CO | DEM | Romanoff, Andrew | 7,562 | 300 | 7,862 | |
| DE | DEM | Scarane, Jessica | 553 | 0 | 553 | |
| DE | REP | Witzke, Lauren Elena | 199 | 0 | 199 | |
| DE | DEM | Coons, Christopher A. | 38,698 | 5,900 | 44,598 | |
| GA | DEM | Johnson-Shealey, Tamara | 613 | 0 | 613 | |
| GA | DEM | Tarver, Edward J. | 7,762 | 0 | 7,762 | |
| GA | REP | Perdue, David | 21,827 | 0 | 21,827 | |
| GA | REP | Taylor, Kandiss Sharpe Dr | 100 | 0 | 100 | |
| GA | DEM | Winfield, Richard Dien | 146 | 0 | 146 | |
| GA | REP | Grayson, Derrick E Rev | 249 | 0 | 249 | |
| GA | DEM | Terry, Edward | 100 | 0 | 100 | |
| GA | REP | Johnson, Arthur Wayne | 249 | 0 | 249 | |
| GA | DEM | Lieberman, Matthew | 54,357 | 0 | 54,357 | |
| GA | REP | Loeffler, Kelly | 204,724 | 55,900 | 260,624 | |
| GA | DEM | Ossoff, T. Jonathan | 132,331 | 14,800 | 147,131 | |
| GA | DEM | Riggs Amico, Sarah | 2,200 | 400 | 2,600 | |
| GA | DEM | Tomlinson, Teresa Pike | 7,419 | 3,600 | 11,019 | |
| GA | DEM | Warnock, Raphael | 354,380 | 42,000 | 396,380 | |
| IA | IND | Herzog, Suzanne | 100 | 0 | 100 | |
| IA | REP | Ernst, Joni K | 85,826 | 27,300 | 113,126 | |
| IA | DEM | Greenfield, Theresa | 76,532 | 29,200 | 105,732 | |
| IA | DEM | Mauro, Eddie J | 41,151 | 3,500 | 44,651 | |
| ID | DEM | Jordan, Paulette | 3,355 | 0 | 3,355 | |
| IL | LIB | Malouf, Danny | 166 | 0 | 166 | |
| IL | REP | Tarter, Thomas | 28,961 | 0 | 28,961 | |
| IL | REP | Curran, Mark | 5,249 | 0 | 5,249 | |
| IL | DEM | Durbin, Richard J. | 20,658 | 0 | 20,658 | |
| IL | REP | Hubbard, Peggy | 350 | 0 | 350 | |
| IL | DEM | Durbin, Richard J | 0 | 4,900 | 4,900 | |
| KS | REP | Lindstrom, David Alan | 9,034 | 0 | 9,034 | |
| KS | REP | Wagle, Susan | 768 | 0 | 768 | |
| KS | REP | Laturner, Jake | 5,170 | 0 | 5,170 | |
| KS | REP | Marshall, Roger W | 79,204 | 0 | 79,204 | |
| KS | DEM | Reddi, Usha | 1,767 | 0 | 1,767 | |
| KS | DEM | Bollier, Barbara | 117,816 | 60,700 | 178,516 | |
| KS | REP | Kobach, Kris | 3,745 | 300 | 4,045 | |
| KY | DEM | Rothmuller, Eric | 769 | 0 | 769 | |
| KY | DEM | Save America Fund | pro-McGrath | 79,091 | 0 | 79,091 |
| KY | DEM | Broihier, Michael George | 1,207 | 0 | 1,207 | |
| KY | REP | Morgan, Clinton Wesley | 1,267 | 0 | 1,267 | |
| KY | REP | Mcconnell, Mitch | 1,142,516 | 322,900 | 1,465,416 | |
| KY | DEM | Mcgrath, Amy | 851,812 | 754,400 | 1,606,212 | |
| LA | DEM | Pierce, Antoine | 241 | 0 | 241 | |
| LA | REP | Cassidy, William M. | 5,371 | 1,400 | 6,771 | |
| MA | REP | O'Connor, Kevin J | 1,117 | 0 | 1,117 | |
| MA | DEM | Pemberton, Steve | 292 | 0 | 292 | |
| MA | DEM | Kennedy, Joseph P Iii | 96,168 | 6,200 | 102,368 | |
| MA | DEM | Liss-Riordan, Shannon Ms. | 500 | 1,900 | 2,400 | |
| MA | DEM | Markey, Edward J. Sen. | 14,785 | 13,100 | 27,885 | |
| ME | DEM | Sweet, Betsy | 8,603 | 0 | 8,603 | |
| ME | UNK | Savage, Lisa Jill | 583 | 0 | 583 | |
| ME | REP | 1820 Pac | pro-Collins | 7,750 | 25,100 | 32,850 |
| ME | DEM | Lajeunesse, Ross | 8,323 | 0 | 8,323 | |
| ME | REP | Collins, Susan M. | 112,660 | 71,300 | 183,960 | |
| ME | DEM | Gideon, Sara | 687,312 | 160,900 | 848,212 | |
| MI | REP | Better Future Michigan Fund | pro-James | 35,386 | 0 | 35,386 |
| MI | REP | James, John | 43,280 | 19,900 | 63,180 | |
| MI | DEM | Peters, Gary | 255,305 | 38,700 | 294,005 | |
| MN | REP | Barrett, Robert Paul Mr Jr. | 4,162 | 0 | 4,162 | |
| MN | DFL | Overby, Paula Mirare | 100 | 0 | 100 | |
| MN | REP | Lewis, Jason | 46,385 | 3,400 | 49,785 | |
| MN | DEM | Smith, Tina | 17,919 | 3,600 | 21,519 | |
| MS | REP | Hyde-Smith, Cindy | 540 | 0 | 540 | |
| MS | DEM | Espy, Michael | 28,924 | 5,300 | 34,224 | |
| MT | DEM | Mues, John | 526 | 0 | 526 | |
| MT | REP | Daines, Steve | 190,190 | 0 | 190,190 | |
| MT | DEM | Collins, Wilmot James | 6,504 | 0 | 6,504 | |
| MT | DEM | Bullock, Steve | 0 | 94,100 | 94,100 | |
| MT | REP | Daines, Steven | 0 | 33,200 | 33,200 | |
| NC | DEM | Cunningham, Cal | 307,616 | 0 | 307,616 | |
| NC | DEM | Cunningham, Cal; Dscc | coordinated | 95,742 | 0 | 95,742 |
| NC | DEM | Fuller, Trevor Michael | 350 | 0 | 350 | |
| NC | DEM | Carolina Blue | pro-Cunningham | 71,999 | 17,300 | 89,299 |
| NC | REP | Faith & Power Pac | anti-Cunningham | 25,570 | 1,600 | 27,170 |
| NC | REP | Tillis, Thom R. Sen. | 4,703 | 15,600 | 20,303 | |
| NE | DEM | Shelton, Alisha | 167 | 0 | 167 | |
| NE | DEM | Macek, Dennis Frank | 2,537 | 0 | 2,537 | |
| NE | DEM | Janicek, Chris Edward Mr | 743 | 0 | 743 | |
| NE | REP | Sasse, Benjamin E | 20,997 | 18,900 | 39,897 | |
| NH | REP | O'Brien, William Lawrence | 792 | 0 | 792 | |
| NH | REP | Bolduc, Donald C. | 985 | 0 | 985 | |
| NH | REP | Messner, Bryant 'Corky' S. | 16,134 | 1,900 | 18,034 | |
| NH | DEM | Shaheen, Jeanne | 4,955 | 7,700 | 12,655 | |
| NJ | IND | Fernandez, Veronica | 170 | 0 | 170 | |
| NJ | DEM | Booker, Cory A. | 11,677 | 0 | 11,677 | |
| NJ | REP | Mehta, Rikin | 1,156 | 0 | 1,156 | |
| NJ | REP | Meissner, Stuart | 500 | 0 | 500 | |
| NJ | REP | Singh, Hirsh V | 7,477 | 0 | 7,477 | |
| NJ | DEM | Booker, Cory | 0 | 19,000 | 19,000 | |
| NM | REP | Clarkson, Gavin | 21,710 | 0 | 21,710 | |
| NM | REP | Ronchetti, Mark V. | 5,096 | 0 | 5,096 | |
| NM | REP | Sanchez, Louie J | 2,845 | 0 | 2,845 | |
| NM | REP | Rich, Mick | 1,809 | 0 | 1,809 | |
| NM | REP | Martinez, Elisa | 3,357 | 0 | 3,357 | |
| NM | DEM | Lujan, Ben Ray | 0 | 4,400 | 4,400 | |
| NY | DEM | Gillibrand, Kirsten | 18,513 | 0 | 18,513 | |
| OK | REP | Inhofe, James M. Sen. | 11,203 | 0 | 11,203 | |
| OK | DEM | Broyles, Abby | 21,161 | 0 | 21,161 | |
| OK | REP | Stitt, Jj Mr. | 1,074 | 0 | 1,074 | |
| OR | REP | Perkins, Jo Rae | 100 | 0 | 100 | |
| OR | DEM | Merkley, Jeffrey Alan | 112,834 | 0 | 112,834 | |
| RI | REP | Waters, Allen | 1,748 | 0 | 1,748 | |
| SC | REP | Reynolds, Joseph | 2,557 | 0 | 2,557 | |
| SC | REP | Buckner, Dwayne Duke | 1,149 | 0 | 1,149 | |
| SC | REP | Security Is Strength | pro-Graham | 9,161 | 0 | 9,161 |
| SC | REP | Williams, Lloyd Benton Mr. Iii | 200 | 0 | 200 | |
| SC | REP | Lapierre, Michael James | 5,504 | 0 | 5,504 | |
| SC | REP | Graham, Lindsey O. | 891,978 | 131,000 | 1,022,978 | |
| SC | DEM | Harrison, Jaime | 1,319,007 | 343,000 | 1,662,007 | |
| SD | REP | Rounds, Mike | 8,757 | 0 | 8,757 | |
| SD | DEM | Ahlers, Dan | 25 | 0 | 25 | |
| SD | REP | Borglum, Scyller | 328 | 0 | 328 | |
| TN | REP | Bush, Byron | 2,193 | 0 | 2,193 | |
| TN | REP | Sethi, Dr. Manny | 24,249 | 0 | 24,249 | |
| TN | REP | Gapp, Joshua Dominique Gregory | 5,678 | 0 | 5,678 | |
| TN | REP | Presley, Johnny W | 660 | 0 | 660 | |
| TN | IND | Mcleod, Elizabeth D | 247 | 0 | 247 | |
| TN | REP | Flinn, George S Dr Jr | 99,212 | 0 | 99,212 | |
| TN | REP | Hagerty, Bill | 83,456 | 72,500 | 155,956 | |
| TN | DEM | Mackler, James | 520 | 4,100 | 4,620 | |
| TX | DEM | West, Royce | 91,297 | 0 | 91,297 | |
| TX | REP | Yancey, Mark Spencer | 6,634 | 0 | 6,634 | |
| TX | REP | Stovall, Dwayne | 4,910 | 0 | 4,910 | |
| TX | DEM | Edwards, Amanda | 57,817 | 0 | 57,817 | |
| TX | DEM | Garcia, Anne | 62,466 | 0 | 62,466 | |
| TX | REP | Cornyn, John Sen | 47,218 | 8,100 | 55,318 | |
| TX | DEM | Hegar, Mary Jennings Mj | 0 | 16,100 | 16,100 | |
| TX | DEM | Tzintzun Ramirez, Cristina | 51,959 | 800 | 52,759 | |
| VA | REP | Faulkner, Omari | 3,433 | 0 | 3,433 | |
| VA | REP | Speciale, Thomas A Ii | 1,008 | 0 | 1,008 | |
| VA | REP | Baldwin, Alissa | 610 | 0 | 610 | |
| VA | REP | Gade, Daniel Macarthur Mr. | 16,264 | 800 | 17,064 | |
| VA | DEM | Warner, Mark Robert | 4,101 | 100 | 4,201 | |
| WV | DEM | Swearengin, Paula Jean | 22,703 | 0 | 22,703 | |
| WY | REP | Lummis, Cynthia Marie Mrs. | 21,225 | 0 | 21,225 | |
| WY | REP | Miller, Bryan | 121 | 0 | 121 | |
| WY | REP | Wheeler, Joshua B | 630 | 0 | 630 | |
| WY | DEM | Ben David, Merav | 100 | 0 | 100 | |
| WY | REP | Lummis, Cynthia Marie | 0 | 5,900 | 5,900 | |
| Numbers include spending between January 2 and May 9 for Facebook and January 5 and May 9 for Google. Spenders include 2020 U.S. Senate candidates, leadership PACs, and single-candidate super PACs in support of (or in opposition to) those candidates. Single-candidate super PAC identifications are from the Center for Responsive Politics. See “About the Data” section at the end of this report for more information on our methodology. |
||||||
Several groups that are not connected with particular candidates who are spending heavily on TV are also spending on digital ads. We took the top groups advertising on broadcast television (since January 1, 2020) in support of or in opposition to Senate candidates, and we looked for any advertising spending by those groups on Facebook or Google. This is not a full list of pro or anti-candidate groups spending on Facebook or Google, nor is all of the spending reported in the table in support or opposition of Senate candidates. The top groups in this category are shown in Table 7. Heading the list is Vote Vets Action Fund, which has spent over $375,000 on ads. The Republican group, America First Policies, has spent about $350,000 on Facebook ads. All told, these digital efforts are much lower than their spending on TV spots in Senate races (see Table 2); the groups listed in Table 7 have spent over $23 million in TV ads, while the total in Table 7 is about $2 million.
Table 7: Digital Spending by Top Non-Candidate Groups Airing Ads on TV in Senate Races
| Sponsor | Facebook Spend ($) | Google Spend ($) | FB+Google Spend ($) |
|---|---|---|---|
| Vote Vets Action Fund | 225,993 | 150,400 | 376,393 |
| America First Policies Inc. | 347,117 | 0 | 347,117 |
| Senate Majority PAC | 289,129 | 0 | 289,129 |
| Advancing AZ | 229,240 | 13,800 | 243,040 |
| Doctor Patient Unity | 216,091 | 0 | 216,091 |
| Maine Momentum | 84,001 | 66,200 | 150,201 |
| Iowa Forward | 85,366 | 33,300 | 118,666 |
| Majority Forward | 67,886 | 28,000 | 95,886 |
| VoteVets | 63,835 | 10,000 | 73,835 |
| One Nation | 41,979 | 13,300 | 55,279 |
| Senate Leadership Fund | 15,650 | 7,600 | 23,250 |
| Taxpayers Protection Alliance | 4,998 | 0 | 4,998 |
| Numbers include spending between January 2 and May 9 for Facebook and January 5 and May 9 for Google. | |||
Trump Leads Biden in TV and Digital Spending
Total spending on advertising in the presidential race has passed the $1.2 billion mark. Nearly $750 million of that is from broadcast and national cable while digital advertising spending is nearing $328 million. (An additional $84 million in ads have aired on local cable stations, with nearly $50 million on radio spots.)
We show television advertising in the presidential race over the last month in Table 8. Although Trump and his outside group allies have spent more money (just over $6.1 million in the period between April 6 and May 10 compared to $5.6 million for or on behalf of Biden), pro-Biden airings have been more common (8,267 airings plus an additional ad by Republicans for the Rule of Law compared to 5,933 pro-Trump airings). Biden himself has not sponsored any television advertising during this period on broadcast television or national cable.
Table 8: Television Advertising in the Presidential Race Since April 5
| Sponsor | Airings | Est. Cost | |
|---|---|---|---|
| AB PAC | anti-Trump | 2,305 | 1,445,830 |
| Be A Hero PAC | anti-Trump | 180 | 171,720 |
| Priorities USA Action | pro-Biden | 5,703 | 3,474,590 |
| The Lincoln Project | pro-Biden | 40 | 36,650 |
| Unite the Country | pro-Biden | 39 | 480,740 |
| Trump, Donald | 120 | 3,262,830 | |
| America First Action | anti-Biden | 5,811 | 2,822,860 |
| Great America PAC | pro-Trump | 1 | 15,000 |
| Republicans for the Rule of Law | anti-Trump | 1 | 11,890 |
| Restoration PAC | anti-Biden | 1 | 34,270 |
| Numbers include ads aired on broadcast television or national cable between April 6 and May 10, 2020. CITE SOURCE OF DATA AS: Kantar/CMAG with analysis by the Wesleyan Media Project. |
|||
Table 9 shows digital spending by the Biden and Trump campaigns, along with spending by their super PACs, since January of 2019 and since early April of 2020. Trump’s campaign has massively outspent Biden’s campaign on digital ads on Facebook and Google since January 2019, $55 million v. $20 million. Biden also lags Trump in spending over the past 6 weeks. While Trump’s campaign has spent $7.7 million on the two platforms, Biden’s campaign has spent $4.7 million. The two candidates’ super PACs, Unite the Country and Great America PAC, have been largely silent on digital since early April.
Table 9: Digital Spending by Trump and Biden
| FB $ (since Jan 2019) | FB $ (since early Apr) | Google $ (since Jan 2019) | Google $ (since early Apr) | FB+Google $ (since Jan 2019) | FB+Google $ (since early Apr) |
|
|---|---|---|---|---|---|---|
| Biden | 13,415,117 | 3,384,003 | 6,929,600 | 1,341,400 | 20,344,717 | 4,725,403 |
| Trump | 35,263,528 | 4,556,128 | 20,230,100 | 3,103,200 | 55,493,628 | 7,659,328 |
| Unite the Country (pro-Biden) | 875,442 | 0 | 306,100 | 0 | 1,181,542 | 0 |
| Great America PAC (pro-Trump) | 106,776 | 4,503 | 6,900 | 0 | 113,676 | 4,503 |
| Digital spending figures come from the Facebook ad library reports and the Google Transparency Report. Spending covers the January 6, 2019 or April 5, 2020, to May 9, 2020 period for Facebook and Google. Candidate spending numbers include spending by official campaign committees, leadership PACs, and joint fundraising committees. See “About the Data” section at the end of this report for more information on our methodology. |
||||||
Little Covid-19 Impact on Ad Volumes
Figure 1 shows the volume of ad airings by week in the 2012, 2016 and 2020 presidential races. While 2020 far surpassed the previous two election cycles in ad volume in January, February and March, ad volumes dropped to almost nothing in mid-March. But this drop is consistent with advertising in the previous two cycles, which was also low in late March and April.
“We’re not seeing evidence that Covid-19 is stimulating television advertising in the presidential race to make up for cancelled campaign rallies,” said Travis Ridout, co-director of the Wesleyan Media Project. “But we also don’t have sufficient evidence to suggest that Covid-19 is leading advertising to totally abandon their ad spending. The lack of ad spending in the past six weeks is likely due to the fact that the Democratic nomination race is now settled.”
Figure 1: Presidential Race Ads by Week and Year
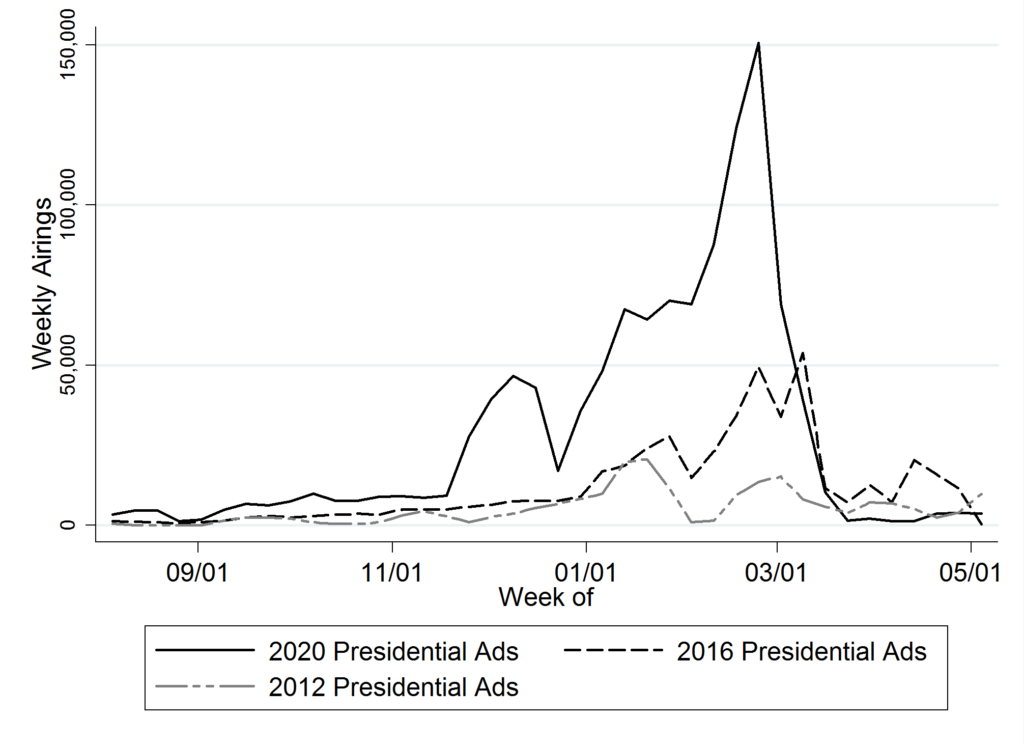
January 1 of the election year and May 10.
CITE SOURCE OF DATA AS: Kantar/CMAG with analysis by the Wesleyan Media Project.
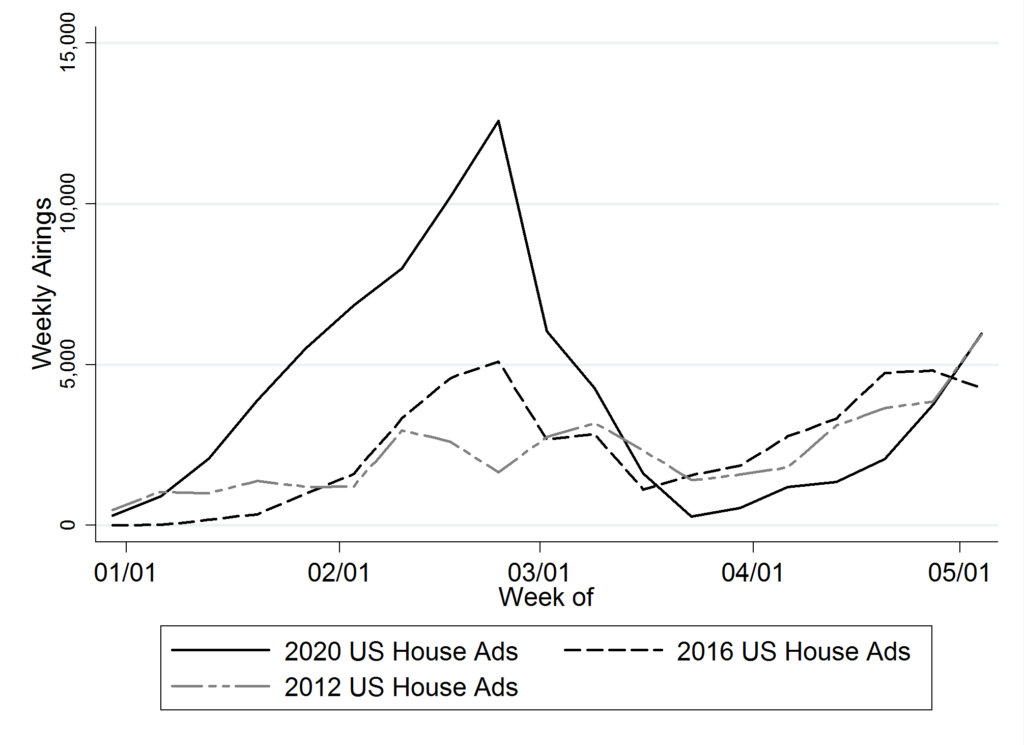
Figure 2 speaks to ad volumes in U.S. House races. While advertising levels in 2020 were lower than in 2012 and 2016 for much of March and April, for May they are almost identical to ad volumes in 2012 and surpassed ad volumes in 2016.
Figure 2: U.S. House Race Ads by Week and Year
January 1 of the election year and May 10.
CITE SOURCE OF DATA AS: Kantar/CMAG with analysis by the Wesleyan Media Project.
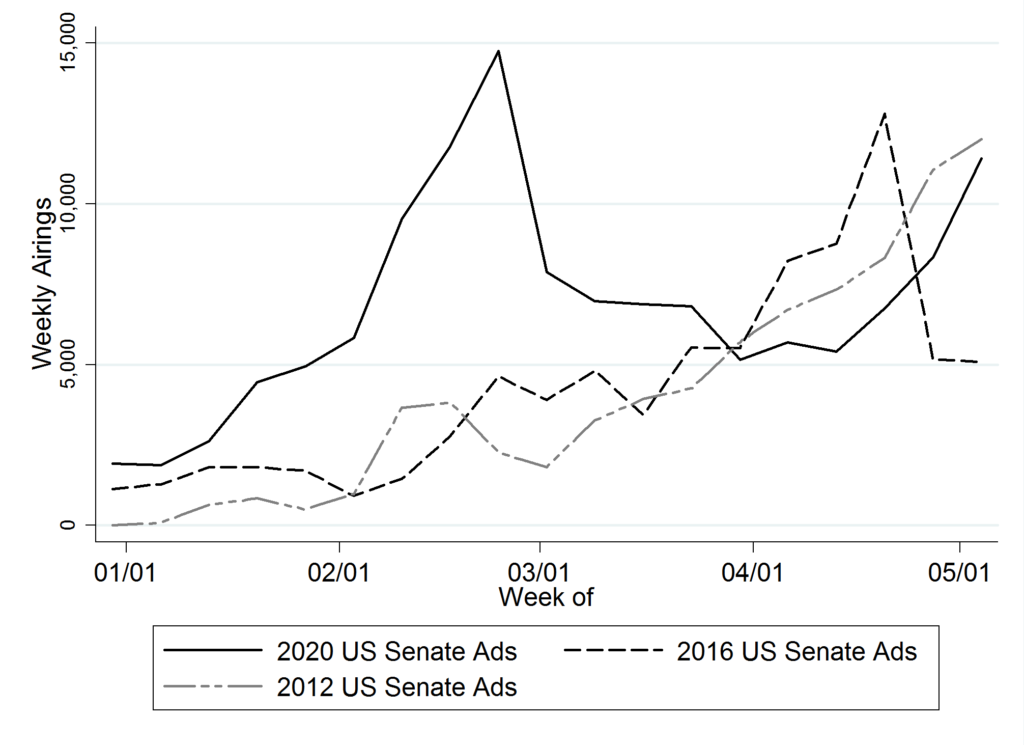
Figure 3 shows ad airings over time in U.S. Senate races. Before April, ad volumes were higher than in the previous two cycles, but since the start of April, ad volumes are not dramatically different from 2012 and 2016.
Figure 3: U.S. Senate Race Ads by Week and Year
January 1 of the election year and May 10.
CITE SOURCE OF DATA AS: Kantar/CMAG with analysis by the Wesleyan Media Project.
About the Data
For the television ad totals, data reported here are from Kantar/CMAG and do not cover local cable buys, only broadcast television, national network and national cable advertising.
For Facebook ads, data come from the aggregate reports. Aggregate report entries are provided for each page name and disclaimer combination. In early January 2019, Facebook did not include page IDs (a unique identifier) for each entry in the aggregate report. Because pages can have the same name, a unique identifier for each page would be required to definitively identify an aggregate report entry, which Facebook does not provide going backward. Therefore, we did our best to associate each entry in the January 5, 2019, report with a page ID, which we had access to through the library API. There may be some slippage if two pages associated with candidates had identical names and disclaimers, but we believe these instances are rare for the set of ads covered in this report. We looked for pages attached to each candidate, including possible leadership PACs, joint-fund-raising committees, and, in the case of presidential candidates, affiliated Senate/House pages. To calculate our totals for this report, we used the 1/5/19 report and merged on the 5/9/20 report totals. In each report, Facebook provides the to-date totals for each row, which covers the full archive back to May 2018. For presidential spending we subtracted the 1/5/19 total from the 5/9/20 total to get the spending by page and disclaimer for 1/6/19 through 5/9/20. For senate spending, which we are only reporting from 2020, we subtracted the 1/1/20 total from the 5/9/20 total. Pages can sponsor ads that are funded by different entities. We made the assumption that all spending by federal office-holders running for president this cycle (e.g., Cory Booker) was in support of their presidential campaign up until they date they dropped out of the presidential race (if applicable), even if some spending was reported from their House or Senate page or leadership PAC, especially because many of the leadership PAC spending occurred on the same pages as the campaign spending. Advertisements run by pages known to be associated with presidential candidates are included even in instances where the ads ran without an appropriate disclaimer.
In Table A (click here to download), we list the page names/disclaimer rows from the aggregate reports that we identified for this report. It is possible that we missed some spending from a Facebook page affiliated with a candidate running for office. This is exacerbated by the absence of EIN or FEC identifiers in the Facebook reports.
For Google ads, we downloaded the weekly reports from the platform’s Transparency Report. As a matter of practice with all of the platform data, we try to replicate our prior spending figures when we are calculating numbers for a new release. In that process, we discovered discrepancies between the data we downloaded in November and the information available in the December download for the same dates, which persists in May. Based on conversations with Google, we believe the discrepancies are partially but not exclusively due to the addition of advertisers targeting state-level races. We are working on a process to report these discrepancies, but the totals reflected in this release are current as of 5/12/20, the day on which we pulled the transparency report. Table B (linked to below) reports these discrepancies as they relate to our previous press release. Google only includes spending in federal and state races and only includes weekly totals but lists the sponsor’s EIN or FEC committee ID. We searched the list of advertisers for presidential candidates and affiliated leadership PACs and joint-fund-raising committees, candidates for U.S Senate and affiliated single-candidate super PACs, along with a few key groups that are advertising on TV in the senate race. We made the same assumption as with the Facebook data about any spending from House and Senate campaign committees by declared presidential candidates. Google spending is from 1/6/19 through 5/9/20 for presidential advertisers and 1/6/20 through 5/9/20 for senate advertisers.
In Table B (click here to download), we list the advertiser name for all entries used in this report to calculate Google spending totals.
About This Report
The Wesleyan Media Project (WMP) provides real-time tracking and analysis of political advertising in an effort to increase transparency in elections. Housed in Wesleyan’s Quantitative Analysis Center (QAC) – part of the Allbritton Center for the Study of Public Life – the Wesleyan Media Project is the successor to the Wisconsin Advertising Project, which disbanded in 2009. It is directed by Erika Franklin Fowler, associate professor of government at Wesleyan University, Michael M. Franz, professor of government at Bowdoin College and Travis N. Ridout, professor of political science at Washington State University. WMP personnel include Laura Baum (Project Manager), Colleen Bogucki (Project Coordinator), Pavel Oleinikov (Associate Director, QAC), and Courtney Page-Tan (Post-Doctoral Fellow).
The Wesleyan Media Project’s digital advertising tracking is supported by the contributions of students in Delta Lab, an interdisciplinary research collaborative focusing on computationally-driven and innovative analyses and visualizations of media messaging.
The Wesleyan Media Project is supported by Wesleyan University, the John S. and James L. Knight Foundation, and the Democracy Fund. WMP is partnering again this year with the Center for Responsive Politics, to provide added information on outside group disclosure.
Periodic releases of data will be posted on the project’s website and dispersed via Twitter @wesmediaproject. To be added to our email update list, click here.
For more information contact:
Lauren Rubenstein, lrubenstein@wesleyan.edu,
(860) 685-3813 or (203) 644-7144
About Wesleyan University
Wesleyan University, in Middletown, Conn., is known for the excellence of its academic and co-curricular programs. With more than 2,900 undergraduates and 200 graduate students, Wesleyan is dedicated to providing a liberal arts education characterized by boldness, rigor and practical idealism. For more, visit wesleyan.edu.
About the John S. and James L. Knight Foundation
Knight Foundation is a national foundation with strong local roots. We invest in journalism, in the arts, and in the success of cities where brothers John S. and James L. Knight once published newspapers. Our goal is to foster informed and engaged communities, which we believe are essential for a healthy democracy.
About Democracy Fund
Created by eBay founder and philanthropist Pierre Omidyar, Democracy Fund is a foundation helping to ensure that our political system can withstand new challenges and deliver on its promise to the American people. Democracy Fund has invested more than $125 million in support of a healthy, resilient, and diverse democracy with a particular focus on modern elections, effective governance, and a vibrant public square.


