Photo: Joe Biden Campaign
Senate Ads Still Airing;
Nine Percent of Federal Ads on TV Mention Coronavirus
(MIDDLETOWN, CT) April 9, 2020 – Television advertising in the presidential race has slowed to a trickle in the past couple of weeks just prior to Bernie Sanders suspending his campaign and ending the 2020 Democratic nomination race—and ads have dropped off in House and Senate races as well.
Figure 1 shows the number of airings in the presidential race by week, which peaked at almost 150,000 at the end of February 2020 (shown in the solid line). But in the past two weeks, airings dropped to just under 4,000 total spots (between March 23 and April 5).
“Although Bernie Sanders remained in the race over the last few weeks, the table was already set for the general election matchup,” said Travis Ridout, co-director of the Wesleyan Media Project. “Thus, the millions in spending on the Democratic nomination race has all but dried up.”
This huge drop off in advertising in 2020 is not all that different from the pattern in 2016 and 2012. Both years saw a considerable drop in advertising in late March as the party nominations were sewn up. As such, the drop in advertising this year was somewhat expected given Biden’s recent momentum, along with Bloomberg’s and Steyer’s exit from the race. Still, the impact of the coronavirus is clear. Two states with March primaries (Ohio, on March 17 and Georgia on March 24)—both of which would have featured some advertising from Biden and Sanders— have postponed them to late April (Ohio) and May (Georgia). Plus, Americans’ attentions have turned away from politics, and the candidates more generally have scaled back their political appeals.
Figure 1: Presidential Race Ads by Week and Year
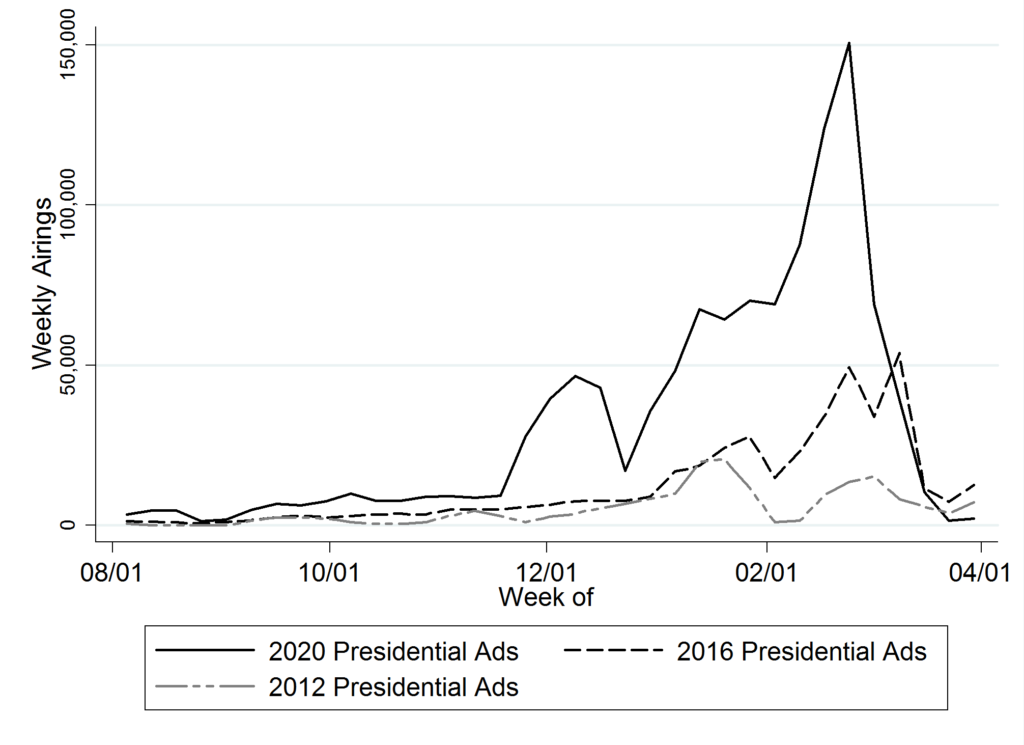
CITE SOURCE OF DATA AS: Kantar/CMAG with analysis by the Wesleyan Media Project.
Indeed, no candidate-sponsored ads have aired since March 21. Since that date only four groups have aired president-focused ads: Priorities USA Action (a Democratic-leaning group) with $2.7 million in spending; Unite the Country (Joe Biden’s super PAC) with $670,000 in spending; Be a Hero PAC (which aired an anti-Trump ad about the administration’s response to the coronavirus), with $40,000 in spending; and AB PAC (a Democratic-leaning group that has aired anti-Trump ads) with about $30,000 in spending.
Advertising in House races has also dropped off, as Figure 2 shows in the solid line. Advertising was never that high in House races, reaching over 12,000 ads per week at the end of February (still much higher than in the early campaigns of 2012 and 2016), but the volume of ads has been close to 0 since mid-March. House ad airings in the past two weeks are also down from the volume in 2016 and 2012.
“There could be a coronavirus effect on political advertising,” said Michael Franz, co-director of the Wesleyan Media Project. “Campaigns may be sensing that the mood of the country is one in which people do not want to think about politics—or they have more pressing concerns on their minds.”
Figure 2: US House Race Ads by Week and Year
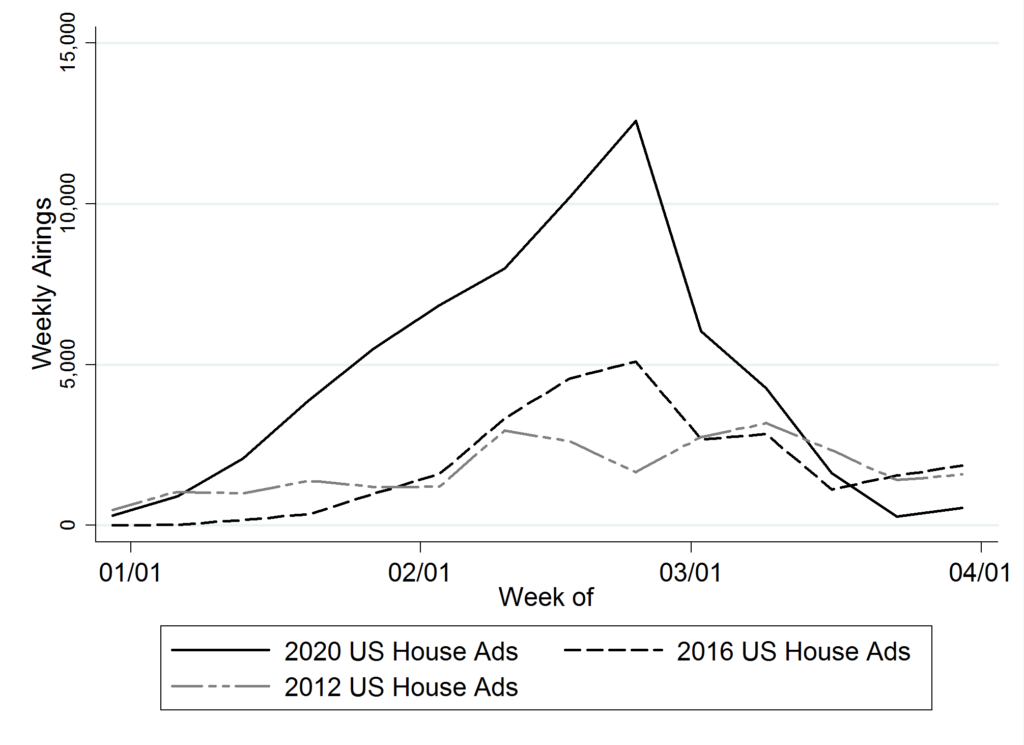
CITE SOURCE OF DATA AS: Kantar/CMAG with analysis by the Wesleyan Media Project.
There has been a drop in Senate ads as well (Figure 3), but the decline has not been as steep as for House races. Groups such as Senate Majority PAC, a Democratic super PAC, are still on the air, as are individual candidates, such as Sen. Mitch McConnell and his opponent Amy McGrath in Kentucky; Sen. Susan Collins and her opponent Sara Gideon in Maine; Mark Kelly in Arizona; Sen. Steve Daines in Montana and Sen. Tom Cotton in Arkansas. Moreover, the number of Senate airings in the past weeks is quite similar to the number of such airings in 2016 and 2012 (though still on the decline vs. the upward trend in those cycles).
Figure 3: US Senate Race Ads by Week and Year
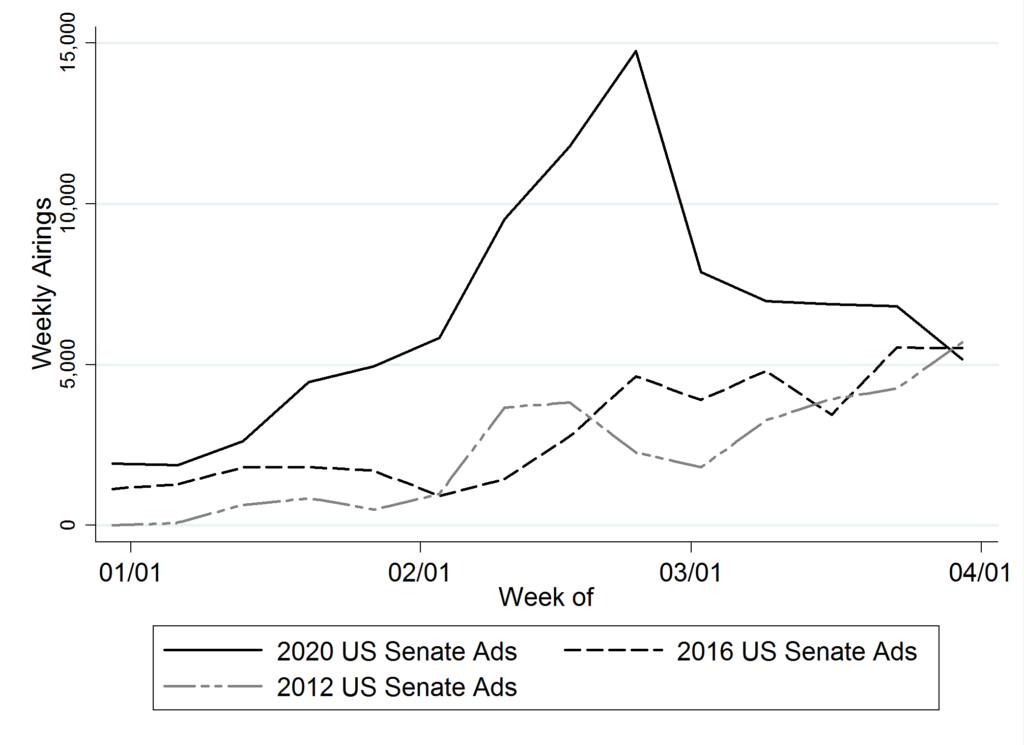
CITE SOURCE OF DATA AS: Kantar/CMAG with analysis by the Wesleyan Media Project.
Since Super Tuesday on March 3, $37.7 million has been spent on ads in the presidential race, $14.2 million has been spent on ads in Senate races, and $4.7 million has been spent on ads in House races (Table 1).
Table 1: Ad Airings and Spending by Race Type
| Ads | Spending | ||
|---|---|---|---|
| President | All 2019 | 299,311 | 239,433,400 |
| 1/1/20 to 3/3 | 751,016 | 474,633,340 | |
| 3/4 to 4/5 | 83,259 | 37,666,470 | |
| US Senate | All 2019 | 67,795 | 43,094,600 |
| 1/1/20 to 3/3 | 61,250 | 27,922,900 | |
| 3/4 to 4/5 | 29,607 | 14,198,620 | |
| US House | All 2019 | 53,028 | 28,155,240 |
| 1/1/20 to 3/3 | 54,221 | 21,307,540 | |
| 3/4 to 4/5 | 8,785 | 4,665,130 | |
| Numbers include ads aired on broadcast television and national cable between January 1, 2019, and April 5, 2020. CITE SOURCE OF DATA AS: Kantar/CMAG with analysis by the Wesleyan Media. |
|||
Nine percent of Federal Ads on Television Mention COVID-19
Table 2 shows the percentage of presidential, House and Senate ads airing between March 4 and April 5 that have referenced or explicitly mentioned COVID-19 or the coronavirus. In the presidential race, 7.4 percent of airings in the past month have mentioned the virus, compared to 7.0 percent of House ads and 15.7 percent of Senate ads. All told, about 9.4 percent of ad airings in federal races in the past month have referenced the coronavirus.
Table 2: COVID-19 Mentions by Race Type
| Total Airings | Covid-19 Mentions | Percent | |
|---|---|---|---|
| President | 83,259 | 6,170 | 7.4 |
| US House | 8,785 | 613 | 7.0 |
| US Senate | 29,607 | 4,656 | 15.7 |
| Total | 121,651 | 11,439 | 9.4 |
| Numbers include ads aired on broadcast television and national cable between March 4, 2020 and April 5, 2020. CITE SOURCE OF DATA AS: Kantar/CMAG with content coding and analysis by the Wesleyan Media Project. |
|||
“Coronavirus references represent a small portion of political advertising messages from the last month,” said Erika Franklin Fowler, co-director of the Wesleyan Media Project, “but we do expect them – along with health policy issues (continuing the focus from the 2018 election) – to feature prominently as we head into summer and the general election phase of the campaign.”
Joe Biden’s presidential campaign mentioned the virus in a television ad that aired March 12-17, but those ads accounted for only 1.5 percent of his campaign’s ad airings since March 4. Priorities USA Action, the pro-Democratic super PAC, has mentioned COVID-19 in 59 percent of its ad airings, including $2.5 million on the ad that President Trump denounced and asked broadcast stations to stop running. Those ads debuted on television on March 24. Notably, Michael Bloomberg aired the first ad that mentioned the virus, and it started airing on February 26. It aired over 14,000 times through Super Tuesday, costing nearly $7 million.
The Senate candidates mentioning the coronavirus in their television advertising include Sen. Susan Collins and her opponent Sara Gideon, in Maine—both airing positive spots about tackling the crisis; Sen. Mitch McConnell and his opponent Amy McGrath, in Kentucky, with McConnell touting his leadership in the Senate and attacking McGrath for “false attacks”; and Sen. Steve Daines in Montana, discussing his efforts in the Senate to help the state.
Biden Tops Facebook and Google Spending in Past Month
Since the start of 2019, candidates for president, including spending from their leadership PACs and unaffiliated single-candidate super PACs, have spent $185 million on Facebook ads and $132 million on Google ads. This combined $317 million compares to $751 million in TV ads from all sponsors in the presidential race (see Table 1).
In Table 3, we outline the total spending and more recent spending on Facebook and Google from the Biden, Sanders, and Trump—the last remaining major candidates in the race—and from Biden’s super PAC Unite the Country and Trump’s Great America PAC.
Table 3: Digital Spending by Sponsor
| Facebook (since Jan 2019) | Facebook (since Mar 8) | Google (since Jan 2019) | Google (since Mar 7) | FB+Google (since Jan 2019) | FB+Google (since early Mar) |
|
|---|---|---|---|---|---|---|
| Biden | 10,031,114 | 3,271,864 | 5,663,100 | 957,400 | 15,694,214 | 4,229,264 |
| Trump | 30,707,400 | 2,401,105 | 18,209,900 | 2,202,900 | 48,917,300 | 4,604,005 |
| Sanders | 13,434,588 | 1,225,945 | 8,710,600 | 895,400 | 22,145,188 | 2,121,345 |
| Unite the Country (pro-Biden) | 875,442 | 126,528 | 306,100 | 0 | 1,181,542 | 126,528 |
| Great American PAC (pro-Trump) | 102,273 | 1,137 | 6,900 | 0 | 109,173 | 1,137 |
| Digital spending figures come from the Facebook ad library reports and the Google Transparency Report. Spending covers the January 6, 2019 or March 9, 2020, to April 4, 2020 period for Facebook, and the January 6, 2019 or March 8, 2020, to April 4, 2020 period for Google. Candidate spending numbers include spending by official campaign committees, leadership PACs, and joint fundraising committees. Candidates who dropped out of the race prior to our last press release on digital—and groups that did not air presidential-related ads in the past month but did earlier—are not listed in this table. See “About the Data” section at the end of this report for more information on our methodology. |
||||||
Very little of the Facebook activity from presidential candidates (including spending from leadership PACs and single-candidate super PACs) have spent time mentioning the coronavirus. Biden has ran Facebook advertisements starting on March 29,2020, mentioning the issue – see these examples: facing a challenge, totally online presidential campaign, and in times of uncertainty – though they comprised a small portion (less than one percent of spending and between 1 and 2 percent of impressions) of his activity after March 1. (Spending and impression data at the ad-level on Facebook are reported in ranges, rather than actual spend). Great America PAC (a pro-Trump group) also spent a small amount of money online in late March on Facebook creatives asking individuals to rate Trump’s leadership (see America’s at war with a virus). Less than half of the spending and between 21-37 percent of the impressions garnered by Great America PAC during the period after March 2 contained a reference to the coronavirus.
About the Data
For the television ad totals, data reported here are from Kantar/CMAG and do not cover local cable buys, only broadcast television, national network and national cable advertising.
For Facebook ads, data come from the aggregate reports. Aggregate report entries are provided for each page name and disclaimer combination. In early January 2019, Facebook did not include page IDs (a unique identifier) for each entry in the aggregate report. Because pages can have the same name, a unique identifier for each page would be required to definitively identify an aggregate report entry, which Facebook does not provide going backward. Therefore, we did our best to associate each entry in the January 5, 2019, report with a page ID, which we had access to through the library API. There may be some slippage if two pages associated with presidential candidates had identical names and disclaimers, but we believe these instances are rare for the set of ads covered in this report. We looked for pages attached to each candidate, including possible leadership PACs, joint-fund-raising committees, and affiliated Senate/House pages. To calculate our totals for this report, we used the 1/5/19 report and merged on the 4/4/20 report totals. In each report, Facebook provides the to-date totals for each row, which covers the full archive back to May 2018. We subtracted the 1/5/19 total from the 4/4/20 total to get the spending by page and disclaimer for 1/6/19 through 4/4/20. Pages can sponsor ads that are funded by different entities. We made the assumption that all spending by federal office-holders running for president this cycle (e.g., Cory Booker) was in support of their presidential campaign up until they date they dropped out of the presidential race (if applicable), even if some spending was reported from their House or Senate page or leadership PAC, especially because many of the leadership PAC spending occurred on the same pages as the campaign spending. We separate Tom Steyer’s totals from Need to Impeach because he is not currently an elected official, and Need to Impeach ran anti-Trump ads before Steyer announced his run for the Democratic nomination (Need to Impeach is also a super PAC). Advertisements run by pages known to be associated with presidential candidates are included even in instances where the ads ran without an appropriate disclaimer.
In Table A (click here to download), we list the page names/disclaimer rows from the aggregated reports that we identified for this report. It is possible that we missed some spending from a Facebook page affiliated with a candidate running for office. This is exacerbated by the absence of EIN or FEC identifiers in the Facebook reports. A few disclaimers changed from being in all caps to proper case between this WMP report and previous reports.
For Google ads, we downloaded the weekly reports from the platform’s Transparency Report. As a matter of practice with all of the platform data, we try to replicate our prior spending figures when we are calculating numbers for a new release. In that process, we discovered discrepancies between the data we downloaded in November and the information available in the December download for the same dates, which persists in January. Based on conversations with Google, we believe the discrepancies are partially but not exclusively due to the addition of advertisers targeting state-level races. We are working on a process to report these discrepancies, but the totals reflected in this release are current as of 4/8/20, the day on which we pulled the transparency report. Table B (linked to below) reports these discrepancies as they relate to our previous press release. Google only includes spending in federal and state races and only includes weekly totals but lists the sponsor’s EIN or FEC committee ID. We searched the list of advertisers for presidential candidates and affiliated leadership PACs and joint-fund-raising committees. We made the same assumption as with the Facebook data about any spending from House and Senate campaign committees by declared presidential candidates. Google spending is from 1/6/19 through 4/4/20.
In Table B (click here to download), we list the advertiser name for all entries used in this report to calculate Google candidate totals.
About This Report
The Wesleyan Media Project (WMP) provides real-time tracking and analysis of political advertising in an effort to increase transparency in elections. Housed in Wesleyan’s Quantitative Analysis Center (QAC) – part of the Allbritton Center for the Study of Public Life – the Wesleyan Media Project is the successor to the Wisconsin Advertising Project, which disbanded in 2009. It is directed by Erika Franklin Fowler, associate professor of government at Wesleyan University, Michael M. Franz, professor of government at Bowdoin College and Travis N. Ridout, professor of political science at Washington State University. WMP personnel include Laura Baum (Project Manager), Colleen Bogucki (Project Coordinator), Pavel Oleinikov (Associate Director, QAC), and Courtney Page-Tan (Post-Doctoral Fellow).
The Wesleyan Media Project’s digital advertising tracking is supported by the contributions of students in Delta Lab, an interdisciplinary research collaborative focusing on computationally-driven and innovative analyses and visualizations of media messaging. We are particularly grateful to Conner Sexton ‘20, Spencer Dean ‘21 and Natchanok (Pim) Wandee ’23 for their contributions to this release.
The Wesleyan Media Project is supported by Wesleyan University,
the John S. and James L. Knight Foundation, and the Democracy Fund. WMP is partnering again this year with the Center for Responsive Politics, to provide added information on outside group disclosure.
Periodic releases of data will be posted on the project’s website and dispersed via Twitter @wesmediaproject. To be added to our email update list, click here.
For more information contact:
Lauren Rubenstein, lrubenstein@wesleyan.edu,
(860) 685-3813 or (203) 644-7144
About Wesleyan University
Wesleyan University, in Middletown, Conn., is known for the excellence of its academic and co-curricular programs. With more than 2,900 undergraduates and 200 graduate students, Wesleyan is dedicated to providing a liberal arts education characterized by boldness, rigor and practical idealism. For more, visit wesleyan.eduA
About the John S. and James L. Knight Foundation
Knight Foundation is a national foundation with strong local roots. We invest in journalism, in the arts, and in the success of cities where brothers John S. and James L. Knight once published newspapers. Our goal is to foster informed and engaged communities, which we believe are essential for a healthy democracy.
About Democracy Fund
Created by eBay founder and philanthropist Pierre Omidyar, Democracy Fund is a foundation helping to ensure that our political system can withstand new challenges and deliver on its promise to the American people. Democracy Fund has invested more than $125 million in support of a healthy, resilient, and diverse democracy with a particular focus on modern elections, effective governance, and a vibrant public square.


