Photo: Gage Skidmore/Flickr
Senate Ads Spike; Eight Races See 10,000 Spots since May
(MIDDLETOWN, CT) July 2, 2020 – A new analysis from the Wesleyan Media Project, in partnership with the Center for Responsive Politics, shows that Donald Trump has ramped up his TV ad spending. Through the entire cycle to-date, President Trump has aired just over 55,000 ads on television (on broadcast, national cable and national network stations) at an estimated cost of $52 million. Table 1 shows that 50,000 of those Trump spots have aired since May 11, a time period during which Biden aired only 3,103 ads at a cost of $3.2 million.
“President Trump is lagging in most polls, and his aggressive ad buys in recent weeks seem intended on boosting his numbers,” said Michael Franz, co-director of the Wesleyan Media Project.
Outside groups have accounted for 37 percent of airings in the presidential general election since May 11, and the Democratic nominee has been heavily reliant on their support. Eighty-six percent of pro-Biden ad airings have been sponsored by groups compared to just 19 percent of pro-Trump ad airings. Priorities USA, a top pro-Democratic outside group, has aired more than four times as many ads as Biden (13,694 airings), totaling near $7 million. In addition, AB PAC, formerly known as American Bridge 21st Century, has added nearly 4,000 spots to the pro-Biden total. The pro-Biden super PAC, Unite the Country, which bolstered his campaign throughout the primary phase, added another 1,600 ads. On the GOP side, a pro-Trump super PAC, America First Action, has sponsored over 11,000 spots since May 11. All told, pro-Biden advertisers have sponsored about 23,000 ads, but nearly three times as many pro-Trump ads have aired.
Table 1: Airings and Spending in Presidential Race
| Sponsor | Party Lean | Grp Type | Airings | Total $ |
|---|---|---|---|---|
| Joe Biden | 3,103 | 3,203,370 | ||
| AB PAC | Pro-Dem | Super PAC | 3,974 | 3,336,240 |
| Defending Democracy Together | Pro-Dem | 501c4 | 1 | 13,030 |
| Priorities USA Action | Pro-Dem | Carey PAC | 13,694 | 6,920,490 |
| Republicans For The Rule Of Law | Pro-Dem | 501c4 | 1 | 12,100 |
| The Lincoln Project | Pro-Dem | Super PAC | 514 | 450,900 |
| Unite The Country | Pro-Dem | Super PAC | 1,668 | 1,428,760 |
| Donald Trump | 50,314 | 31,390,040 | ||
| America First Action | Pro-Rep | Super PAC | 11,499 | 4,203,890 |
| Committee To Defend The President | Pro-Rep | Carey PAC | 131 | 101,400 |
| Restoration PAC | Pro-Rep | Super PAC | 1 | 44,000 |
| Total | 84,900 | 51,104,220 | ||
| Numbers include ads aired on broadcast television between May 11, 2020, and June 28, 2020. CITE SOURCE OF DATA AS: Kantar/CMAG with analysis by the Wesleyan Media Project. Group classification provided by the Center for Responsive Politics. |
||||
Biden has focused on markets in Arizona, Florida, Michigan, North Carolina, Pennsylvania, and Wisconsin. Priorities USA, the pro-Biden group, has focused its more numerous ad buys in just four states: Arizona, Michigan, Pennsylvania, and Wisconsin. AB PAC, another pro-Biden group, has aired ads in Michigan, Pennsylvania, and Wisconsin.
Trump has aired ads in all of these states, but has put additional ad buys in Alabama (619 spots in the Mobile market, which reaches into Florida), Georgia (<100 spots), Iowa (about 1,900 spots), Minnesota (631 ads), Nevada (1,300), Ohio (about 2,000 spots), and South Carolina (about 1,000 ads in the Greenville market, which reaches into North Carolina). He also spent over $8.5 million on a national cable buy that started airing May 27 and was on the air through the end date of this analysis, June 28. America First Action, a pro-Trump group, has focused its ads since May 11 on just three states: Michigan, Pennsylvania, and Wisconsin.
Table 2 lists pro-Trump and pro-Biden ad totals (combining candidate and group ads) at the market level between May 11 and June 28. The market with the most ads in this roughly six-week period was Grand Rapids, Michigan, with nearly 6,000 ads (3,480 by or on behalf of Trump and 2,499 by or on behalf of Biden). Trump has had the largest airing advantage in Tampa, Florida, with 2,665 more pro-Trump airings than pro-Biden ones (3,005 pro-Trump compared to 340 pro-Biden), and he has airing advantages in 29 markets that are greater than 500 airings. Biden, by contrast, has ad advantages in only four markets, and they are small by comparison: 59 in Lansing, Michigan, (59 to 0 pro-Trump), 61 in Tulsa, Oklahoma, (61 to 0 pro-Trump), 117 in Detroit, Michigan, (1,436 to 1,319 pro-Trump) and 874 in Flint, Michigan (1,564 to 690 pro-Trump).
Table 2: Airings and Spending by Media Market in Presidential Race
| State | Market | Total Airings | Trump Advantage | Pro-Trump | Trump | Trump Group | Pro-Biden | Biden | Biden Group |
|---|---|---|---|---|---|---|---|---|---|
| GA | Albany | 11 | 11 | 11 | 11 | 0 | 0 | 0 | 0 |
| GA | Atlanta | 14 | 14 | 14 | 14 | 0 | 0 | 0 | 0 |
| GA | Augusta | 9 | 9 | 9 | 9 | 0 | 0 | 0 | 0 |
| IA | Cedar Rapids | 308 | 308 | 308 | 308 | 0 | 0 | 0 | 0 |
| NC | Charlotte | 2,723 | 2,559 | 2,641 | 2,641 | 0 | 82 | 0 | 82 |
| OH | Cincinnati | 602 | 602 | 602 | 602 | 0 | 0 | 0 | 0 |
| OH | Cleveland | 362 | 362 | 362 | 362 | 0 | 0 | 0 | 0 |
| OH | Columbus | 607 | 607 | 607 | 607 | 0 | 0 | 0 | 0 |
| OH | Dayton | 291 | 291 | 291 | 291 | 0 | 0 | 0 | 0 |
| IA | Des Moines | 1,299 | 1,299 | 1,299 | 1,299 | 0 | 0 | 0 | 0 |
| MI | Detroit | 2,755 | -117 | 1,319 | 1,319 | 0 | 1,436 | 201 | 1,235 |
| PA | Erie | 1,836 | 1,370 | 1,603 | 617 | 986 | 233 | 0 | 233 |
| MI | Flint | 2,254 | -874 | 690 | 0 | 690 | 1,564 | 118 | 1,446 |
| FL | Ft. Myers | 1,957 | 1,957 | 1,957 | 1,957 | 0 | 0 | 0 | 0 |
| MI | Grand Rapids | 5,979 | 981 | 3,480 | 2,044 | 1,436 | 2,499 | 0 | 2,499 |
| WI | Green Bay | 4,806 | 1,426 | 3,116 | 1,986 | 1,130 | 1,690 | 172 | 1,518 |
| NC | Greensboro | 1,548 | 1,548 | 1,548 | 1,548 | 0 | 0 | 0 | 0 |
| NC | Greenville | 1,363 | 1,363 | 1,363 | 1,363 | 0 | 0 | 0 | 0 |
| SC | Greenville | 946 | 946 | 946 | 946 | 0 | 0 | 0 | 0 |
| PA | Harrisburg | 4,630 | 2,162 | 3,396 | 2,134 | 1,262 | 1,234 | 0 | 1,234 |
| FL | Jacksonville | 968 | 562 | 765 | 765 | 0 | 203 | 203 | 0 |
| PA | Johnstown | 4,007 | 339 | 2,173 | 1,235 | 938 | 1,834 | 106 | 1,728 |
| WI | La Crosse | 4,124 | 818 | 2,471 | 1,553 | 918 | 1,653 | 187 | 1,466 |
| MI | Lansing | 59 | -59 | 0 | 0 | 0 | 59 | 0 | 59 |
| NV | Las Vegas | 738 | 738 | 738 | 738 | 0 | 0 | 0 | 0 |
| GA | Macon | 9 | 9 | 9 | 9 | 0 | 0 | 0 | 0 |
| MI | Marquette | 1,019 | 365 | 692 | 384 | 308 | 327 | 60 | 267 |
| FL | Miami | 1,907 | 1,815 | 1,861 | 1,861 | 0 | 46 | 46 | 0 |
| WI | Milwaukee | 3,621 | 605 | 2,113 | 1,568 | 545 | 1,508 | 205 | 1,303 |
| MN | Minneapolis | 631 | 631 | 631 | 631 | 0 | 0 | 0 | 0 |
| AL | Mobile | 619 | 619 | 619 | 619 | 0 | 0 | 0 | 0 |
| National Cable | National Cable | 1,298 | 1,212 | 1,255 | 1,251 | 4 | 43 | 11 | 32 |
| National Network | National Network | 18 | 18 | 18 | 17 | 1 | 0 | 0 | 0 |
| FL | Orlando | 2,790 | 2,108 | 2,449 | 2,449 | 0 | 341 | 341 | 0 |
| FL | Panama City | 1,353 | 1,353 | 1,353 | 1,353 | 0 | 0 | 0 | 0 |
| PA | Philadelphia | 2,220 | 1,706 | 1,963 | 1,963 | 0 | 257 | 257 | 0 |
| AZ | Phoenix | 4,474 | 2,254 | 3,364 | 3,237 | 127 | 1,110 | 311 | 799 |
| PA | Pittsburgh | 3,963 | 975 | 2,469 | 1,405 | 1,064 | 1,494 | 135 | 1,359 |
| NC | Raleigh | 1,478 | 1,040 | 1,259 | 1,259 | 0 | 219 | 177 | 42 |
| NV | Reno | 548 | 548 | 548 | 548 | 0 | 0 | 0 | 0 |
| GA | Savannah | 24 | 24 | 24 | 24 | 0 | 0 | 0 | 0 |
| IA | Sioux City | 331 | 209 | 270 | 270 | 0 | 61 | 0 | 61 |
| FL | Tampa | 3,345 | 2,665 | 3,005 | 3,005 | 0 | 340 | 340 | 0 |
| MI | Traverse City | 3,541 | 169 | 1,855 | 1,135 | 720 | 1,686 | 102 | 1,584 |
| AZ | Tucson | 812 | 812 | 812 | 812 | 0 | 0 | 0 | 0 |
| OK | Tulsa | 61 | -61 | 0 | 0 | 0 | 61 | 0 | 61 |
| DC | Washington Dc | 3 | 3 | 3 | 3 | 0 | 0 | 0 | 0 |
| WI | Wausau | 1,545 | 5 | 775 | 0 | 775 | 770 | 0 | 770 |
| PA | Wilkes Barre | 4,498 | 88 | 2,293 | 1,566 | 727 | 2,205 | 131 | 2,074 |
| NC | Wilmington | 596 | 596 | 596 | 596 | 0 | 0 | 0 | 0 |
| Numbers include ads aired on broadcast television between May 11, 2020, and June 28, 2020. CITE SOURCE OF DATA AS: Kantar/CMAG with analysis by the Wesleyan Media Project. |
|||||||||
Since the beginning of 2019, presidential candidates and their allies have spent $800 million on broadcast television ads, which have aired 1.2 million times in markets across the country. Heavy advertising from candidates Michael Bloomberg and Tom Steyer earlier in the cycle bolstered these numbers.
Trump Leading Biden in Digital Spending by Smaller Margin
The Trump campaign is also outspending Biden on Facebook and Google advertising, though the difference between the two candidates is smaller online than it is on TV. Table 3 shows digital spending by the Biden and Trump campaigns and their super PACs since January 2019 and since May 9, 2020. Since January 2019, Trump has spent nearly twice as much on digital advertising as Biden. However, in the period since May 10 (just after Bernie Sanders dropped from the race), the gap between the two has narrowed, with Biden spending nearly $18 million and Trump just over $23 million. Spending by the two candidates’ super PACs online has been minimal in the general election phase so far.
“Whereas Biden has generally been slow to ramp up advertising on television, he clearly sees digital ads as in important part of his early general election strategy,” said Erika Franklin Fowler, co-director of the Wesleyan Media Project.
Table 3: Digital Spending by Presidential Candidates and Single-Candidate SuperPACs
| Facebook (since Jan 2019) | Facebook (since May 9) | Google (since Jan 2019) | Google (since May 9) | FB+Google (since Jan 2019) | FB+Google (since May 9) |
|
|---|---|---|---|---|---|---|
| Biden | 24,105,917 | 10,690,800 | 13,959,800 | 7,030,200 | 38,065,717 | 17,721,000 |
| Trump | 49,274,344 | 14,010,816 | 29,633,800 | 9,320,400 | 78,908,144 | 23,331,216 |
| Unite the Country (pro-Biden) | 876,655 | 1,213 | 297,400 | - | 1,174,055 | 1,213 |
| Great America PAC (pro-Trump) | 130,460 | 23,684 | 7,600 | - | 138,060 | 23,684 |
| Digital spending figures come from the Facebook ad library reports and the Google Transparency Report. Spending covers the January 6, 2019 or May 10, 2020, to June 27, 2020 period for Facebook and Google. Candidate spending numbers include spending by official campaign committees, leadership PACs, and joint fundraising committees. See “About the Data” section at the end of this report for more information on our methodology along with the specific page names and disclaimers that are counted. |
||||||
Total spending in the presidential race on Facebook and Google from January 6, 2019, through June 27, 2020, is nearly $370 million ($218,031,792 on Facebook and $151,673,800 on Google).
Kentucky, Iowa, Maine Top TV Ad Spending in Senate
Senate spending on ads has totaled nearly $60 million since May 11. Ad volume in the May to June period is far higher than the comparable period in the elections of 2014, 2016, and 2018. We discuss volume trends more below, but the 172,000 ads that aired since May 10 this cycle represents 57 percent higher volume than in 2014; 153 percent greater volume than in 2016; and 91 percent more than in 2018.
The Democrats hold a big advantage in spending, with candidate, party, and allied group spending totaling $36 million to the GOP’s $23 million. In ads aired, pro-Democratic sponsors have aired 103,000 spots compared to 69,000 for pro-Republican sponsors. See the party and sponsor totals in Table 4. These totals include spending for party primary campaigns and for early general election-related ads.
Table 4: Airings and Spending in U.S. Senate Races, 2020
| Candidate (Airings) | Candidate Spend ($) | Party (Airings) | Party Spend ($) | Group (Airings) | Group Spend ($) | Total Airings | Total Spend ($) |
|
|---|---|---|---|---|---|---|---|---|
| Democratic | 70,228 | 18,443,790 | 2,587 | 871,350 | 30,371 | 16,706,120 | 103,186 | 36,021,260 |
| Republican | 51,217 | 12,523,740 | 9,855 | 6,681,700 | 7,692 | 4,503,710 | 68,764 | 23,709,150 |
| Other | 20 | 12,560 | 0 | 0 | 0 | 0 | 20 | 12,560 |
| Total | 121,465 | 30,980,090 | 12,442 | 7,553,050 | 38,063 | 21,209,830 | 171,970 | 59,742,970 |
| Numbers include ads aired on broadcast television between May 11, 2020, and June 28, 2020. Party totals include independent and coordinate expenditures. CITE SOURCE OF DATA AS: Kantar/CMAG with analysis by the Wesleyan Media Project. |
||||||||
Table 5 shows Senate spending by state, including any ads aired in party primaries. Indeed, June was a heavy primary month given that many states delayed early spring primaries because of the coronavirus outbreak. Primaries were held in Kentucky, Georgia, Iowa, Montana, South Carolina, Colorado, Oklahoma, and New Mexico. The Democratic primaries in Kentucky and Colorado were generally seen as competitive. In Kentucky, Democrat Amy McGrath aired four times as many ads as competitor Charles Booker. And in Colorado, former Governor John Hickenlooper squared off against Andrew Romanoff, with Hickenlooper airing about three times as many ads as his opponent.
In Iowa, the National Republican Senatorial Campaign Committee has sponsored over 2,300 spots to bolster incumbent Joni Ernst, who has not yet aired a broadcast TV spot. She also got help from the group One Nation, with 559 spots in the last 6 weeks. All the other ads have been pro-Democratic ones, with three Democrats vying for the party nomination and three groups—Senate Majority PAC, Women Vote, and The Lincoln Project—either wading into the Democratic primary or attacking Ernst.
In Maine, Democrat Sara Gideon is vying to be the party’s nominee to run against Republican Susan Collins. The Democratic primary in the state is July 14, but Gideon is already running a general election-type campaign, attacking Collins. Gideon is also getting support from a number of outside groups, including Senate Majority PAC and End Citizens United. Collins is on the air too, with support from three other groups in the last six weeks—the 1820 PAC, One Nation, the Chamber of Commerce—as well as the National Republican Senatorial Campaign Committee.
Notable, also, are the ad totals in Arizona, which Democrats see as a possible pick-up. Mark Kelly’s campaign on the Democratic side has aired the most ads, with additional help from Advancing AZ, the League of Conservation Voters (LCV) Victory Fund, and Majority Forward. Republican incumbent Martha McSally is fighting to keep the seat she was appointed to, and she has aired nearly as many ads as Kelly, with additional help from two outside groups and the GOP’s Senate campaign committee.
Finally, in Montana incumbent Republican Steve Daines faces a tough challenge in current Governor (and former presidential candidate) Steve Bullock. Both Daines and Bullock easily won their parties’ primaries in early June. Daines has aired three times as many television ads as Bullock since May 11, but the Democrat has received help from four groups, including Majority Forward and the Senate Majority PAC.
Table 5: Airings and Spending by Race in U.S. Senate
| State | Airings | Pro-Dem Airings | Pro-GOP Airings | Total Spend ($) | Dem Cand Spend ($) | Rep Cand Spend ($) | Dem Group Spend ($) | Rep Group Spend ($) |
|---|---|---|---|---|---|---|---|---|
| KY | 25,460 | 20,000 | 5,460 | 5,967,810 | 4,503,380 | 1,091,310 | 373,120 | 0 |
| IA | 21,015 | 18,129 | 2,886 | 6,279,750 | 1,679,830 | 0 | 3,190,130 | 252,650 |
| ME | 17,865 | 10,410 | 7,455 | 8,366,710 | 1,287,830 | 634,340 | 2,908,730 | 1,783,710 |
| AZ | 17,349 | 8,916 | 8,433 | 7,604,930 | 1,689,230 | 1,559,670 | 2,126,440 | 1,203,810 |
| GA | 14,823 | 8,172 | 6,651 | 3,916,770 | 2,149,870 | 1,685,140 | 81,760 | 0 |
| MT | 13,439 | 6,100 | 7,339 | 2,450,630 | 225,880 | 517,440 | 1,439,190 | 268,120 |
| CO | 12,343 | 9,364 | 2,979 | 6,820,350 | 2,206,120 | 715,090 | 2,913,300 | 277,750 |
| MI | 10,643 | 4,821 | 5,822 | 6,778,510 | 98,890 | 1,692,270 | 1,841,260 | 236,150 |
| TN | 7,968 | 14 | 7,954 | 1,608,430 | 2,920 | 1,605,510 | 0 | 0 |
| KS | 7,743 | 1,158 | 6,585 | 1,518,510 | 225,640 | 1,120,400 | 0 | 172,470 |
| SC | 7,278 | 6,158 | 1,120 | 2,693,570 | 2,454,090 | 239,480 | 0 | 0 |
| NC | 6,688 | 4,183 | 2,505 | 3,331,490 | 459,260 | 1,040,040 | 1,832,190 | 0 |
| AL | 3,526 | 2,095 | 1,431 | 814,370 | 302,400 | 202,920 | 0 | 309,050 |
| MA | 3,454 | 3,454 | 0 | 1,106,630 | 1,106,630 | 0 | 0 | 0 |
| SD | 971 | 101 | 870 | 45,950 | 7,860 | 38,090 | 0 | 0 |
| NM | 687 | 0 | 687 | 179,940 | 0 | 179,940 | 0 | 0 |
| OK | 556 | 95 | 461 | 167,620 | 43,250 | 124,370 | 0 | 0 |
| NH | 92 | 0 | 92 | 70,220 | 0 | 70,220 | 0 | 0 |
| NE | 38 | 16 | 22 | 7,220 | 710 | 6,510 | 0 | 0 |
| IL | 20 | 0 | 0 | 12,560 | 0 | 0 | 0 | 0 |
| AR | 12 | 0 | 12 | 1,000 | 0 | 1,000 | 0 | 0 |
| Numbers include ads aired on broadcast television between May 11, 2020, and June 28, 2020. Spending by formal party organizations is reflected in the airing and spending totals (as are any ads from third party candidates) but is not separated out in columns in this table. CITE SOURCE OF DATA AS: Kantar/CMAG with analysis by the Wesleyan Media Project. |
||||||||
Table 6 shows ad spenders in Senate races by state. Since May 10 Amy McGrath in Kentucky has aired the most ads, followed by Theresa Greenfield in Iowa, who won the Democratic primary and will square off against Joni Ernst. The state of Georgia has two Senate races this cycle, and number three on the list was Jon Ossoff, who won the Democratic primary on June 9 and will square off against incumbent David Perdue.
Table 6: Airings and Spending by Sponsor in U.S. Senate Races
| Sponsor | State | Party Lean | Airings | Spend ($) |
|---|---|---|---|---|
| McGrath, Amy | KY | Dem | 15,049 | 3,611,090 |
| Greenfield, Theresa | IA | Dem | 7,849 | 1,317,200 |
| Ossoff, Jon | GA | Dem | 6,841 | 1,253,670 |
| Daines, Steve | MT | Rep | 6,677 | 517,440 |
| Loeffler, Kelly | GA | Rep | 6,651 | 1,685,140 |
| Harrison, Jaime | SC | Dem | 6,158 | 2,454,090 |
| McConnell, Mitch | KY | Rep | 5,460 | 1,091,310 |
| Gideon, Sara | ME | Dem | 5,284 | 1,287,830 |
| Kelly, Mark | AZ | Dem | 4,583 | 1,689,230 |
| Hickenlooper, John | CO | Dem | 4,466 | 1,603,280 |
| McSally, Martha | AZ | Rep | 4,441 | 1,559,670 |
| Hagerty, Bill | TN | Rep | 4,193 | 765,340 |
| Booker, Charles | KY | Dem | 3,812 | 749,560 |
| Women Vote | IA | Dem | 3,745 | 1,697,140 |
| Kennedy, Joe | MA | Dem | 3,454 | 1,106,630 |
| Senate Majority Pac | IA | Dem | 3,406 | 1,422,020 |
| James, John | MI | Rep | 3,365 | 1,692,270 |
| Hamilton, Bob | KS | Rep | 3,277 | 739,840 |
| Sethi, Manny | TN | Rep | 3,000 | 638,080 |
| Majority Forward | AZ | Dem | 2,936 | 1,459,120 |
| Collins, Susan | ME | Rep | 2,849 | 634,340 |
| Peters, Gary & Democratic Senatorial Campaign Committee | MI | Dem | 2,587 | 871,350 |
| Majority Forward | MT | Dem | 2,569 | 931,500 |
| Tillis, Thom | NC | Rep | 2,505 | 1,040,040 |
| Senate Majority Pac | ME | Dem | 2,482 | 1,385,890 |
| Senate Majority Pac | CO | Dem | 2,467 | 1,969,360 |
| End Citizens United | ME | Dem | 2,377 | 1,349,650 |
| National Republican Senatorial Committee (Nrsc) | IA | Rep | 2,327 | 1,157,140 |
| National Republican Senatorial Committee (Nrsc) | MI | Rep | 2,304 | 2,038,590 |
| Marshall, Roger | KS | Rep | 2,185 | 345,470 |
| National Republican Senatorial Committee (Nrsc) | ME | Rep | 2,161 | 1,752,100 |
| Bullock, Steve | MT | Dem | 2,103 | 225,880 |
| Jones, Doug | AL | Dem | 2,095 | 302,400 |
| National Republican Senatorial Committee (Nrsc) | AZ | Rep | 2,014 | 1,025,780 |
| Nrdc Action Fund | NC | Dem | 1,729 | 721,700 |
| One Nation | AZ | Rep | 1,663 | 961,370 |
| Gardner, Cory | CO | Rep | 1,654 | 715,090 |
| Mauro, Eddie | IA | Dem | 1,541 | 211,010 |
| Majority Forward | NC | Dem | 1,492 | 1,067,880 |
| Franken, Michael | IA | Dem | 1,475 | 151,620 |
| Romanoff, Andrew | CO | Dem | 1,326 | 602,840 |
| 1820 Pac | ME | Rep | 1,294 | 782,520 |
| Senate Majority Pac | MI | Dem | 1,186 | 1,079,030 |
| Bollier, Barbara | KS | Dem | 1,158 | 225,640 |
| Let'S Turn Colorado Blue | CO | Dem | 1,080 | 910,010 |
| National Republican Senatorial Committee (Nrsc) | CO | Rep | 1,049 | 708,090 |
| Graham, Lindsey | SC | Rep | 1,042 | 230,750 |
| Advancing Az | AZ | Dem | 892 | 429,730 |
| Club For Growth Action | KS | Rep | 884 | 172,470 |
| Afscme | MI | Dem | 876 | 693,830 |
| Senate Majority Pac | MT | Dem | 875 | 303,870 |
| Rounds, Mike | SD | Rep | 870 | 38,090 |
| Cunningham, Cal | NC | Dem | 869 | 459,260 |
| Flinn, George | TN | Rep | 758 | 200,370 |
| Club For Growth Action | AL | Rep | 735 | 309,050 |
| Tuberville, Tommy | AL | Rep | 696 | 202,920 |
| Tomlinson, Teresa | GA | Dem | 695 | 365,170 |
| One Nation | MT | Rep | 662 | 268,120 |
| Broihier, Mike | KY | Dem | 630 | 142,730 |
| U.S. Chamber Of Commerce | ME | Rep | 581 | 393,680 |
| Ronchetti, Mark | NM | Rep | 579 | 142,880 |
| One Nation | ME | Rep | 570 | 607,510 |
| One Nation | IA | Rep | 559 | 252,650 |
| Riggs-Amico, Sarah | GA | Dem | 545 | 531,030 |
| Lcv Victory Fund | AZ | Dem | 505 | 237,590 |
| Inhofe, James | OK | Rep | 461 | 124,370 |
| Montana Federation Of Public Employees | MT | Dem | 420 | 145,150 |
| Ditch Fund | KY | Dem | 337 | 156,700 |
| Taxpayers Protection Alliance | AZ | Rep | 315 | 242,440 |
| U.S. Chamber Of Commerce | CO | Rep | 276 | 277,750 |
| Tax March | ME | Dem | 245 | 160,580 |
| The Lincoln Project | KY | Dem | 167 | 169,100 |
| Better Future Mi Fund | MI | Rep | 153 | 236,150 |
| Wagle, Susan | KS | Rep | 149 | 21,700 |
| The Lincoln Project | MT | Dem | 133 | 58,670 |
| The Lincoln Project | IA | Dem | 113 | 70,970 |
| Martinez, Elisa | NM | Rep | 108 | 37,060 |
| Ahlers, Dan | SD | Dem | 101 | 7,860 |
| Broyles, Abby | OK | Dem | 95 | 43,250 |
| The Lincoln Project | NC | Dem | 93 | 42,610 |
| Messner, Corky | NH | Rep | 92 | 70,220 |
| Undivided Purpose | GA | Dem | 91 | 81,760 |
| Kobach, Kris | KS | Rep | 90 | 13,390 |
| Lapierre, Michael | SC | Rep | 78 | 8,730 |
| Peters, Gary | MI | Dem | 69 | 98,890 |
| Edf Action Votes | MI | Dem | 45 | 16,190 |
| Lcv Victory Fund | MI | Dem | 36 | 18,540 |
| Colorados Working Families Org | CO | Dem | 25 | 33,930 |
| Maine Momentum | ME | Dem | 22 | 12,610 |
| Nrdc Action Votes | MI | Dem | 22 | 33,670 |
| Sasse, Ben | NE | Rep | 22 | 6,510 |
| Wilson, Willie | IL | Other | 20 | 12,560 |
| Shelton, Alisha | NE | Dem | 16 | 710 |
| Pickrell, Mark | TN | Dem | 14 | 2,920 |
| Cotton, Tom | AR | Rep | 12 | 1,000 |
| Let America Vote Pac | KY | Dem | 5 | 47,320 |
| Bush, Byron | TN | Rep | 3 | 1,720 |
| Numbers include ads aired on broadcast television between May 11, 2020, and June 28, 2020. CITE SOURCE OF DATA AS: Kantar/CMAG with analysis by the Wesleyan Media Project. |
||||
The top group advertiser in in the table is Women Vote, which has waded into the Iowa Senate race. We combine group spending in Senate races and show those totals in Table 7. Senate Majority PAC tops the list with over 10,000 ads in five Senate races, followed by Majority Forward with 7,000 ads in three states. Seven of the top 10 groups are airing ads in favor of Democrats.
Disclosure classifications by the Center for Responsive Politics (CRP) reveal that several of the top spending groups do not disclose all of their donors. The CRP classifies groups as full-disclosure groups (meaning they disclose contributor lists to the Federal Election Commission), non-disclosing dark money groups (which are not required to disclose publicly their donors; these are most often 501c4 non-profits), and partial-disclosure groups (those that disclose donors but also accept contributions from dark money sources). Of the group spending in Senate races between May 11 and June 28, 33 percent of the ads aired came from fully disclosing groups; non-disclosing groups sponsored 38 percent; and 29 percent were sponsored by partial disclosing groups. (Almost all of that latter total are from Senate Majority PAC.)
“Secrecy remains the order of the day for politically-active nonprofits, super PACs, and other political groups hoping to shape voter sentiment while shielding their own funding sources from view,” said Sheila Krumholz, executive director of the Center for Responsive Politics.
Table 7: Airings and Spending by Group in U.S. Senate Races
| Sponsor | Pty Lean | Type | Disclose | Total Spend ($) | Airings | Races |
|---|---|---|---|---|---|---|
| Senate Majority PAC | Dem | SuperPAC | P | 6,160,170 | 10,416 | CO, IA, ME, MI, MT |
| Majority Forward | Dem | 501c4 | N | 3,458,500 | 6,997 | AZ, MT, NC |
| Women Vote | Dem | SuperPAC | Y | 1,697,140 | 3,745 | IA |
| One Nation | Rep | 501c4 | N | 2,089,650 | 3,454 | AZ, IA, ME, MT |
| End Citizens United | Dem | PAC | Y | 1,349,650 | 2,377 | ME |
| NRDC Action Fund | Dem | 501c4 | N | 721,700 | 1,729 | NC |
| Club For Growth Action | Rep | SuperPAC | Y | 481,520 | 1,619 | AL, KS |
| 1820 PAC | Rep | SuperPAC | Y | 782,520 | 1,294 | ME |
| Let's Turn Colorado Blue | Dem | SuperPAC | Y | 910,010 | 1,080 | CO |
| Advancing AZ | Dem | 501c4 | N | 429,730 | 892 | AZ |
| AFSCME | Dem | 501c5 | Y | 693,830 | 876 | MI |
| U.S. Chamber Of Commerce | Rep | 501c4 | N | 671,430 | 857 | CO, ME |
| LCV Victory Fund | Dem | SuperPAC | P | 256,130 | 541 | AZ, MI |
| The Lincoln Project | Dem | SuperPAC | Y | 341,350 | 506 | IA, KY, MT, NC |
| Montana Federation Of Public Employees | Dem | 501c5 | Y | 145,150 | 420 | MT |
| Ditch Fund | Dem | Carey | Y | 156,700 | 337 | KY |
| Taxpayers Protection Alliance | Rep | 501c4 | N | 242,440 | 315 | AZ |
| Tax March | Dem | 501c4 | N | 160,580 | 245 | ME |
| Better Future MI Fund | Rep | SuperPAC | Y | 236,150 | 153 | MI |
| Undivided Purpose | Dem | SuperPAC | Y | 81,760 | 91 | GA |
| EDF Action Votes | Dem | SuperPAC | P | 16,190 | 45 | MI |
| Colorados Working Families Org | Dem | SuperPAC | Y | 33,930 | 25 | CO |
| Maine Momentum | Dem | 501c4 | N | 12,610 | 22 | ME |
| NRDC Action Votes | Dem | PAC | Y | 33,670 | 22 | MI |
| Let America Vote PAC | Dem | PAC | Y | 47,320 | 5 | KY |
| Numbers include ads aired on broadcast television between May 11, 2020, and June 28, 2020. In the disclosing column, “Y” indicates full disclosure, “P” indicates partial disclosure and “N” indicates no disclosure. CITE SOURCE OF DATA AS: Kantar/CMAG with analysis by the Wesleyan Media Project. Group classification provided by the Center for Responsive Politics. |
||||||
All told, cycle-to-date outside groups have aired 41 percent of all ads in Senate races. This compares to 29 percent of ads relevant to House races and just 7 percent of ads in the presidential race.
Harrison and Kentucky Dem Contenders Spend Big on Digital
Three senate candidates have spent more than a million dollars on Facebook and Google advertising between May 10 and June 27, 2020 (see Table 8). South Carolina Democratic candidate Jaime Harrison leads the pack with over $1.7 million ($1.4 million of which was on Facebook) followed by the two Democratic contenders in Kentucky, Amy McGrath (nearly $1.4 million) and Charles Booker (nearly $1.1 million). Senate Majority Leader Mitch McConnell ranks fourth overall during the same time period at just over $800,000.
“Booker in Kentucky saw a late surge in interest in his campaign, and he almost won the primary,” said Travis Ridout, co-director of the Wesleyan Media Project. “He lagged far behind McGrath in TV spots but was very competitive on the digital side.”
Table 8: Facebook and Google Spending by Senate Candidates
| State | Party | Sponsor | Fb (since May 9) | Google (since May 9) | Fb + Google (since May 9) |
|
|---|---|---|---|---|---|---|
| AK | IND | Gross, Al Dr. | 2,110 | 1,600 | 3,710 | |
| AK | REP | Sullivan, Dan | 7,137 | 628,400 | 635,537 | |
| AL | DEM | Jones, Doug | 41,091 | 2,800 | 43,891 | |
| AL | REP | Sessions, Jefferson B | 917 | 0 | 917 | |
| AL | REP | Tuberville, Thomas H | 38,566 | 1,300 | 39,866 | |
| AR | REP | Cotton, Thomas | 12,927 | 1,800 | 14,727 | |
| AR | IND | Whitfield, Daniel Allen | 243 | 0 | 243 | |
| AZ | DEM | Kelly, Mark | 576,577 | 234,900 | 811,477 | |
| AZ | REP | McCarthy, Daniel | 2286 | 0 | 2,286 | |
| AZ | REP | McSally, Martha | 227,106 | 138,500 | 365,606 | |
| CA | DEM | Harris, Kamala D | 0 | 6,100 | 6,100 | |
| CO | REP | Gardner, Cory | 62,438 | 13,200 | 75,638 | |
| CO | DEM | Hickenlooper, John W. | 241,580 | 197,600 | 439,180 | |
| CO | DEM | Romanoff, Andrew | 17,234 | 0 | 17,234 | |
| DE | DEM | Coons, Christopher A. | 15,694 | 3,100 | 18,794 | |
| DE | DEM | Scarane, Jessica | 446 | 0 | 446 | |
| DE | REP | Witzke, Lauren Elena | 81 | 0 | 81 | |
| GA | REP | Collins, Douglas Allen | 69,338 | 0 | 69,338 | |
| GA | DEM | Dejesus, Marckeith | 49 | 0 | 49 | |
| GA | REP | Grayson, Derrick E Rev | 104 | 0 | 104 | |
| GA | REP | Johnson, Arthur Wayne | 1,026 | 0 | 1,026 | |
| GA | DEM | Johnson-Shealey, Tamara | 295 | 0 | 295 | |
| GA | DEM | Lieberman, Matthew | 22,274 | 0 | 22,274 | |
| GA | REP | Loeffler, Kelly | 76,288 | 30,500 | 106,788 | |
| GA | DEM | Ossoff, T. Jonathan | 286,736 | 25,200 | 31,1936 | |
| GA | REP | Perdue, David | 23,088 | 0 | 23,088 | |
| GA | DEM | Riggs Amico, Sarah | 307 | 0 | 307 | |
| GA | DEM | Tarver, Edward J. | 3,958 | 0 | 3,958 | |
| GA | DEM | Tomlinson, Teresa Pike | 1,870 | 900 | 2,770 | |
| GA | DEM | Warnock, Raphael | 281,090 | 17,300 | 298,390 | |
| GA | DEM | Winfield, Richard Dien | 40 | 0 | 40 | |
| IA | REP | Ernst, Joni K | 163,189 | 6,800 | 169,989 | |
| IA | DEM | Franken, Michael | 32,178 | 0 | 32,178 | |
| IA | DEM | Greenfield, Theresa | 69,785 | 150,300 | 220,085 | |
| IA | DEM | Mauro, Eddie J | 26,498 | 10,700 | 37,198 | |
| IL | REP | Curran, Mark | 3,522 | 0 | 3,522 | |
| IL | DEM | Durbin, Richard J | 1,353 | 1,500 | 2,853 | |
| IL | LIB | Malouf, Danny | 478 | 0 | 478 | |
| KS | DEM | Bollier, Barbara | 33,214 | 50,600 | 83,814 | |
| KS | REP | Kobach, Kris | 250 | 0 | 250 | |
| KS | REP | Laturner, Jake | 8,208 | 0 | 8,208 | |
| KS | REP | Lindstrom, David Alan | 14,397 | 0 | 14,397 | |
| KS | REP | Marshall, Roger W | 15,461 | 0 | 15,461 | |
| KS | DEM | Reddi, Usha | 50 | 0 | 50 | |
| KY | DEM | Booker, Charles | 964,253 | 116,100 | 1,080,353 | |
| KY | DEM | Broihier, Michael George | 35,974 | 0 | 35,974 | |
| KY | REP | McConnell, Mitch | 446,265 | 385,400 | 831,665 | |
| KY | DEM | McGrath, Amy | 619,133 | 764,200 | 1,383,333 | |
| KY | DEM | Rothmuller, Eric | 800 | 0 | 800 | |
| KY | DEM | Save America Fund | pro-McGrath | 45,925 | 0 | 45,925 |
| LA | DEM | Pierce, Antoine | 422 | 0 | 422 | |
| MA | DEM | Kennedy, Joseph P Iii | 17,312 | 6,400 | 23,712 | |
| MA | DEM | Markey, Edward J. Sen. | 18,076 | 14,200 | 32,276 | |
| MA | REP | O'Connor, Kevin J | 75 | 0 | 75 | |
| ME | REP | 1820 Pac | pro-Collins | 7,650 | 11,400 | 19,050 |
| ME | REP | Collins, Susan M. | 126,957 | 11,700 | 138,657 | |
| ME | DEM | Gideon, Sara | 313,152 | 122,300 | 435,452 | |
| ME | UNK | Savage, Lisa Jill | 20 | 0 | 20 | |
| ME | DEM | Sweet, Betsy | 6,063 | 0 | 6,063 | |
| MI | REP | Better Future Michigan Fund | pro-James | 28,013 | 0 | 28,013 |
| MI | REP | James, John | 36,640 | 14,500 | 51,140 | |
| MI | DEM | Peters, Gary | 68,515 | 32,100 | 100,615 | |
| MN | REP | Barrett, Robert Paul Mr Jr. | 2,102 | 0 | 2,102 | |
| MN | REP | Lewis, Jason | 68,136 | 2,800 | 70,936 | |
| MN | DEM | Smith, Tina | 13,727 | 1,000 | 14,727 | |
| MS | DEM | Espy, Michael | 13,287 | 5,100 | 18,387 | |
| MT | DEM | Bullock, Steve | 128,698 | 0 | 128,698 | |
| MT | REP | Daines, Steve | 504,985 | 264,500 | 769,485 | |
| MT | DEM | Mues, John | 5,668 | 0 | 5,668 | |
| NC | DEM | Cunningham, Cal | 84,709 | 0 | 84,709 | |
| NC | REP | Smith, Sandy | 2,557 | 0 | 2,557 | |
| NC | REP | Tillis, Thom R. Sen. | 9,744 | 66,800 | 76,544 | |
| NE | DEM | Janicek, Chris Edward Mr | 3,312 | 0 | 3,312 | |
| NE | DEM | Macek, Dennis Frank | 233 | 0 | 233 | |
| NE | REP | Sasse, Benjamin E | 2,742 | 2,300 | 5,042 | |
| NE | DEM | Shelton, Alisha | 21 | 0 | 21 | |
| NH | REP | Bolduc, Donald C. | 1,355 | 0 | 1,355 | |
| NH | REP | Messner, Bryant 'Corky' S. | 10,819 | 2,900 | 13,719 | |
| NH | DEM | Shaheen, Jeanne | 1,331 | 3,100 | 4,431 | |
| NJ | DEM | Booker, Cory | 33,346 | 1,500 | 34,846 | |
| NJ | IND | Burke, Daniel C. Mr. | 100 | 0 | 100 | |
| NJ | IND | Fernandez, Veronica | 1,130 | 0 | 1,130 | |
| NJ | DEM | Hamm, Lawrence Mr. | 3,228 | 0 | 3,228 | |
| NJ | REP | Mehta, Rikin | 1,518 | 0 | 1,518 | |
| NJ | REP | Singh, Hirsh V | 8,203 | 0 | 8,203 | |
| NM | REP | Clarkson, Gavin | 131 | 0 | 131 | |
| NM | DEM | Lujan, Ben Ray | 8,732 | 0 | 8,732 | |
| NM | REP | Martinez, Elisa | 5,000 | 0 | 5,000 | |
| NM | REP | Ronchetti, Mark V. | 3,601 | 0 | 3601 | |
| NY | DEM | Gillibrand, Kirsten | 18,555 | 0 | 18,555 | |
| OK | DEM | Britt, Elysabeth | 327 | 0 | 327 | |
| OK | DEM | Broyles, Abby | 45,194 | 0 | 45,194 | |
| OK | REP | Inhofe, James M. Sen. | 4,542 | 0 | 4542 | |
| OK | REP | Stitt, Jj Mr. | 605 | 0 | 605 | |
| OR | DEM | Merkley, Jeffrey Alan | 33,854 | 0 | 33,854 | |
| RI | REP | Waters, Allen | 569 | 0 | 569 | |
| SC | REP | Buckner, Dwayne Duke | 256 | 0 | 256 | |
| SC | REP | Graham, Lindsey O. | 475,062 | 116,600 | 591,662 | |
| SC | DEM | Harrison, Jaime | 1,428,481 | 325,700 | 1,754,181 | |
| SC | REP | Lapierre, Michael James | 13,407 | 0 | 13,407 | |
| SC | REP | Reynolds, Joseph | 5,280 | 0 | 5,280 | |
| SD | DEM | Ahlers, Dan | 330 | 0 | 330 | |
| SD | REP | Borglum, Scyller | 1,433 | 0 | 1,433 | |
| SD | REP | Rounds, Mike | 5,520 | 0 | 5,520 | |
| TN | REP | Bush, Byron | 20 | 0 | 20 | |
| TN | REP | Cope, Roy Dale | 263 | 0 | 263 | |
| TN | REP | Flinn, George S Dr Jr | 6,344 | 0 | 6344 | |
| TN | REP | Hagerty, Bill | 30,808 | 15,600 | 46,408 | |
| TN | IND | Hill, Garland Dean Ii | 100 | 0 | 100 | |
| TN | DEM | Mackler, James | 0 | 2,200 | 2,200 | |
| TN | IND | McLeod, Elizabeth D | 64 | 0 | 64 | |
| TN | REP | Sethi, Dr. Manny | 16,850 | 0 | 16,850 | |
| TX | REP | Castro, John Anthony | 600 | 0 | 600 | |
| TX | REP | Cornyn, John Sen | 129,652 | 38,300 | 167,952 | |
| TX | DEM | Hegar, Mary Jennings Mj | 22,095 | 13,700 | 35,795 | |
| TX | REP | Stovall, Dwayne | 100 | 0 | 100 | |
| TX | DEM | West, Royce | 10,086 | 0 | 10,086 | |
| VA | REP | Baldwin, Alissa | 1,279 | 0 | 1,279 | |
| VA | REP | Gade, Daniel Macarthur Mr. | 5,810 | 600 | 6,410 | |
| VA | REP | Speciale, Thomas A Ii | 1,727 | 0 | 1,727 | |
| VA | DEM | Warner, Mark Robert | 26,547 | 200 | 26,747 | |
| WV | DEM | Swearengin, Paula Jean | 22,474 | 0 | 22,474 | |
| WV | REP | Whitt, Larry Allen Ii | 1,900 | 0 | 1,900 | |
| WY | DEM | Ben David, Merav | 332 | 0 | 332 | |
| WY | REP | Lummis, Cynthia Marie | 9,919 | 3,100 | 13,019 | |
| WY | REP | Miller, Bryan | 29 | 0 | 29 | |
| WY | REP | Wheeler, Joshua B | 255 | 0 | 255 | |
| Numbers include spending between May 10, 2020 and June 27, 2020 for Facebook and Google. Spenders include 2020 U.S. Senate candidates, leadership PACs, and single-candidate super PACs in support of (or in opposition to) those candidates. Single-candidate super PAC identifications are from the Center for Responsive Politics. Classifications of Senate candidates from the Wesleyan Media Project with help from the Center for Responsive Politics. See “About the Data” section at the end of this report for more information on our methodology. |
||||||
Deep Dive: Quantifying Mentions of Presidential and Senatorial Candidates on Facebook
The Wesleyan Media Project’s student-driven Delta Lab has been tracking references to presidential and senatorial candidates on Facebook advertising, and Table 9 provides a deep dive into the 188 unique page names that have spent approximately $25,000 or more on ads that explicitly mentioned any of the 2020 presidential or senatorial candidates between May 10 and June 27, 2020. Mentions are defined by keyword matches of candidate names within each ad’s associated page name, funding entity and/or creative body text (video and audio data are currently excluded). Candidate pages are included in these tables (and can be filtered in or out via the last column), but self-references by known candidate pages are excluded in the mention counts and mention spending estimates.
As shown in Table 9, there are 18 page names that have spent $500,000 or more on ads referencing candidates for president or U.S. Senate, only 11 of which are known candidate pages. Facebook pages Senate Democrats (DSCC), Stop Republicans and the Democratic Governors Association (DGA) have all spent more than a million dollars on ads referencing presidential and senatorial candidates.
Table 9: Facebook Pages Mentioning Candidates for President & Senate in 2020
Click here to view the table in a new tab (with larger text)
Facebook page names spending approximately $25,000 or more on advertising that mentions 2020 presidential or senatorial candidates (excluding candidate self-references) between May 10 and June 27, 2020. This interactive table is part of an ongoing, work-in-progress project from WMP’s student-driven Delta Lab.
Data table by Conner Sexton ’20 and Kevin McMorrow ’20
Table 10 presents the same set of pages from Table 9 but aggregates the proportion of and spending on ads mentioning candidates by the major party affiliation of the candidate mention. The columns “Democrats” and “Republicans” contain the proportion of ads mentioning candidates from the respective parties out of the total number of ads mentioning a candidate at all. The last two columns contain the approximate spend on ads that mention Democratic candidates or Republican candidates. For example, Trump’s campaign has spent nearly $1 million dollars on advertising on Mike Pence’s Facebook page and another half million on the Team Trump Facebook page on advertising that mentions Joe Biden. Excluding self-references to Trump (the Team Trump page would include a match to Trump by definition), Biden was the only candidate mentioned in those ads, and therefore 100% of the advertising is of Democratic candidates.
As shown in Table 10, excluding candidate pages, the top spenders on ads mentioning Republican candidates are Senate Democrats (the DSCC page), Stop Republicans, and The Lincoln Project.
Table 10: Dynamic Dive into Facebook Pages Spending By Party
Click here to view the table in a new tab (with larger text)
Facebook page names spending approximately $25,000 or more on advertising that mentions 2020 presidential or senatorial candidates (excluding candidate self-references) between May 10 and June 27, 2020. This interactive table is part of an ongoing, work-in-progress project from WMP’s student-driven Delta Lab.
Data table by Conner Sexton ’20 and Kevin McMorrow ’20
Aggregating across all pages known to be associated with the two presidential campaigns themselves (Table 11), and among ads where Trump mentions Biden or any 2020 senatorial candidates, over a quarter of these ads explicitly mention Biden in some way. In contrast, in advertising by the Biden campaign (aggregating over three unique page IDs) that references Trump or any 2020 senatorial candidates, 72 percent of them mention Donald Trump.
Table 11: Presidential Campaign Mentions
Click here to view the table in a new tab (with larger text)
Data in this table are aggregated across all the Facebook pages names known to be associated with each of the presidential campaigns between May 10 and June 27, 2020. This interactive table is part of an ongoing, work-in-progress project from WMP’s student-driven Delta Lab.
Data table by Conner Sexton ’20 and Kevin McMorrow ’20
U.S. Senate and U.S. House Ad Volumes Way Up Over Prior Cycles
We show ad volume totals by week in the next three figures, one each for the presidential, Senate, and House context. Figure 1 speaks to the presidential race. The early 2020 spike in presidential ads is largely the efforts of Mike Bloomberg, before ad volumes dropped to near 0 for most weeks of April. Since the start of May, ad totals have accelerated but at a lower rate than the comparable period in 2016.
Figure 1: Presidential Race Ads by Week and Year
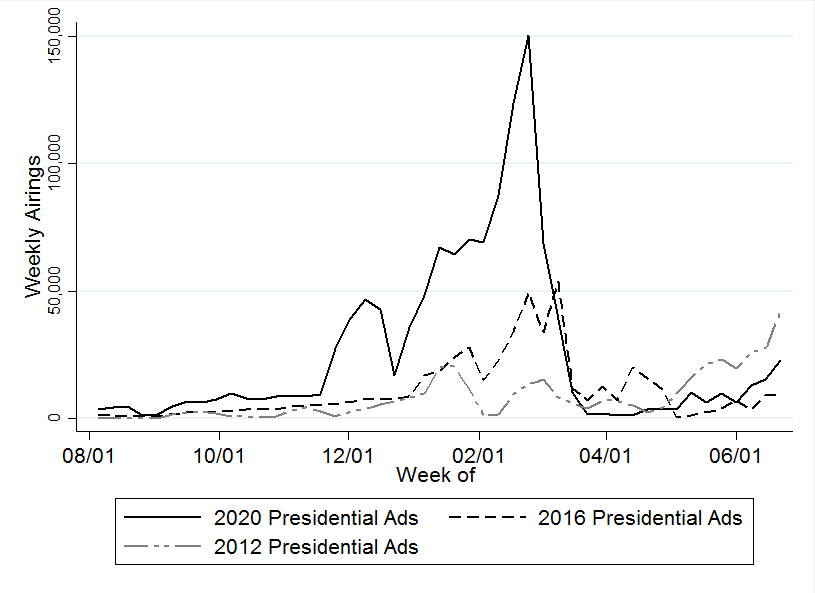
CITE SOURCE OF DATA AS: Kantar/CMAG with analysis by the Wesleyan Media Project.
Senate totals by week are shown in Figure 2, and the historic volumes this cycle are apparent, most especially in the period we look at in this release. Ad totals in Senate races are far higher in 2020 than in the previous two presidential cycles.
Figure 2: U.S. Senate Race Ads by Week and Year
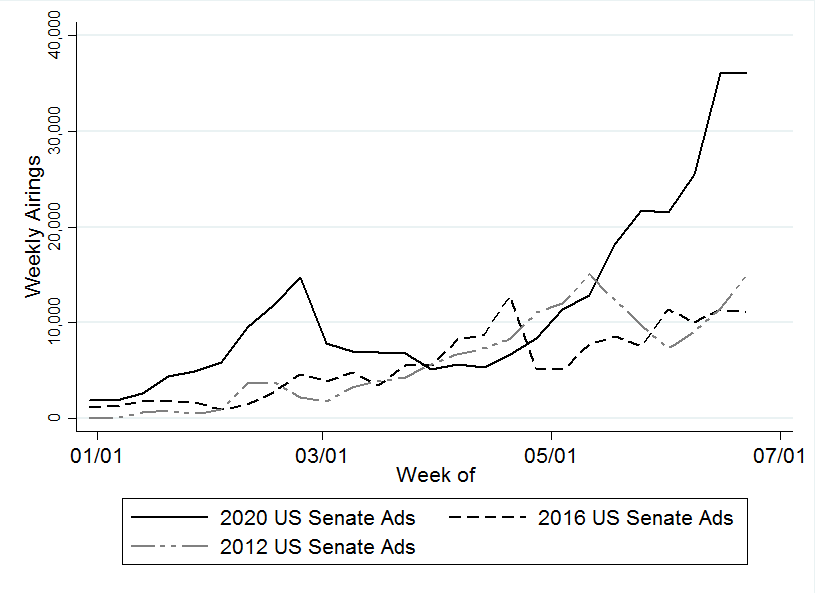
between January 1 of the election year and June 28.
CITE SOURCE OF DATA AS: Kantar/CMAG with analysis by the Wesleyan Media Project.
Finally, the totals for House races are shown in Figure 3. Here, too, totals exceed the 2012 and 2016 campaigns, but there were roughly similar ad totals in those years in the comparable period between mid-March and early June. In the last few weeks, however, ad volumes in House races have accelerated to far more than in 2012 and 2016.
Figure 3: U.S. House Race Ads by Week and Year
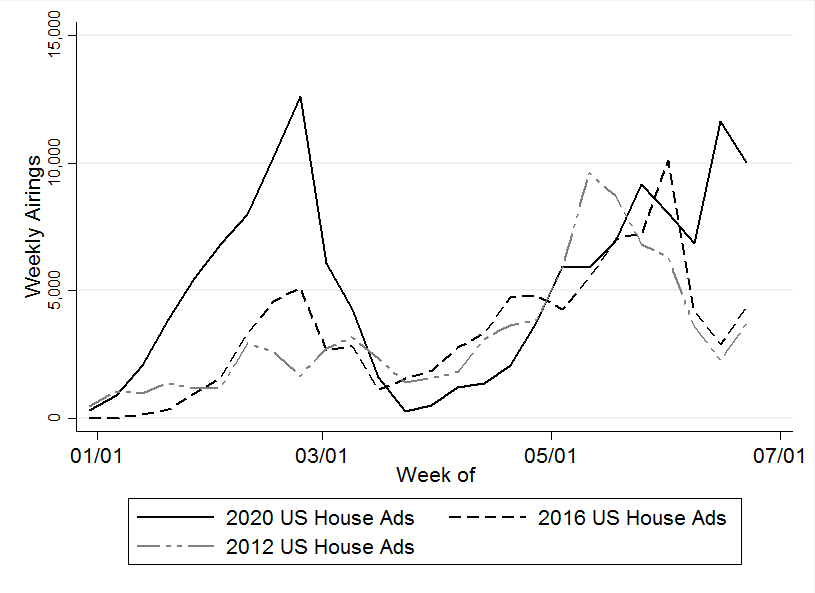
between January 1 of the election year and June 28.
CITE SOURCE OF DATA AS: Kantar/CMAG with analysis by the Wesleyan Media Project.
About the Data
For the television ad totals, data reported here are from Kantar/CMAG and do not cover local cable buys, only broadcast television, national network and national cable advertising.
For Facebook ads, data come from the aggregate reports. We looked for pages attached to each candidate, including possible leadership PACs, joint-fund-raising committees, and, in the case of presidential candidates, affiliated Senate/House pages. Aggregate report entries are provided for each page name and disclaimer combination. Totals for most of this report on spending between May 10, 2020 and June 27, 2020 are calculated by subtracting the reported cumulative spending (as reported by Facebook as the total spent since May 2018) for the June 27, 2020 report and subtracting off the cumulative spending reported for May 9, 2020.
In Tables 9, 10, and 11, the Total Spend and Total Ads figures may differ from the totals reported elsewhere in this report because our Delta Lab team sums up the daily aggregate reports by page name rather than using the calculation described above to subtract the cumulative files, and there are known discrepancies between the two reporting forms. For more, see the following Delta Lab post. The columns Approximate Spend on Mentions and Number of Ads Mentioning candidates are calculated for each entity by averaging the bounds of ads that mention candidates and averaging the bounds of all ads from that entity, then dividing the two to get the proportion of spend (or ads) that mention candidates. We then multiply that proportion by Facebook’s totals from the daily reports to arrive at the Approximate Spend on Mentions and the Number of Ads Mentioning candidates.
Calculating cycle-to-date Facebook totals is more challenging than looking at totals from the last couple of months. In early January 2019, Facebook did not include page IDs (a unique identifier) for each entry in the aggregate report. Because pages can have the same name, a unique identifier for each page would be required to definitively identify an aggregate report entry, which Facebook does not provide going backward. Therefore, we did our best to associate each entry in the January 5, 2019, report with a page ID, which we had access to through the library API. There may be some slippage if two pages associated with candidates had identical names and disclaimers, but we believe these instances are rare for the set of ads covered in this report. For cycle-to-date spending, we subtracted the January 5, 2019 total from the June 27, 2020 total to get the spending by page and disclaimer for January 6, 2019 through June 27, 2020.
Pages can sponsor ads that are funded by different entities. We made the assumption that all spending by federal office-holders running for president this cycle (e.g., Cory Booker) was in support of their presidential campaign up until they date they dropped out of the presidential race (if applicable), even if some spending was reported from their House or Senate page or leadership PAC, especially because many of the leadership PAC spending occurred on the same pages as the campaign spending. Advertisements run by pages known to be associated with presidential candidates are included even in instances where the ads ran without an appropriate disclaimer.
In Table A (click here to download), we list the page names/disclaimer rows from the Facebook aggregate reports that we identified for this report. It is possible that we missed some spending from a Facebook page affiliated with a candidate running for office. This is exacerbated by the absence of EIN or FEC identifiers in the Facebook reports.
For Google ads, we downloaded the weekly reports from the platform’s Transparency Report. As a matter of practice with all of the platform data, we try to replicate our prior spending figures when we are calculating numbers for a new release. In that process, we discovered discrepancies between the data we downloaded in November and the information available in the December download for the same dates, which persists in May. Based on conversations with Google, we believe the discrepancies are partially but not exclusively due to the addition of advertisers targeting state-level races. We are working on a process to report these discrepancies, but the totals reflected in this release are current as of 6/30/20, the day on which we pulled the transparency report. Table B (linked to below) reports these discrepancies as they relate to our previous press release. Google only includes spending in federal and state races and only includes weekly totals but lists the sponsor’s EIN or FEC committee ID. We searched the list of advertisers for presidential candidates and affiliated leadership PACs and joint-fund-raising committees, and candidates for U.S Senate and affiliated single-candidate super PACs. We made the same assumption as with the Facebook data about any spending from House and Senate campaign committees by declared presidential candidates. Google spending is from 1/6/19 through 6/27/20 or 5/10/20 through 6/27/20.
In Table B (click here to download), we list the advertiser name for all entities used in this report to calculate Google spending totals.
About This Report
The Wesleyan Media Project (WMP) provides real-time tracking and analysis of political advertising in an effort to increase transparency in elections. Housed in Wesleyan’s Quantitative Analysis Center (QAC) – part of the Allbritton Center for the Study of Public Life – the Wesleyan Media Project is the successor to the Wisconsin Advertising Project, which disbanded in 2009. It is directed by Erika Franklin Fowler, associate professor of government at Wesleyan University, Michael M. Franz, professor of government at Bowdoin College and Travis N. Ridout, professor of political science at Washington State University. WMP personnel include Laura Baum (Project Manager), Colleen Bogucki (Project Coordinator), Pavel Oleinikov (Associate Director, QAC), Markus Neumann (Post-Doctoral Fellow), and Courtney Page-Tan (Post-Doctoral Fellow).
The Wesleyan Media Project’s digital advertising tracking is supported by the contributions of students in Delta Lab, an interdisciplinary research collaborative focusing on computationally-driven and innovative analyses and visualizations of media messaging.
The Wesleyan Media Project is supported by Wesleyan University, the John S. and James L. Knight Foundation, and the Democracy Fund. WMP is partnering again this year with the Center for Responsive Politics, to provide added information on outside group disclosure.
Periodic releases of data will be posted on the project’s website and dispersed via Twitter @wesmediaproject. To be added to our email update list, click here.
For more information contact:
Lauren Rubenstein, lrubenstein@wesleyan.edu,
(860) 685-3813 or (203) 644-7144
About Wesleyan University
Wesleyan University, in Middletown, Conn., is known for the excellence of its academic and co-curricular programs. With more than 2,900 undergraduates and 200 graduate students, Wesleyan is dedicated to providing a liberal arts education characterized by boldness, rigor and practical idealism. For more, visit wesleyan.edu.
About the John S. and James L. Knight Foundation
Knight Foundation is a national foundation with strong local roots. We invest in journalism, in the arts, and in the success of cities where brothers John S. and James L. Knight once published newspapers. Our goal is to foster informed and engaged communities, which we believe are essential for a healthy democracy.
About Democracy Fund
Created by eBay founder and philanthropist Pierre Omidyar, Democracy Fund is a foundation helping to ensure that our political system can withstand new challenges and deliver on its promise to the American people. Democracy Fund has invested more than $125 million in support of a healthy, resilient, and diverse democracy with a particular focus on modern elections, effective governance, and a vibrant public square.