
Democrats hold huge ad advantages in federal races;
Ad volume cycle-to-date up 60 percent over 2014
![]()
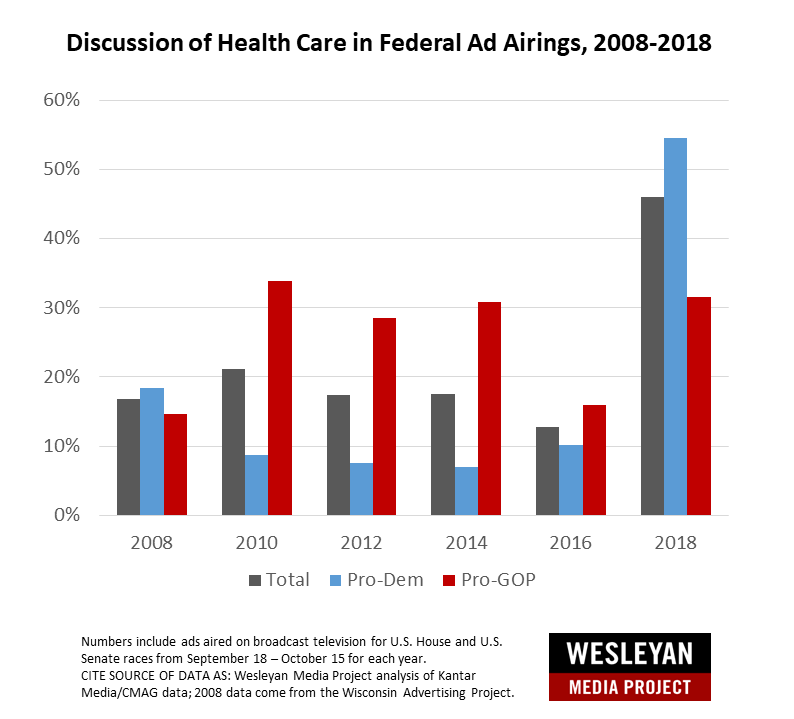
(MIDDLETOWN, CT) October 18, 2018 – It’s official: the 2018 midterms are about health care. In the period between September 18 and October 15, nearly half (45.9 percent) of airings in federal races mentioned the topic while nearly a third (30.2 percent) of gubernatorial airings did the same. Although both parties are mentioning health care, the topic is most prominent in ads supporting Democrats, appearing in 54.5 percent of pro-Democratic airings.
As shown in Figure 1, health care appeared in a third (33.9 percent) of all pro-Republican ads aired in federal races in 2010 (following passage of the Affordable Care Act), but the issue declined in prominence in the following election cycles (appearing in 28.4 percent of pro-Republican airings in 2012, in 20.8 percent in 2014 and in 16 percent in 2016). Mentions of health care in pro-Republican ads airing in federal races jumped in 2018, however, appearing in 31.5 percent of ad airings.
After the passage of the Affordable Care Act in 2010, pro-Democratic ads tended to avoid the issue of health care. It appeared in a mere 8.7 percent of ad airings in 2010, 7.6 percent in 2012, 7.0 percent in 2014, and 10 percent in 2016, a stark contrast to the 54.5 percent of pro-Democratic airings in 2018 that mentioned health care.
![]()
“After the Affordable Care Act passed, Democrats ran away from health care as a campaign talking point while Republicans used the issue as a central point of attack,” said Erika Franklin Fowler, co-director of the Wesleyan Media Project. “Unified Republican control of government has changed the calculus for both parties this cycle with Democrats going on offense and Republicans searching for new ways to talk about the issue.”
![]()
![]()
Figure 1: Discussion of Health Care in Federal Ad Airings, 2008-2018
![]()
Cycle-to-date, health care has been a consistent theme. It has appeared in 38 percent of all federal airings since January 1, 2017, as well as in 23 percent of all gubernatorial ads in the cycle through October 15.
![]()
Huge Advertising Advantages for Democrats in 2018
In races for the House and Senate, in the period between September 18 and October 15, Democrats posted huge ad advantages over Republicans. Table 1 shows the number of ads aired by candidates, parties, and outside groups in congressional and gubernatorial campaigns in the roughly one-month period since the middle of September. Democrats sponsored 208,000 ads in House races versus 128,000 from pro-Republican forces. Democrats aired 171,000 ads in Senate races compared to 118,000 in favor of Republicans.
Table 1 also shows that Democratic candidates out-advertised Republican candidates in House races by nearly 2-1. Democratic party committees, combining independent and coordinated spending, also out-advertised their Republican counterparts.
Pro-GOP groups were more active in House races than pro-Democratic groups, only somewhat dampening the candidate and party advantages for the Democrats. Pro-Democratic groups were more active than GOP groups in Senate campaigns.
![]()
“Democrats see an opening to take control of the House, and they are mobilizing heavily to win every possible seat,” said Michael Franz, co-director of the Wesleyan Media Project. “They also see an outside chance of winning the Senate, but are working hard to mitigate any losses in red states with Democratic incumbents.”
The Democratic advantage in advertising is not unique to 2018, as the bottom half of Table 1 shows. Democrats in the comparable time period in 2014 aired more ads in House and Senate races, though the advantages were much smaller.
The table also shows that partisan advantage is largely non-existent in gubernatorial campaigns. Democrats have a slight 3,000 spot advantage out of about 250,000 total ads aired. In 2014, Democrats were at a slight disadvantage in the number of ads aired during the same time period.
![]()
Table 1: Ad Totals in Congressional and Gubernatorial Campaigns (9/18 to 10/15)
| 2018 | Pro-Dem | Pro-GOP | Dem to GOP ratio |
|---|---|---|---|
| House | |||
| Candidate | 136,608 | 72,576 | |
| Party | 33,666 | 19,036 | |
| Coordinated | 17,594 | 4,049 | |
| Group | 20,958 | 33,055 | |
| Total | 208,826 | 128,716 | 1.62 |
| Senate | |||
| Candidate | 103,696 | 61,743 | |
| Party | 13,313 | 7,472 | |
| Coordinated | 4,742 | 7,718 | |
| Group | 49,891 | 41,114 | |
| Total | 171,642 | 118,047 | 1.45 |
| Governor | |||
| Candidate | 78,617 | 64,773 | |
| Party | 2,403 | 23,097 | |
| Coordinated | 16,796 | 20,799 | |
| Group | 29,644 | 15,673 | |
| Total | 127,460 | 124,342 | 1.03 |
| 2014 | Pro-Dem | Pro-GOP | Dem to GOP ratio |
| House | |||
| Candidate | 58,881 | 35,539 | |
| Party | 25,843 | 22,713 | |
| Coordinated | 4,080 | 3,365 | |
| Group | 10,006 | 5,271 | |
| Total | 98,810 | 66,888 | 1.48 |
| Senate | |||
| Candidate | 63,912 | 52,365 | |
| Party | 22,361 | 9,686 | |
| Coordinated | 6,546 | 4,326 | |
| Group | 21,337 | 40,959 | |
| Total | 114,156 | 107,336 | 1.06 |
| Governor | |||
| Candidate | 67,935 | 80,410 | |
| Party | 24,285 | 29,396 | |
| Coordinated | 0 | 290 | |
| Group | 22,977 | 18,112 | |
| Total | 115,197 | 128,208 | 0.90 |
| Numbers include ads aired on broadcast television between September 18 and October 15, 2018 and between September 18 and October 15, 2014. CITE SOURCE OF DATA AS: Kantar Media/CMAG with analysis by the Wesleyan Media Project. |
|||
Table 2 takes a look at cycle-to-date ad totals, since January 1, 2017 (and January 1, 2013, for the previous midterm comparison). The number of ads aired is up 60 percent over 2014, with over 3.1 million ads having aired in congressional and gubernatorial campaigns. This includes a 110 percent increase in House ads and a 73 percent increase in races for governor. Notably, the only decline is in party independent airings, down 28 percent from 2014. However, the spike in party-candidate coordinated spots (particularly in gubernatorial campaigns) means that party advertising is roughly flat since 2014.
![]()
Table 2: Number of Ads Aired by Sponsor and Year (Cycle-to-date)
| 2014 | Candidate | Party | Group | Coordinated | Total | % inc |
|---|---|---|---|---|---|---|
| House | 253,116 | 70,106 | 69,445 | 8,667 | 401,334 | |
| Senate | 398,851 | 56,398 | 306,449 | 25,259 | 786,957 | |
| Governor | 479,196 | 113,569 | 171,715 | 6,274 | 770,754 | |
| Total | 1,131,163 | 240,073 | 547,609 | 40,200 | 1,959,045 | |
| 2018 | ||||||
| House | 553,306 | 83,008 | 178,145 | 31,393 | 845,852 | 110.8% |
| Senate | 536,648 | 41,925 | 359,052 | 22,005 | 959,630 | 21.9% |
| Governor | 1,016,838 | 47,990 | 220,308 | 51,430 | 1,336,566 | 73.4% |
| Total | 2,106,792 | 172,923 | 757,505 | 104,828 | 3,142,048 | 60.4% |
| % inc | 86.3% | -28.0% | 38.3% | 160.8% | ||
| Numbers include ads aired on broadcast television between January 1, 2017 and October 15, 2018 and between January 1, 2013 and October 15, 2014. CITE SOURCE OF DATA AS: Kantar Media/CMAG with analysis by the Wesleyan Media Project. |
||||||
Table 3 looks at the top gubernatorial campaigns in terms of ads aired. Florida tops the list, with over 33,000 ads having aired between September 18 and October 15. The lion’s share of these in Florida has come from coordinated party-candidate spending, which makes Florida stand out compared to the other races on the list. (The party columns combine independently sponsored ads from party committees and those in coordination with candidates.)
In the top 20 races, Democrats hold an overall ad total advantage in 15, but they are at substantial disadvantages in Wisconsin, where Scott Walker is fighting for a third term, and in Arizona, where Republican incumbent Doug Ducey is running for a second term. Walker has generally lagged behind in the polls in Wisconsin while Ducey has led by healthy margins in most polls.
![]()
Table 3: Top Gubernatorial Races (9/18 to 10/15)
| State | Airings | Est. Cost (in Ms) | Dem Group | GOP Group | Dem Cand. | GOP Cand. | Dem Pty / Coord | GOP Pty / Coord | Dem Adv |
|---|---|---|---|---|---|---|---|---|---|
| FL | 33,761 | 19.7 | 0 | 2,554 | 0 | 0 | 15,412 | 15,795 | -2,937 |
| OH | 23,551 | 11.0 | 3,902 | 0 | 5,774 | 9,955 | 0 | 3,920 | -4,199 |
| WI | 18,571 | 6.5 | 3,533 | 3,755 | 2,090 | 8,150 | 0 | 1,041 | -7,323 |
| IL | 18,362 | 8.7 | 0 | 1,462 | 11,368 | 4,617 | 0 | 0 | 5,289 |
| MI | 15,355 | 7.4 | 7,092 | 1,265 | 1,824 | 2,839 | 0 | 2,335 | 2,477 |
| IA | 13,431 | 3.4 | 212 | 0 | 6,974 | 6,245 | 0 | 0 | 941 |
| GA | 13,308 | 8.1 | 968 | 0 | 2,717 | 459 | 3,499 | 5,665 | 1,060 |
| OR | 12,227 | 3.5 | 486 | 0 | 6,833 | 4,908 | 0 | 0 | 2,411 |
| NV | 9,147 | 5.4 | 2,181 | 712 | 2,251 | 1,537 | 0 | 2,466 | -283 |
| AZ | 8,558 | 4.8 | 0 | 0 | 967 | 1,076 | 0 | 6,515 | -6,624 |
| TN | 8,396 | 2.5 | 245 | 0 | 5,346 | 2,805 | 0 | 0 | 2,786 |
| CO | 7,943 | 5.1 | 1,288 | 334 | 4,438 | 459 | 0 | 1,424 | 3,509 |
| ME | 7,132 | 1.6 | 1,514 | 0 | 1,605 | 1,089 | 0 | 1,670 | 360 |
| PA | 6,005 | 4.0 | 0 | 0 | 5,852 | 153 | 0 | 0 | 5,699 |
| KS | 5,122 | 1.2 | 1,619 | 0 | 1,276 | 60 | 0 | 2,167 | 668 |
| SD | 5,006 | 0.8 | 0 | 0 | 3,299 | 1,707 | 0 | 0 | 1,592 |
| CT | 4,917 | 2.9 | 0 | 1,426 | 2,450 | 879 | 0 | 0 | 145 |
| CA | 4,798 | 4.6 | 1,148 | 0 | 3,650 | 0 | 0 | 0 | 4,798 |
| OK | 4,460 | 1.4 | 1,028 | 0 | 2,032 | 722 | 0 | 678 | 1,660 |
| MN | 4,447 | 2.1 | 1,565 | 972 | 754 | 868 | 288 | 0 | 767 |
| Numbers include ads aired on broadcast television between September 18 and October 15, 2018. CITE SOURCE OF DATA AS: Kantar Media/CMAG with analysis by the Wesleyan Media Project. |
|||||||||
Table 4 examines the Senate campaigns in which the most ads aired. Among the top 20 races, pro-Democratic ads outnumbered pro-GOP ads in 16. Republican Rick Scott, running against incumbent Democrat Bill Nelson in Florida, has sponsored over 5,000 more ads than Nelson, but Nelson has been the beneficiary of more outside group advertising and slightly more party airings.
Democrats hold large advertising leads in Missouri, Montana, and Arizona, but there is a tighter advertising balance in other states like Indiana, Texas, and North Dakota.
In the top 10 Senate races, outside groups sponsored at least 30 percent of the ads during the last month in all but Texas, including over 55 percent of the ads in the Missouri race and nearly half in Tennessee and West Virginia.
![]()
Table 4: Top Senate Races (9/18 to 10/15)
| State | Airings | Est. Cost (in Ms) | Dem Group | GOP Group | Dem Cand | GOP Cand | Dem Pty / Coord | GOP Pty / Coord | Dem Adv |
|---|---|---|---|---|---|---|---|---|---|
| FL | 36,443 | 21.9 | 6,866 | 4,195 | 8,478 | 13,710 | 1,752 | 1,442 | -2,251 |
| IN | 34,129 | 14.2 | 6,930 | 5,906 | 6,415 | 8,587 | 4,211 | 2,080 | 983 |
| MO | 28,523 | 11.4 | 7,608 | 8,097 | 9,354 | 3,068 | 0 | 396 | 5,401 |
| TN | 26,829 | 9.8 | 7,090 | 5,113 | 7,905 | 4,603 | 0 | 2,118 | 3,161 |
| MT | 26,415 | 3.7 | 6,438 | 2,892 | 8,358 | 4,617 | 2,994 | 1,116 | 9,165 |
| AZ | 22,749 | 11.8 | 4,589 | 2,880 | 4,999 | 1,534 | 5,438 | 3,309 | 7,303 |
| TX | 21,278 | 13.4 | 0 | 2,247 | 11,023 | 8,008 | 0 | 0 | 768 |
| NV | 16,091 | 8.5 | 3,422 | 2,087 | 5,330 | 2,767 | 1,576 | 909 | 4,565 |
| WV | 15,583 | 3.9 | 3,911 | 3,343 | 5,285 | 1,275 | 0 | 1,769 | 2,809 |
| ND | 12,271 | 3.0 | 2,072 | 2,525 | 3,250 | 1,467 | 2,084 | 873 | 2,541 |
| WI | 8,639 | 3.1 | 39 | 1,151 | 5,301 | 2,148 | 0 | 0 | 2,041 |
| VA | 6,009 | 1.9 | 0 | 0 | 6,009 | 0 | 0 | 0 | 6,009 |
| OH | 5,615 | 2.7 | 399 | 75 | 5,066 | 75 | 0 | 0 | 5,315 |
| NJ | 4,592 | 5.4 | 0 | 584 | 758 | 3,250 | 0 | 0 | -3,076 |
| MI | 4,450 | 2.2 | 0 | 0 | 3,594 | 856 | 0 | 0 | 2,738 |
| PA | 4,270 | 2.7 | 0 | 0 | 3,463 | 807 | 0 | 0 | 2,656 |
| MS | 3,821 | 0.9 | 0 | 0 | 455 | 2,188 | 0 | 1,178 | -2,911 |
| MN | 3,793 | 1.5 | 0 | 19 | 3,250 | 524 | 0 | 0 | 2,707 |
| NE | 2,441 | 0.6 | 527 | 0 | 337 | 1,577 | 0 | 0 | -713 |
| WA | 1,559 | 0.5 | 0 | 0 | 1,461 | 98 | 0 | 0 | 1,363 |
| Numbers include ads aired on broadcast television between September 18 and October 15, 2018. CITE SOURCE OF DATA AS: Kantar Media/CMAG with analysis by the Wesleyan Media Project. |
|||||||||
Next, Table 5 shows top House races. Again, Democrats aired more ads in the vast majority of them—17 of the top 20 races. New York’s 22nd congressional district and Maine’s 2nd congressional district are the top two races in the country. Outside groups aired over 40 percent of the total in the former and nearly 1 in every 3 ads aired in the latter. In the hot ME-02 race, the Democratic and Republican candidates are nearly even in total advertising, with incumbent Republican Bruce Poliquin (and allies) airing 404 more spots than all pro-Democratic advertisers, in a race with nearly 12,000 total airings in the last month.
Outside groups are active in a host of House races, which is expected given the fight for control of the chamber. Groups have sponsored at least 20 percent of the ads in 13 of the top 20 races.
![]()
Table 5: Top House Races (9/18 to 10/15)
| Race | Airings | Est. Cost (in Ms) | Dem Group | GOP Group | Dem Cand. | GOP Cand. | Dem Pty / Coord | GOP Pty / Coord | Dem Adv |
|---|---|---|---|---|---|---|---|---|---|
| NY-22 | 12,426 | 2.7 | 2,352 | 2,935 | 3,923 | 1,865 | 558 | 793 | 1,240 |
| ME-02 | 11,658 | 2.4 | 1,451 | 2,159 | 3,205 | 3,024 | 971 | 848 | -404 |
| NM-02 | 9,269 | 2.1 | 544 | 199 | 3,338 | 403 | 3,214 | 1,571 | 4,923 |
| MT-01 | 8,626 | 0.8 | 0 | 0 | 4,605 | 4,021 | 0 | 0 | 584 |
| NY-19 | 7,799 | 2.0 | 161 | 285 | 3,944 | 907 | 1,159 | 1,343 | 2,729 |
| VA-02 | 7,748 | 2.0 | 1,117 | 0 | 2,100 | 1,031 | 1,856 | 1,644 | 2,398 |
| KY-06 | 7,710 | 2.6 | 349 | 1,704 | 1,926 | 2,455 | 1,016 | 260 | -1,128 |
| CA-21 | 7,388 | 1.4 | 0 | 0 | 2,312 | 2,486 | 2,590 | 0 | 2,416 |
| CA-10 | 7,066 | 3.7 | 399 | 1,845 | 2,799 | 500 | 1,122 | 401 | 1,574 |
| MN-03 | 6,974 | 4.1 | 1,248 | 977 | 2,250 | 1,471 | 0 | 1,028 | 22 |
| MI-08 | 6,863 | 5.3 | 1,629 | 368 | 2,491 | 597 | 1,025 | 753 | 3,427 |
| CO-06 | 6,818 | 4.9 | 1,056 | 654 | 1,325 | 731 | 2,157 | 895 | 2,258 |
| KS-02 | 6,701 | 1.9 | 0 | 2,012 | 1,623 | 0 | 3,066 | 0 | 2,677 |
| MN-08 | 6,628 | 3.6 | 0 | 3,303 | 1,473 | 337 | 1,291 | 224 | -1,100 |
| IA-03 | 6,394 | 2.3 | 0 | 1,321 | 2,331 | 1,353 | 1,389 | 0 | 1,046 |
| WA-08 | 6,217 | 4.2 | 246 | 961 | 2,496 | 636 | 1,120 | 758 | 1,507 |
| TX-07 | 5,867 | 5.1 | 309 | 1,093 | 1,805 | 839 | 1,060 | 761 | 481 |
| VA-07 | 5,142 | 1.5 | 785 | 1,224 | 2,324 | 809 | 0 | 0 | 1,076 |
| OH-01 | 5,135 | 2.0 | 296 | 1,340 | 1,431 | 404 | 1,339 | 325 | 997 |
| FL-26 | 4,771 | 5.1 | 505 | 49 | 322 | 545 | 2,154 | 1,196 | 1,191 |
| Numbers include ads aired on broadcast television between September 18 and October 15, 2018. CITE SOURCE OF DATA AS: Kantar Media/CMAG with analysis by the Wesleyan Media Project. |
|||||||||
Top Groups Involved in Many Campaigns
Table 6 lists the groups most active in congressional and gubernatorial campaigns. The pro-Democratic dark money group, Majority Forward, is the top group, with nearly 30,000 ads in nine Senate campaigns, just edging out the pro-GOP super PAC Congressional Leadership Fund, which sponsored 28,000 ads across 29 House races.
Of the top groups eight are involved in only one race. It should be noted, though, that some of these—A Stronger Wisconsin/Michigan/Ohio—are affiliates of the Democratic Governor’s Association. The other twelve groups, however, are active in many campaigns. A handful of groups—like America First Action and Women Vote—are involved not only in multiple campaigns but in different electoral contests (i.e., House and Senate races).
![]()
Table 6: Top Groups (9/18 to 10/15)
| Sponsor | Favored Party | Group Type | Airings | Est. Cost (in Ms) | Races |
|---|---|---|---|---|---|
| Majority Forward | Dem | 501c4 | 29,050 | 13.1 | Sen-AZ, Sen-FL, Sen-IN, Sen-MO, Sen-MT, Sen-ND, Sen-NV, Sen-TN, Sen,WV |
| Congressional Leadership Fund | GOP | Super PAC | 27,987 | 15.8 | House: CA10, CA25, CA39, CO06, IA03, IL12, IL13, KS02, KS03, KY06, ME02, MN01, MN03, MN08, NC02, NC09, NE02, NM02, NV03, NY22, OH01, PA01, TX07, TX23, TX32, UT04, VA07, WA08, WI01 |
| Senate Leadership Fund | GOP | Super PAC | 19,313 | 10.7 | Sen-IN, Sen-MO, Sen-ND, Sen-NV, Sen-TN, Sen-WV |
| Senate Majority PAC | Dem | Super PAC | 11,319 | 4.0 | Sen-FL, Sen-IN, Sen-MO, Sen-ND, Sen-NV, Sen-WV |
| America First Action | GOP | Super PAC | 7,492 | 2.8 | Sen-IN, Sen-MO, Sen-MT, Sen-ND; House: MI08, MI11, MN01, MN08, NC13, NY22, TX32 |
| A Stronger Michigan | Dem | 527 | 7,092 | 3.4 | Gov-MI |
| House Majority PAC | Dem | Super PAC | 7,079 | 4.9 | House: CA10, CA39, CA48, FL26, IA01, IL06, MI08, MI11, MN03, NJ03, NV04, NY19, NY22, NY24, TX32, VA02, VA07 |
| Women Vote | Dem | Super PAC | 5,621 | 2.7 | Gov-NM, Sen-AZ, Sen-MO; House: IL13, KS03, MI08, MI11, NC02, NC13, TX07, TX23, WA08 |
| New Republican PAC | GOP | Super PAC | 4,195 | 2.1 | Sen-FL |
| A Stronger Wisconsin | Dem | 527 | 3,533 | 1.5 | Gov-WI |
| Defend AZ | GOP | Super PAC | 2,773 | 2.1 | Sen-AZ |
| Florida Facts | GOP | Unknown | 2,554 | 2.5 | Gov-FL |
| Americans for Prosperity | GOP | 501c4 | 2,443 | 1.0 | Gov-MI, Gov-WI |
| End Citizens United | Dem | PAC | 2,102 | 0.5 | House: CO06, IL12, MI08, MN03, NY22 |
| U.S. Chamber of Commerce | GOP | 501c6 | 2,070 | 0.8 | Sen-AZ, Sen-IN, Sen-MT, Sen-TN; House: KS03 |
| A Stronger Ohio | Dem | 527 | 2,038 | 1.4 | Gov-OH |
| AFSCME (incl People, Nevada) | Dem | 527 | 4,263 | 2.1 | Gov-OH, Gov-NV, Sen-AZ, Sen-NV, Sen-TN |
| Right Direction Wisconsin PAC | GOP | 527 | 1,914 | 0.8 | Gov-WI |
| NEA Advocacy Fund | Dem | Super PAC | 1,847 | 0.5 | Sen-MT |
| Change Now | Dem | Super PAC | 1,698 | 0.7 | House: FL16, IA01, MI06, OH01 |
| Numbers include ads aired on broadcast television between September 18 and October 15, 2018. Group classifications from the Center for Responsive Politics (CRP). CITE SOURCE OF DATA AS: Kantar Media/CMAG with analysis by the Wesleyan Media Project. |
|||||
In partnership with the Center for Responsive Politics, the Wesleyan Media Project also tracks outside group ad spending by the type of donor disclosure. We classify groups as full-disclosure groups (meaning they disclose contributor lists to the Federal Election Commission), non-disclosing dark money groups (which are not required to disclose publicly their donors; these are most often 501c4 non-profits), and partial-disclosure groups (those that disclose donors but also accept contributions from dark money sources).
Table 7 outlines the type of disclosure for groups sponsoring ads in congressional races between September 18 and October 15. The results point to important differences across party and election type. The bulk of spending for Democrats in House races are from full disclosure super PACs, House Majority PAC being the biggest. However, the majority of pro-Democratic ads in Senate races are from dark money groups like Majority Forward. On the Republican side, there is very little direct dark money spending in either House or Senate campaigns, but we classify Congressional Leadership Fund—heavily active in House races—as a partial disclosing group since it accepted substantial sums from dark money sources (for example, $20 million from American Action Network, according to the Center for Responsive Politics).
![]()
Table 7: Outside Spending in Congressional Races by Disclosure Type (9/18 to 10/15)
| Pro Dem | Column % | Pro GOP | Column % | |
|---|---|---|---|---|
| House | ||||
| Dark | 2,991 | 14.3% | 521 | 1.6% |
| Partial | 67 | 0.3% | 27,998 | 84.7% |
| Full | 17,900 | 85.4% | 4,536 | 13.7% |
| Total | 20,958 | 33,055 | ||
| Senate | ||||
| Dark | 30,384 | 60.9% | 3,183 | 7.7% |
| Partial | 11,993 | 24.0% | 1,151 | 2.8% |
| Full | 7,514 | 15.1% | 36,780 | 89.5% |
| Total | 49,891 | 41,114 | ||
| Numbers include ads aired on broadcast television between September 18 and October 15, 2018. Group disclosure type comes from the Center for Responsive Politics (CRP). CITE SOURCE OF DATA AS: Kantar Media/CMAG with analysis by the Wesleyan Media Project. |
||||
Top Issues/Mentions in 2018
Health care is dominating the issue discussion in campaign ads (see Tables 8, 10, 11) and is the top issue mentioned in both pro-Republican and pro-Democratic airings in federal races and in pro-Democratic airings for gubernatorial offices. Only in pro-Republican airings for governor is health care not at the top of the list (and in fact is not in the top five issues mentioned, though it is number six at 15 percent of airings).
While health care is the top issue for both parties in U.S. Senate airings, pro-Democratic ads are featuring the issue at nearly twice the rate of pro-Republican airings (47 percent versus 24 percent). Pro-Republican airings in Senate races are also talking about taxes in roughly a quarter (23 percent) of their airings.
![]()
Table 8: Top Five Issues/Mentions in U.S. Senate Advertising (9/18 to 10/15)
| Pro-Democratic | % of Airings | Pro-Republican | % of Airings | |
|---|---|---|---|---|
| Health care | 47% | Health care | 24% | |
| Corruption | 12% | Taxes | 23% | |
| Jobs | 12% | Public Safety | 18% | |
| Prescription Drugs | 10% | Jobs | 15% | |
| Campaign Finance | 10% | Pro-Trump | 15% | |
| Numbers include ads aired on broadcast television between September 18 and October 15, 2018. CITE SOURCE OF DATA AS: Kantar Media/CMAG with analysis by the Wesleyan Media Project. |
||||
Of course, the overall aggregation of top issues hides a fair amount of variation in individual races. Table 9 displays the top issue (or issues if several appear at the same rate) by party lean (including party and outside group airings on behalf of a candidate) for all U.S. Senate races where at least 2,000 ads have aired in the race overall. For example, health care is not a top talking point in ads by or on behalf of either Bill Nelson or Rick Scott in the Florida senate race, but over two-thirds of airings (69 percent) benefiting Claire McCaskill in Missouri mention the issue.
![]()
Table 9: Top Issue(s) in U.S. Senate Races by Party Lean (9/18 to 10/15)
| State | Party Lean | Airings Total | Top Issue(s) | Airings Mentioning Issue | Issue % |
|---|---|---|---|---|---|
| FL | Pro-Dem | 17,096 | Corruption | 8,214 | 48% |
| FL | Pro-GOP | 19,347 | Public Safety | 7,945 | 41% |
| IN | Pro-Dem | 17,556 | China/Trade | 8,677 | 49% |
| IN | Pro-GOP | 16,573 | Health care | 6,715 | 41% |
| MO | Pro-Dem | 16,962 | Health care | 11,683 | 69% |
| MO | Pro-GOP | 11,561 | Corruption | 3,979 | 34% |
| TN | Pro-Dem | 14,995 | Budget | 6,216 | 41% |
| TN | Pro-GOP | 11,834 | Taxes | 4,994 | 42% |
| MT | Pro-Dem | 17,790 | Health care | 7,161 | 40% |
| MT | Pro-GOP | 8,625 | Campaign Finance | 4,489 | 52% |
| AZ | Pro-Dem | 15,026 | Health care | 9,394 | 63% |
| AZ | Pro-GOP | 7,723 | Public Safety | 3,719 | 48% |
| TX | Pro-Dem | 11,023 | Pro-Immigration, Health care, Education | 1,349 | 12% |
| TX | Pro-GOP | 10,255 | Public Safety | 5,348 | 52% |
| NV | Pro-Dem | 10,328 | Health care | 10,043 | 97% |
| NV | Pro-GOP | 5,763 | Campaign Finance | 2,880 | 50% |
| WV | Pro-Dem | 9,196 | Health care | 5,424 | 59% |
| WV | Pro-GOP | 6,387 | Anti-Obama | 3,679 | 58% |
| ND | Pro-Dem | 7,406 | Food/Agriculture | 3,281 | 44% |
| ND | Pro-GOP | 4,865 | Public Safety, Anti-Immigration | 1,390 | 29% |
| WI | Pro-Dem | 5,340 | Health care | 4,888 | 92% |
| WI | Pro-GOP | 3,299 | Health care | 2,081 | 63% |
| VA | Pro-Dem | 6,009 | Health care | 2,845 | 47% |
| OH | Pro-Dem | 5,465 | Corruption | 3,515 | 64% |
| OH | Pro-GOP | 150 | Supreme Court | 150 | 100% |
| NJ | Pro-Dem | 758 | Supreme Court, Anti-Trump | 655 | 86% |
| NJ | Pro-GOP | 3,834 | Corruption | 2,452 | 64% |
| MI | Pro-Dem | 3,594 | Food/Agriculture | 3,236 | 90% |
| MI | Pro-GOP | 856 | Vets, Health care, Education | 856 | 100% |
| PA | Pro-Dem | 3,463 | Health care | 2,174 | 63% |
| PA | Pro-GOP | 807 | Vets, Pro-Trump, National Defense, Anti-Immigration, Faith | 204 | 25% |
| MS | Pro-Dem | 455 | Transportation, Trade, Public Safety, Pro-Trump | 455 | 100% |
| MS | Pro-GOP | 3,366 | Pro-Trump | 1,790 | 53% |
| MN | Pro-Dem | 3,250 | Food/Agriculture | 1,477 | 45% |
| MN | Pro-GOP | 543 | Retirement, Public Safety, Health care | 366 | 67% |
| NE | Pro-Dem | 864 | Supreme Court, Women's Rights | 527 | 61% |
| NE | Pro-GOP | 1,577 | Vets, Defense | 1,244 | 79% |
| Numbers include ads aired on broadcast television between September 18 and October 15, 2018. CITE SOURCE OF DATA AS: Kantar Media/CMAG with analysis by the Wesleyan Media Project. |
|||||
Table 10 lists the top five issues/mentions in U.S. House advertising overall. Sixty-one percent of pro-Democratic airings focus on health care, while over a third (38 percent) of pro-Republican airings do the same (tying the rate of discussion of taxes). Taxes are also the second most talked about issue for pro-Democratic airings at 21 percent. Medicare is in the top five issues for congressional airings on both sides at one-fifth of the airings (20 percent) for pro-Democratic airings and 15 percent for pro-Republican airings.
![]()
Table 10: Top Five Issues/Mentions in U.S. House Advertising (9/18 to 10/15)
| Pro-Democratic | % of Airings | Pro-Republican | % of Airings | |
|---|---|---|---|---|
| Health care | 61% | Health care | 38% | |
| Taxes | 21% | Taxes | 38% | |
| Medicare | 20% | Budget | 26% | |
| Social Security | 17% | Medicare | 15% | |
| Tax Reform | 14% | Jobs | 15% | |
| Numbers include ads aired on broadcast television between September 18 and October 15, 2018. CITE SOURCE OF DATA AS: Kantar Media/CMAG with analysis by the Wesleyan Media Project. |
||||
Health care tops the list of mentions in pro-Democratic gubernatorial airings, appearing in 45 percent. Forty percent of pro-Republican airings for governor mentioned taxes. Education is the second most mentioned issue for both parties (33 percent for pro-Democratic airings and 30 percent for pro-Republican airings).
![]()
Table 11: Top Five Issues/Mentions in Gubernatorial Advertising (9/18 to 10/15)
| Pro-Democratic | % of Airings | Pro-Republican | % of Airings | |
|---|---|---|---|---|
| Health care | 45% | Taxes | 40% | |
| Education | 33% | Education | 30% | |
| Taxes | 23% | Public Safety | 28% | |
| Anti-Insurance Companies | 18% | Jobs | 18% | |
| Jobs | 14% | Anti-Immigration | 16% | |
| Numbers include ads aired on broadcast television between September 18 and October 15, 2018. CITE SOURCE OF DATA AS: Kantar Media/CMAG with analysis by the Wesleyan Media Project. |
||||
Trends in Issues and Mentions in Congressional Races Over Time
As discussed above in Figure 1, the issue of health care is dominating the campaign agenda in federal elections for U.S. Congress at a level not seen in the past decade. How do some other issues compare? The Wesleyan Media Project compares issue attention this cycle to its content coding of federal advertising in past cycles.
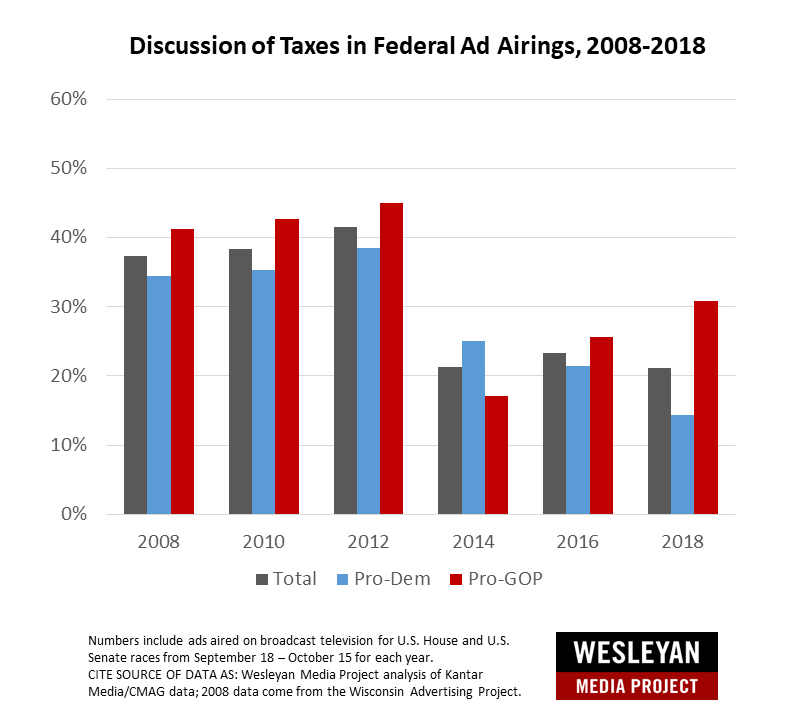
Figure 2 displays discussion of taxes over the last decade. Whereas health care was discussed at very different rates by party over the bulk of the last decade (see Figure 1), Figure 2 shows that both parties pay similar attention to the issue of taxes, though 2018 appears to be different, with pro-Republican airings much more likely to mention the topic this year than pro-Democratic ones.
![]()
“For all of the early talk about the tax bill being a big Republican selling point in the campaign, discussion of taxes in 2018 is lower than it was during 2008 and the first two cycles after Obama’s election,” said Travis Ridout, co-director of the Wesleyan Media Project. “Republicans are more likely to mention taxes this cycle, but they certainly aren’t as focused on it as they were a decade ago.”
![]()
![]()
Figure 2: Discussion of Taxes in Federal Ad Airings, 2008-2018
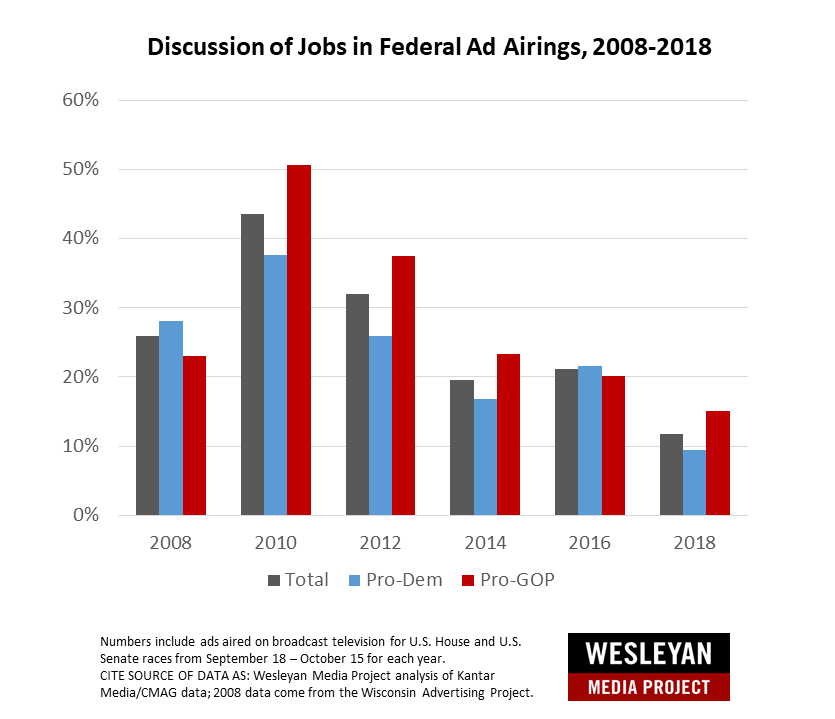
Discussion of jobs over the past decade takes a different pattern, as shown in Figure 3. More specifically, the issue rose in prominence during the 2010 midterms to just under half of all airings (43.5 percent; over a third of pro-Democratic ads and just over half of pro-Republican ads). Since then, however, the topic has been on a steady decline as a proportion of all federal airings.
![]()
Figure 3: Discussion of Jobs in Federal Ad Airings, 2008-2018
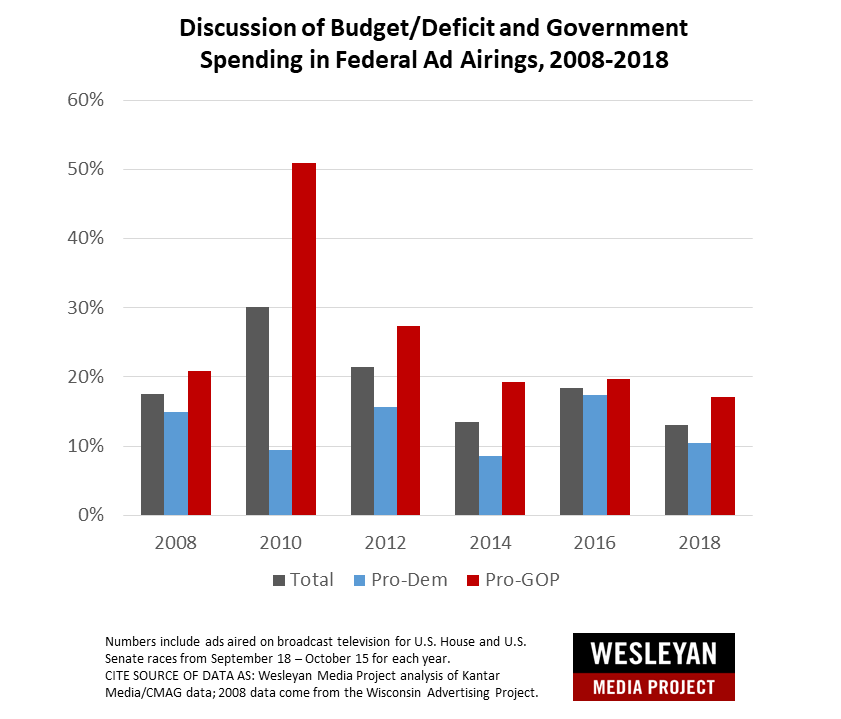
Discussion of the federal deficit and government spending was a hot topic in pro-Republican airings in 2010 following the Obama stimulus packages. More specifically, it appeared in over half (50.9 percent) of pro-Republican airings in 2010 and over a quarter (27.3 percent) in 2012 but has since receded to below 20 percent of airings overall. Despite news of the ballooning budget deficit, the topic has not been widely discussed in 2018, appearing in 13.1 percent of ads. Pro-Republican ads are talking about the issue more often than Democratic ads are, however (17.1 percent to 10.5 percent).
![]()
Figure 4: Discussion of Budget/Deficit and Government Spending in Federal Ad Airings, 2008-2018
Immigration may be an important issue for many, but over the last month of federal advertising, only 7.8 percent of ads in federal races overall have referenced the issue. Pro-Republican airings are more than twice as likely to discuss it (12.7 percent) than pro-Democratic airings (4.6 percent), and these percentages are very consistent with discussion in both 2014 and 2016 overall and by party. The topic remains important to some candidates this cycle, though. For example, Republican Senate candidate Mike Braun in Indiana has mentioned the issue in a third of his ads through September, though he has not raised the topic in recent weeks. In 2012 the topic appeared in fewer than one percent of airings overall and by either party (data from 2008 and 2010 are unavailable on that issue).
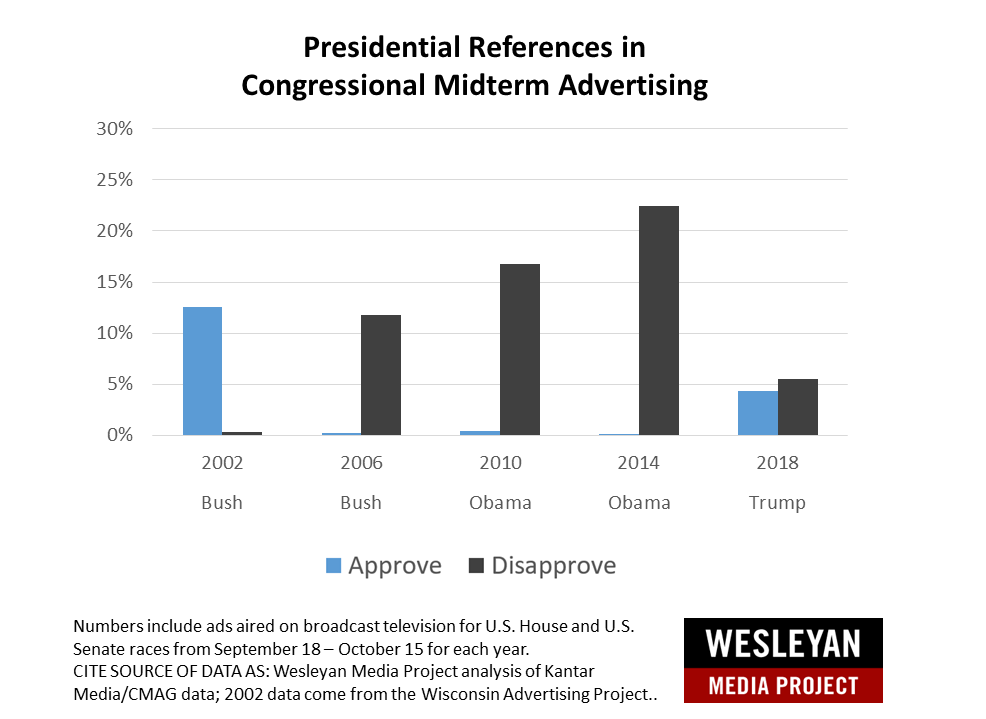
Mentions of Donald Trump in ads for U.S. Congress have fallen off from 18 percent in August to just under one in every ten ads (9.9 percent) during the period from September 18 to October 15. And unlike airings over the summer, the Wesleyan Media Project found disapproving mentions of the president are now outweighing positive ones (5.5 percent to 4.3 percent). Figure 5 shows how presidential references compare to earlier cycles. Aside from Bush in 2002, Trump still maintains a lower level of criticism of any midterm in the last two decades, and these references fall well below discussion of health care, taxes, deficit/spending and immigration. In other words, during the heat of the 2018 midterms, issues are taking center stage and Trump references are much more rare.
![]()
Figure 5: Presidential References in Congressional Midterm Advertising
![]()
Other interesting issue discussion from 2018 include: 3.8 percent of federal airings in the last month mention opioids and only 0.1 percent of airings mention Russia.
Looking at U.S. Senate airings only for which the Wesleyan Media Project has supplemental coding information from English-language airings from September 18 to October 15, zero airings mentioned Robert Mueller, Russia or the Mueller investigation. Nancy Pelosi, by contrast, was featured in 7 percent of senatorial airings. All of the 19,717 Pelosi mentions were negative. The anti-Pelosi mentions, which comprise 15.2 percent of pro-Republican airings and 1.2 percent of pro-Democratic airings, were distributed widely appearing in Florida, Indiana, Missouri, Montana, North Dakota, Nevada, Ohio, Tennessee Texas, and West Virginia senate contests. The pro-Democratic airings featuring Pelosi unfavorably all appeared in Nevada. Although Trump was mentioned most often in senate ads (11.4 percent; 32,159 airings), only 7,411 of his references were negative (2.6 percent overall). Negative Pelosi references were also more prominent than anti-Clinton mentions (4.9 percent; 13,817 airings) and anti-Obama mentions (2.9 percent; 8,190 airings).
![]()
Top 5 House and Senate Races Cycle-to-Date
Table 12 lists the top five House and top five Senate races by airing totals cycle-to-date from January 1, 2017 through October 15, 2018.
![]()
Table 12: Top 5 House and Senate Races by Airings (Cycle-to-date)
| Ads Aired | Cost | |
|---|---|---|
| House | ||
| *MT-01 | 65,500 | $6,029,470 |
| *GA-06 | 33,962 | $29,609,350 |
| NY-22 | 29,903 | $6,706,070 |
| ME-02 | 24,603 | $5,660,250 |
| KY-06 | 20,200 | $6,859,210 |
| Senate | ||
| IN | 114,625 | $43,983,840 |
| FL | 102,786 | $70,031,190 |
| MT | 97,922 | $18,857,910 |
| MO | 90,160 | $45,828,000 |
| WV | 75,974 | $22,603,120 |
| *Includes ongoing campaigns as well as special elections in the district from earlier in the cycle. Numbers include ads aired on broadcast television between January 1, 2017 and October 15, 2018. CITE SOURCE OF DATA AS: Kantar Media/CMAG with analysis by the Wesleyan Media Project. |
||
Table 13 lists the top five House and top five Senate races by estimated spending totals cycle-to-date from January 1, 2017 through October 15, 2018.
![]()
Table 13: Top 5 House and Senate Races by Spending (Cycle-to-date)
| Ads Aired | Cost | |
|---|---|---|
| House | ||
| *GA-06 | 33,962 | $29,609,350 |
| OH-12 | 15,165 | $9,910,410 |
| *PA-18 | 8,733 | $9,499,170 |
| CO-06 | 11,851 | $8,768,600 |
| VA-10 | 7,676 | $8,527,870 |
| Senate | ||
| FL | 102,786 | $70,031,190 |
| MO | 90,160 | $45,828,000 |
| IN | 114,625 | $43,983,840 |
| NV | 56,798 | $35,022,970 |
| AZ | 53,471 | $28,552,480 |
| *Includes ongoing campaigns as well as special elections in the district from earlier in the cycle. Numbers include ads aired on broadcast television between January 1, 2017 and October 15, 2018. CITE SOURCE OF DATA AS: Kantar Media/CMAG with analysis by the Wesleyan Media Project. |
||
About This Report
Data reported here from Kantar Media/CMAG do not cover local cable buys, only broadcast television, national network and national cable buys.
The Wesleyan Media Project (WMP) provides real-time tracking and analysis of political advertising in an effort to increase transparency in elections. Housed in Wesleyan’s Quantitative Analysis Center – part of the Allbritton Center for the Study of Public Life – the Wesleyan Media Project is the successor to the Wisconsin Advertising Project, which disbanded in 2009. It is directed by Erika Franklin Fowler, associate professor of government at Wesleyan University, Michael M. Franz, professor of government at Bowdoin College and Travis N. Ridout, professor of political science at Washington State University. WMP staff include Laura Baum (Project Manager), Dolly Haddad (Project Coordinator) and Matthew Motta (Research Associate).
The Wesleyan Media Project is supported by Wesleyan University and the John S. and James L. Knight Foundation. Data are provided by Kantar Media/CMAG with analysis by the Wesleyan Media Project. WMP is partnering again this year with the Center for Responsive Politics, to provide added information on outside group disclosure.
Periodic releases of data will be posted on the project’s website and dispersed via Twitter @wesmediaproject. To be added to our email update list, click here.
For more information contact:
Lauren Rubenstein, lrubenstein@wesleyan.edu, (860) 685-3813
About Wesleyan University
Wesleyan University, in Middletown, Conn., is known for the excellence of its academic and co-curricular programs. With more than 2,900 undergraduates and 200 graduate students, Wesleyan is dedicated to providing a liberal arts education characterized by boldness, rigor and practical idealism. For more, visit wesleyan.edu.
About the John S. and James L. Knight Foundation
Knight Foundation is a national foundation with strong local roots. We invest in journalism, in the arts, and in the success of cities where brothers John S. and James L. Knight once published newspapers. Our goal is to foster informed and engaged communities, which we believe are essential for a healthy democracy.


