(MIDDLETOWN, CT) November 1, 2017 – Earlier this year, the Trump Administration announced drastic cuts to the advertising and outreach budget for the 2018 individual health insurance marketplace open enrollment period that begins today. More specifically, the advertising budget for plans available through healthcare.gov was cut 90 percent (from $100 million to $10 million) and the in-person outreach budget was reduced by 41 percent, which collectively result in a 72 percent reduction in marketing and outreach efforts for the federal marketplace. In addition, the enrollment window for all plans available through the Affordable Care Act (ACA) is only 45 days this year compared to three months last year.
The Wesleyan Media Project, in addition to tracking campaign advertising, has been tracking health insurance advertising related to the Affordable Care Act since 2013, and here is what we know about the volume and likely effect of that activity over the last four years. The figures below refer to advertising related to health insurance from all sponsors over these time periods. This encompasses ads sponsored by the federal government, but also ads from states, private insurers, as well as insurance brokers and enrollment advocates.
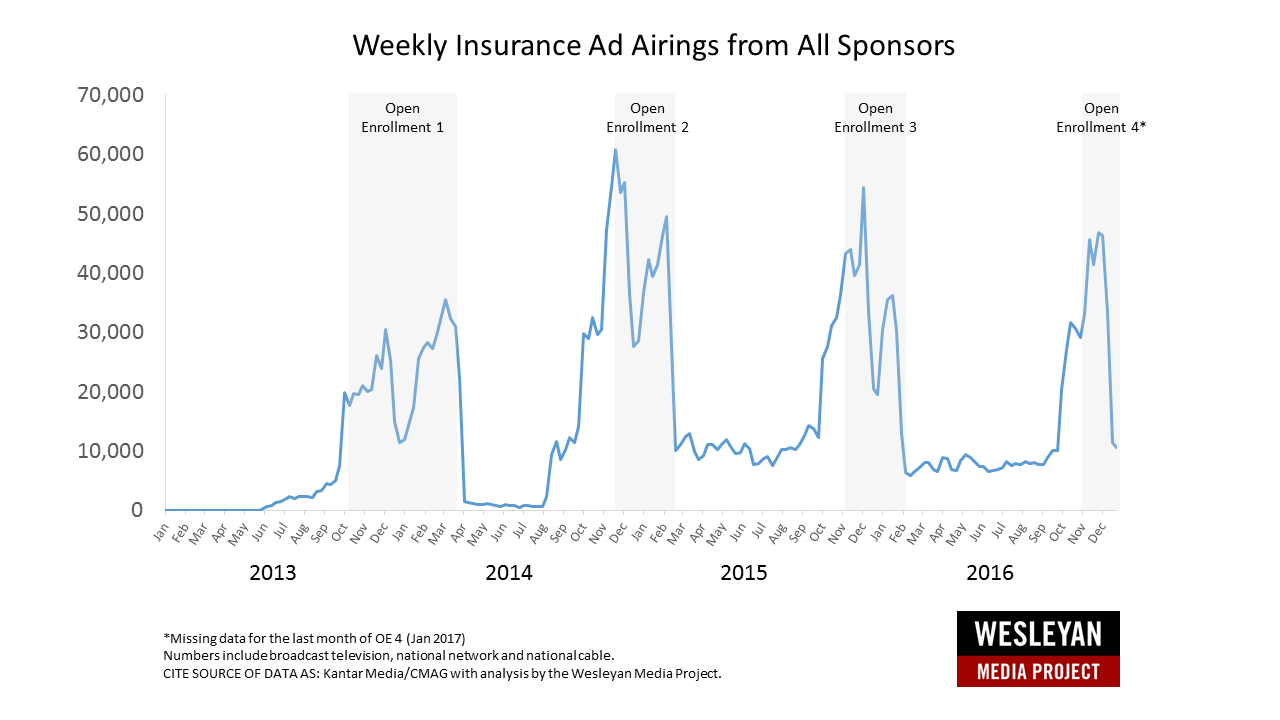
Figure 1. Volume of ACA Insurance Advertising 2013-2016
![]()
Figure 1 displays the volume of insurance advertising from all sponsors over time, which clearly shows both the ramp up in insurance advertising activity prior to the opening of each enrollment period along with the extensive volume of activity throughout the duration of each.
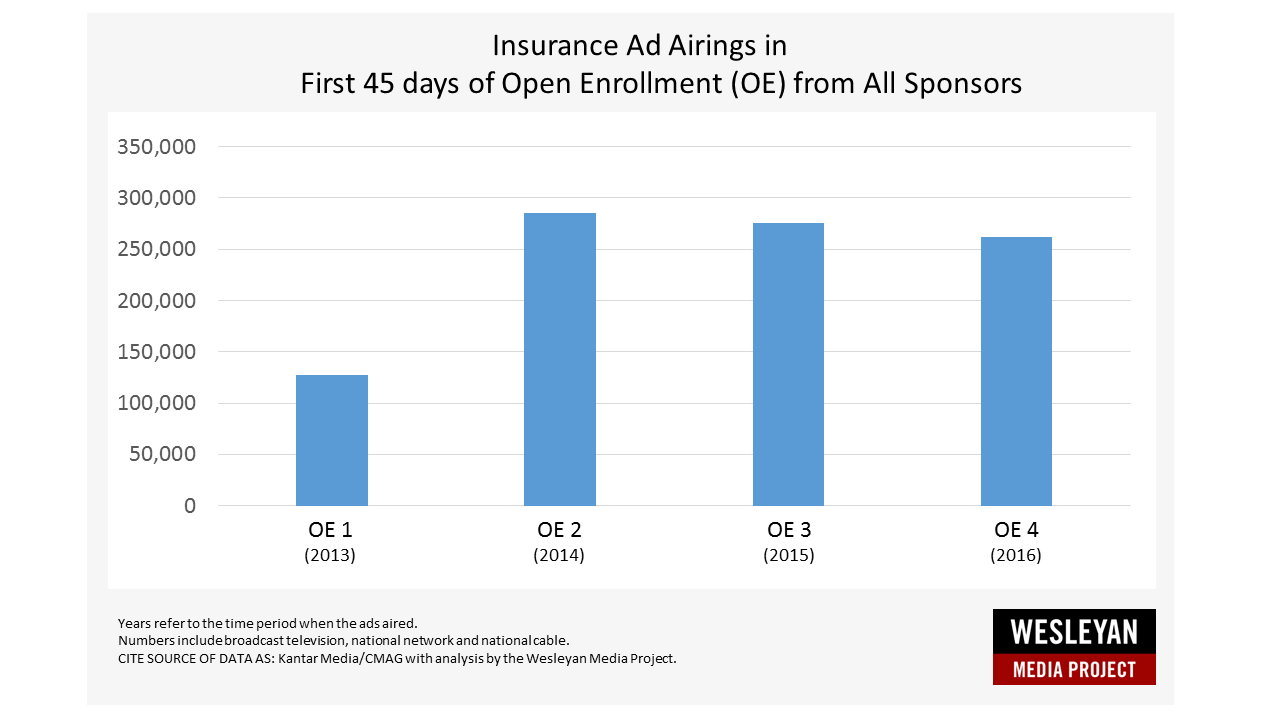
Figure 2. Health Insurance Ad Volume in the First 45 Days of Open Enrollment
![]()
Figure 2 shows the aggregated volume of activity, across all 210 U.S. media markets (including national network and national cable airings), from all sponsors during the first 45 days of each of the previous open enrollment periods. As shown in the figure, advertising was lower in 2013 during the first enrollment period, highest for the second period, and remained above 250,000 airings in the third and fourth enrollment periods.
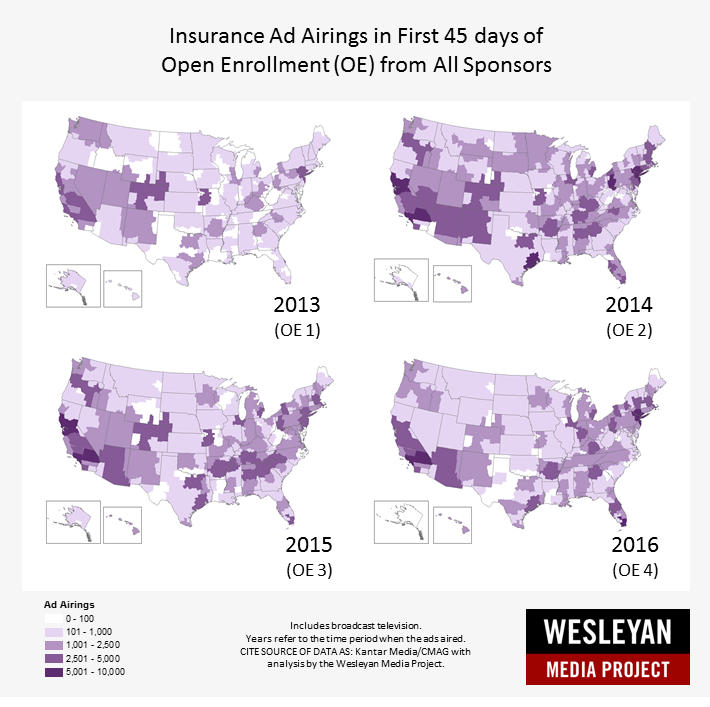
Figure 3. Geographic Variation of Health Insurance Ad Volume in the First 45 Days of Open Enrollment
![]()
Finally, Figure 3 shows the geographic variation in ad targeting activity from all sponsors across the U.S. As shown in the figure, geographic targeting of advertising has varied over time as marketing strategies adjusted to cater to different populations.
![]()
Evidence that Ads Matter
Extensive survey evidence suggests that awareness about the marketplace is low, especially among the uninsured population, and there is a great deal of confusion about who will be affected by changes in the ACA marketplaces. Amid low levels of awareness and high levels of confusion, advertising can play a key role in informing the public, clarifying the options, and encouraging the uninsured to sign-up for health insurance coverage.
Wesleyan Media Project data from Kantar Media/CMAG has been used in several studies to show how insurance advertising correlates with perceptions of being informed and website information seeking. In addition, county-level changes in advertising volume between 2013 and 2014 have been shown to correspond with greater gains in health insurance.
A review of this evidence, written by Wesleyan Media Project Co-Director Erika Franklin Fowler and University of Minnesota Health Policy and Management Professor Sarah E. Gollust is available here, and references to the publications using WMP data on health insurance advertising are listed below:
- Shafer, Paul, Erika Franklin Fowler, Laura Baum and Sarah Gollust. September 2, 2017. “Advertising cutbacks reduce Marketplace information-seeking behavior: Lessons from Kentucky for 2018.” The Incidental Economist blog.
- Karaca-Mandic, Pinar, Andrew Wilcock, Laura Baum, Colleen Barry, Erika Franklin Fowler, Jeff Niederdeppe and Sarah E. Gollust. 2017. “The Volume of TV Advertisements During the ACAs First Enrollment Period was Associated with Increased Insurance Coverage.” Health Affairs 36(4): 1-9.
- Fowler, Erika Franklin, Laura M. Baum, Colleen Barry, Jeff Niederdeppe and Sarah E. Gollust. 2017. “Media Messages and Perceptions of the Affordable Care Act During the Early Phase of Implementation.” Journal of Health Politics, Policy and Law 42(1): 167-195.
- Gollust, Sarah, Colleen Barry, Jeff Niederdeppe, Laura Baum and Erika Franklin Fowler. 2014. “First Impressions: Geographic Variation in Media Messages During the First Phase of ACA Implementation.” Journal of Health Politics, Policy and Law 39(5): 1-10.
![]()
The Wesleyan Media Project is supported by grants from The John S. and James L. Knight Foundation and Wesleyan University. Support for this research came, in part, from the Robert Wood Johnson Foundation SHARE program, Grant No. 72179. Data provided by Kantar Media/CMAG with analysis by the Wesleyan Media Project.


