Photo: John Brighenti/Flickr
Senate Ads Up 170 Percent; House Ads Up 104 Percent
(MIDDLETOWN, CT) August 13, 2020 – The year 2020 is shaping up to be a banner year for television advertising with huge increases in volume and (to a lesser extent) spending in U.S. House and U.S. Senate races. Since January 1, 2019, over 275,000 ads have aired in markets across the country for U.S. House races, which represents a 104 percent increase over the comparable period in the 2015-2016 election cycle and a 73 percent increase over the 2011-2012 cycle (Table 1). Spending on House advertising is up by 31 percent over the last presidential cycle and by 51 percent over the 2012 cycle.
On the U.S. Senate side a whopping 685,727 ads have aired cycle-to-date, which is a 170 percent increase over the 2015-2016 cycle (spending is up by 19 percent, suggesting that ad dollars are stretching further this year than they were in the previous cycle). If we look just at the period since mid-July, the increase in ad volume is even more dramatic with over 3.5 times the number of U.S. Senate airings on television this year compared to the same period fin 2016.
Click here to see our recent report on the presidential race covering the same time periods.
Table 1: U.S. House and U.S. Senate Ad Volume and Spending by Cycle (Cycle-to-Date and Since July 15)
| U.S. House | Cycle-to-Date (through Aug. 9) | July 15 - August 9,2020 | ||
| 2011-2012 | 159,095 | $68,162,670 | 31,080 | $14,742,290 |
| 2015-2016 | 135,324 | $78,619,100 | 33,946 | $17,359,440 |
| 2019-2020 | 275,633 | $102,693,840 | 63,101 | $20,349,450 |
| U.S. Senate | Cycle-to-Date (through Aug. 9) | July 15 - August 9,2020 | ||
| 2011-2012 | 310,714 | $142,814,680 | 97,246 | $49,857,750 |
| 2015-2016 | 253,570 | $231,010,750 | 62,379 | $42,297,850 |
| 2019-2020 | 685,727 | $274,447,400 | 223,848 | $92,286,000 |
| Numbers include ads aired on broadcast television between January 1 of the off-year and August 9 of the election year and between July 15 and August 9 of the election year. CITE SOURCE OF DATA AS: Kantar/CMAG with analysis by the Wesleyan Media Project. |
||||
|---|---|---|---|---|
Figure 1 shows the number of ad airings in U.S. House races in the current and previous two election cycles. It is clear that 2020 stands out for high ad volumes, especially since June of this year. In late July, for instance, there were over 20,000 ad airings in U.S. House races in a single week, but the peak volume in 2016 was just over 12,000 airings and in 2012 was just of 10,000 airings.
Figure 1: U.S. House Race Airings by Week and Year
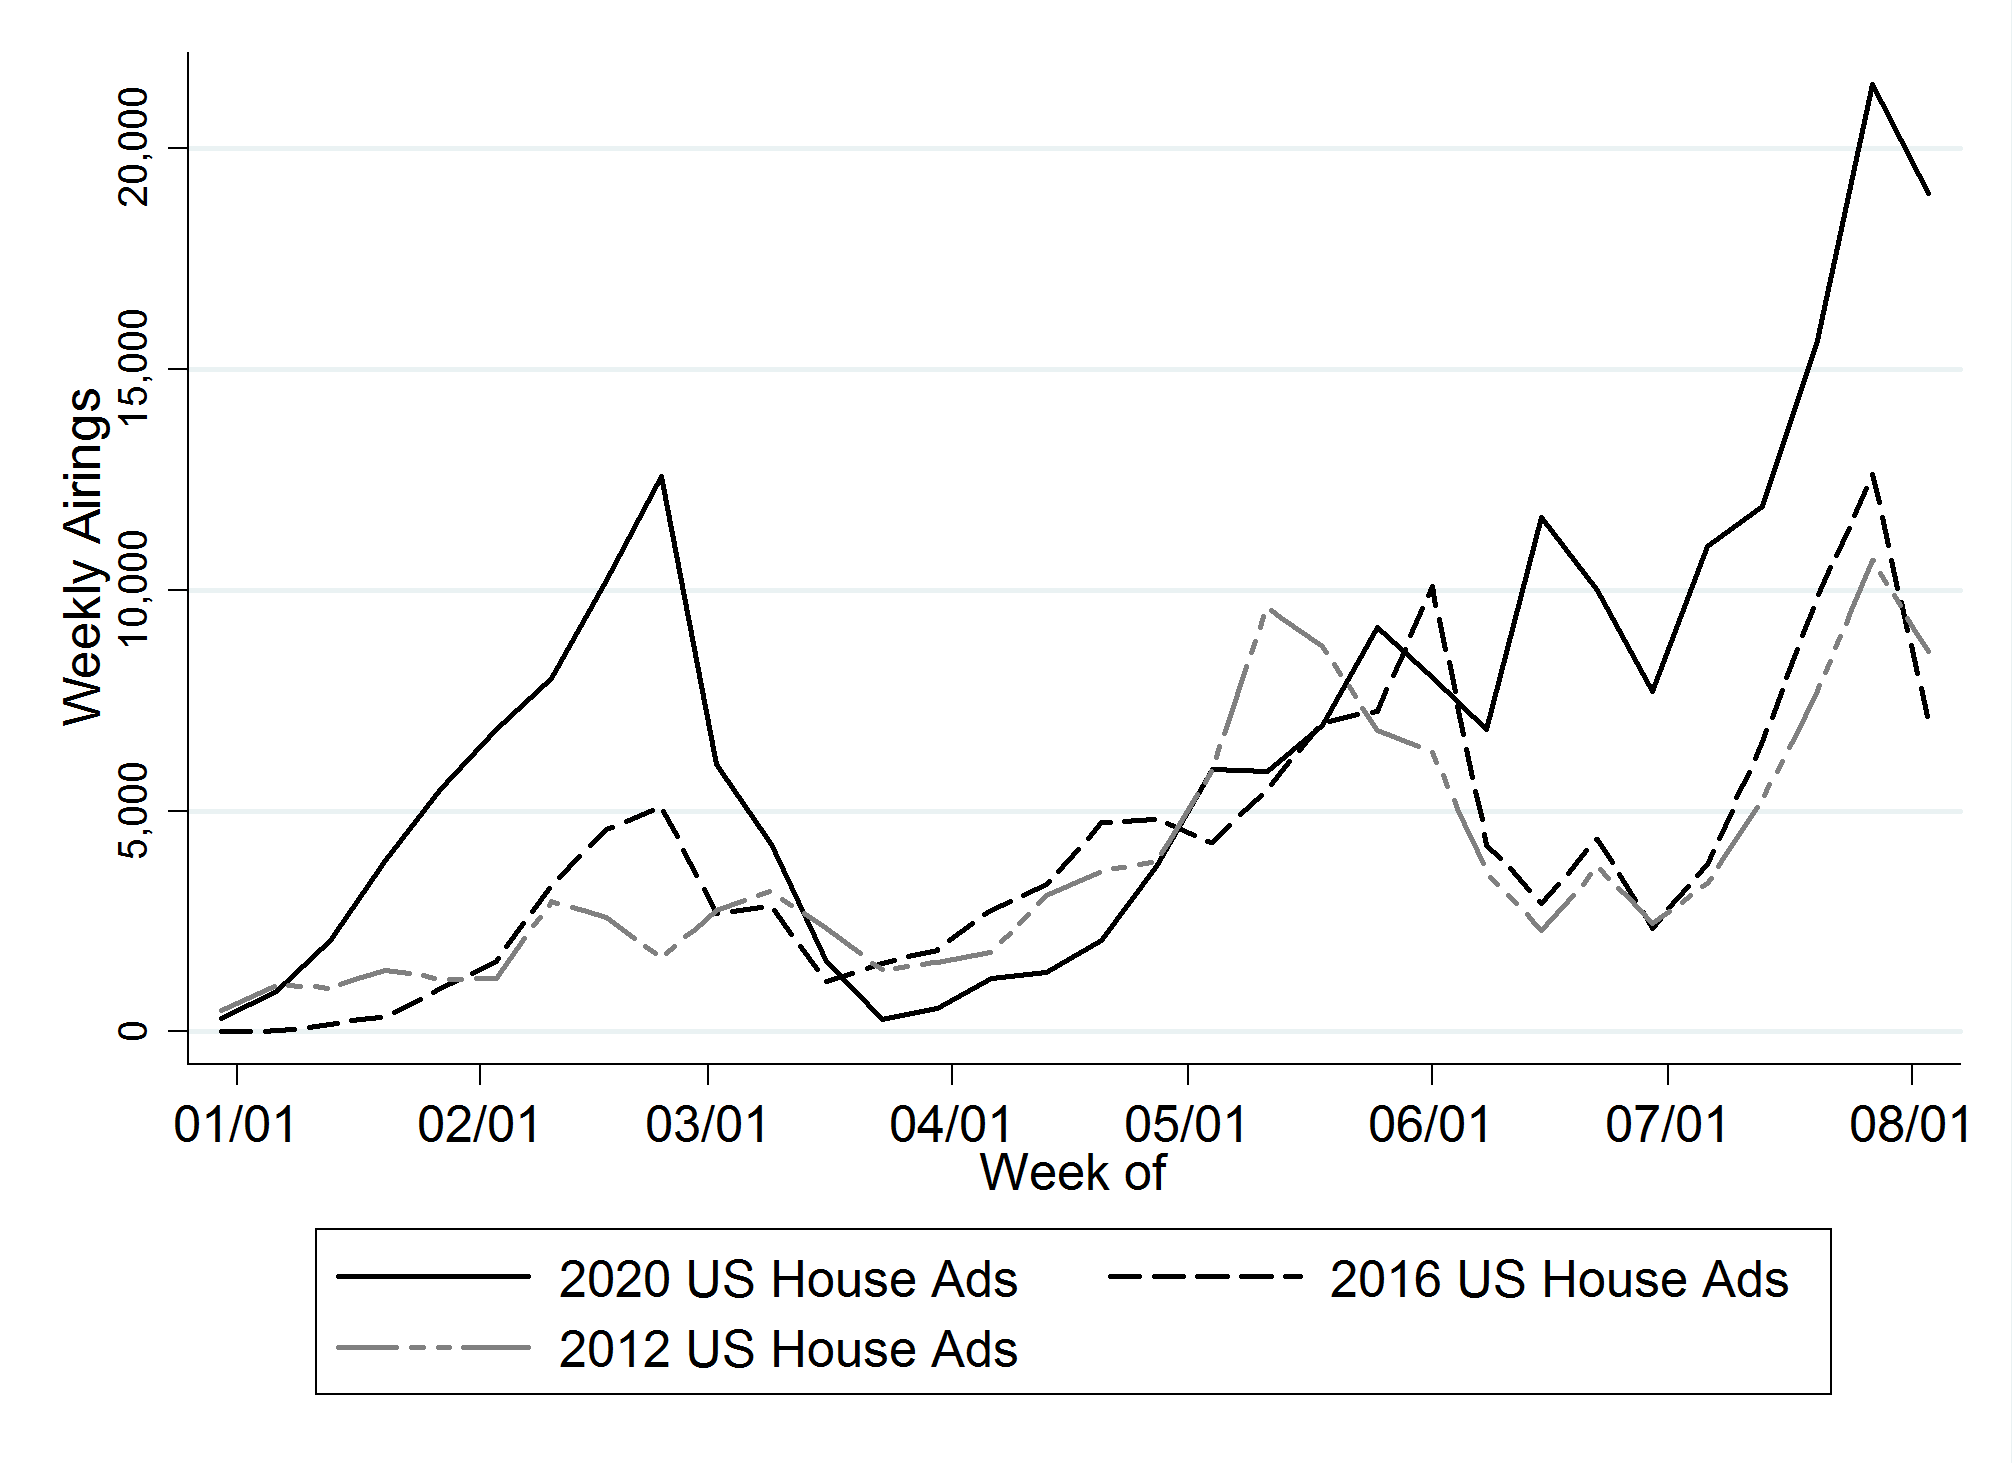
Numbers include ads aired on broadcast television between
January 1 of the election year and Aug 9.
CITE SOURCE OF DATA AS: Kantar/CMAG with analysis by the Wesleyan Media Project.
Figure 2 depicts the same data for U.S. Senate races. Again, the volume of U.S. Senate ads in 2020 is much higher than in the previous two election years, with that gap growing even wider over time.
“Clearly, television advertising in congressional races is way up in 2020 over the past two election cycles,” said Travis Ridout, co-director of the Wesleyan Media Project. “It’s hard to find a definitive reason for the increase, but it could have to do with the expectation that the Senate is up for grabs, or it could be a coronavirus effect. If campaigns can’t spend their money on holding rallies and hiring door-to-door canvassers, then they may have more money to devote to television.”
Figure 2: U.S. Senate Race Airings by Week and Year
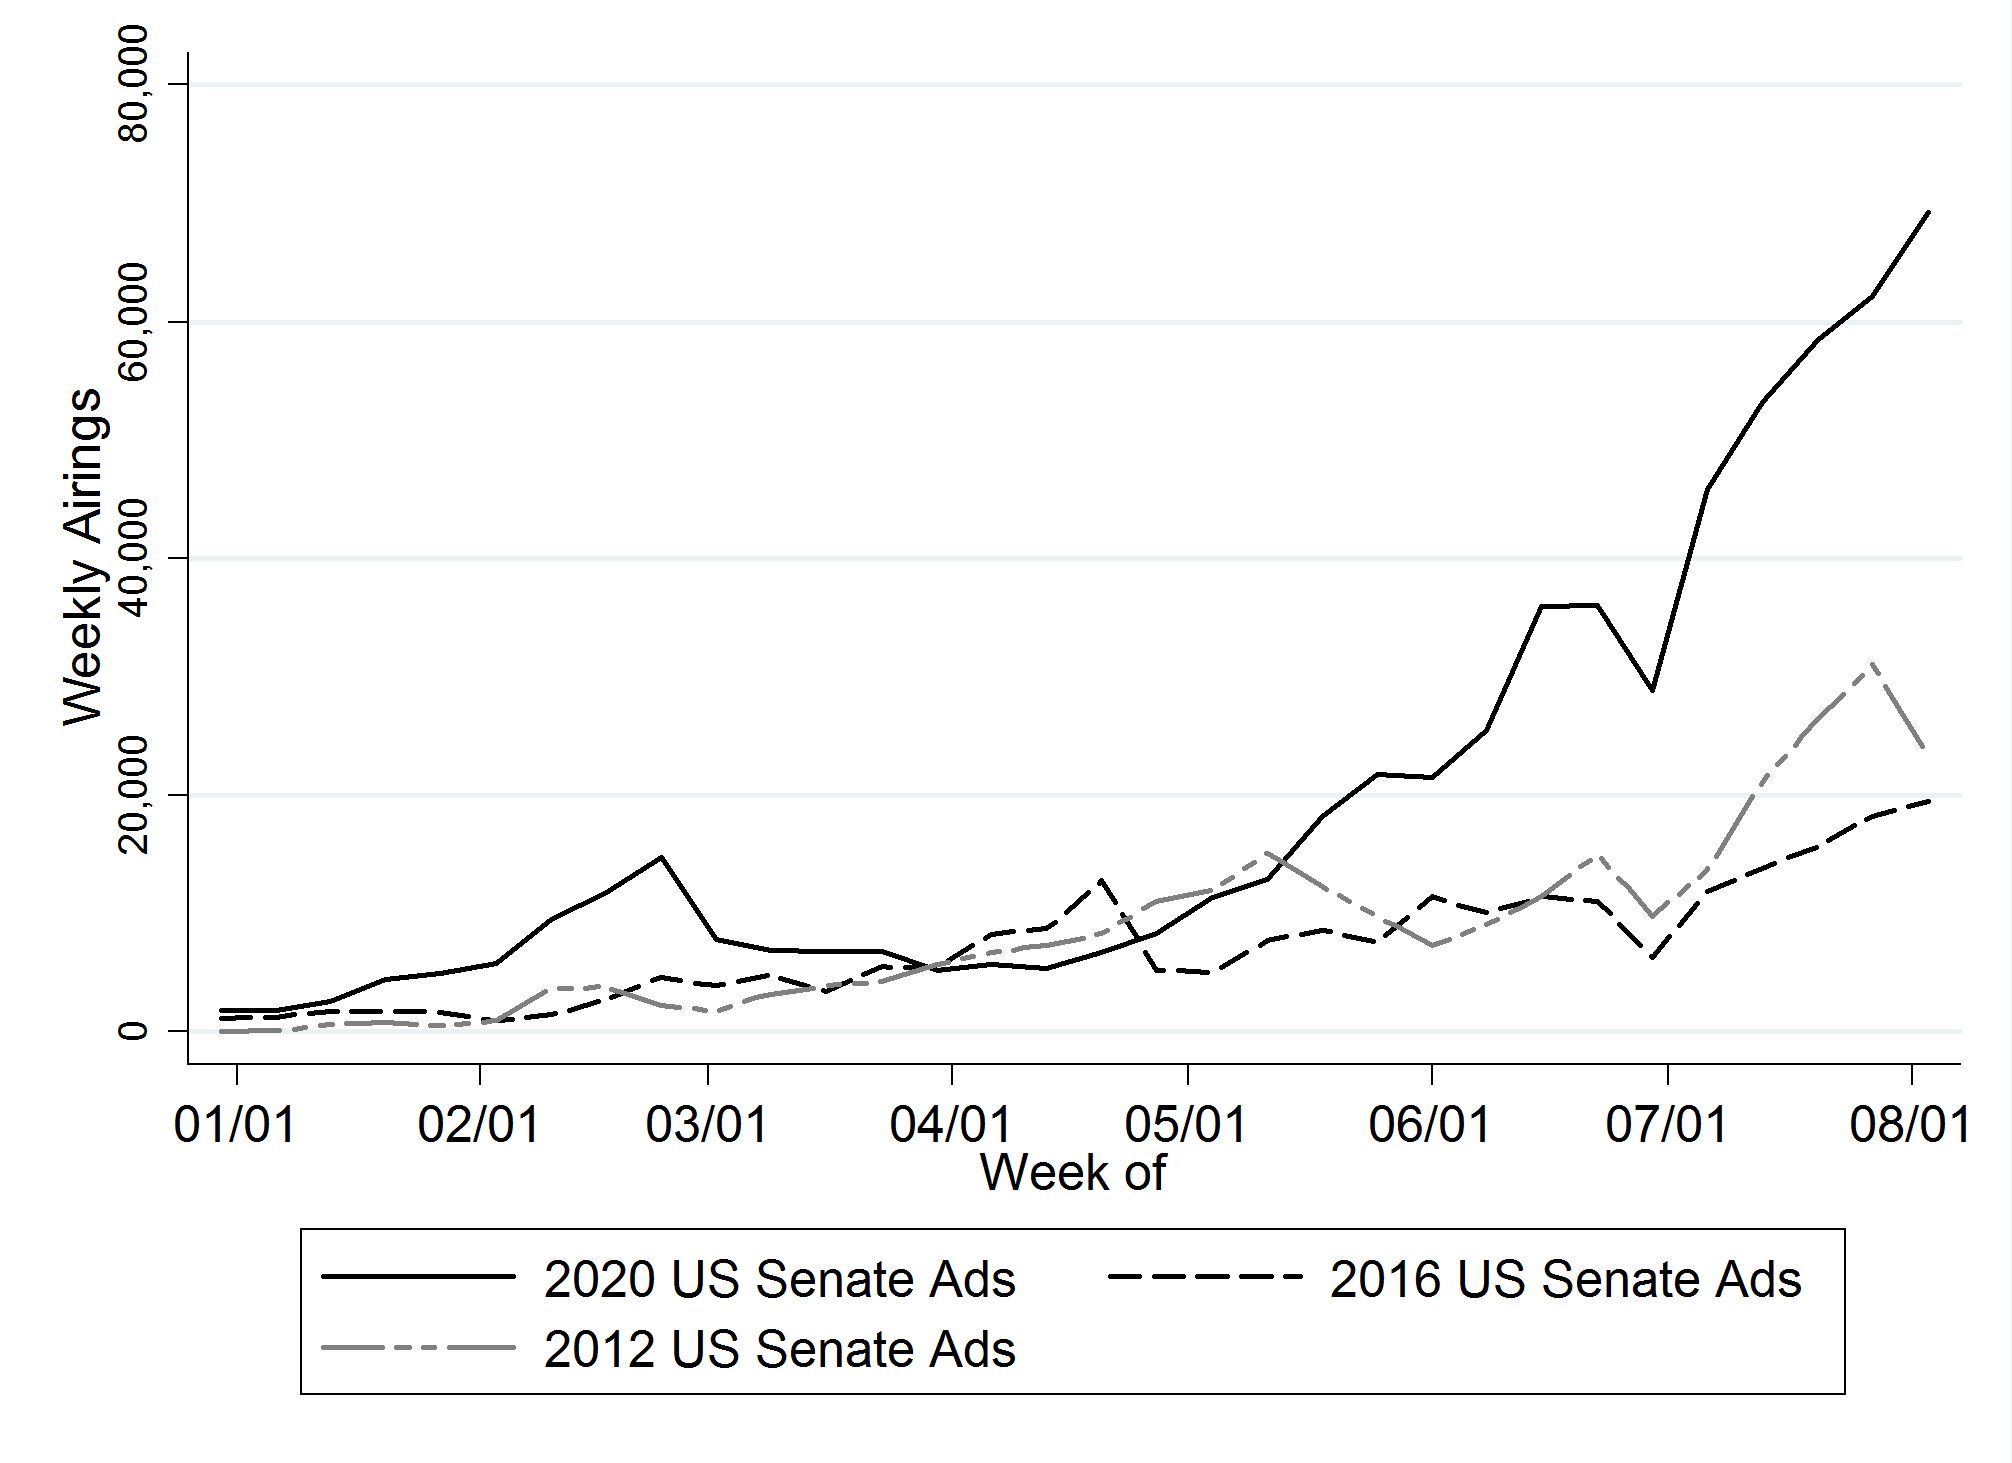
Numbers include ads aired on broadcast television between
January 1 of the election year and Aug 9.
CITE SOURCE OF DATA AS: Kantar/CMAG with analysis by the Wesleyan Media Project.
Ads Pile Up in GOP House Primaries
Table 2 shows the volume of ads aired in the top House races between July 15 and August 9, 2020. Republican primary contests in Tennessee’s first congressional district and Kansas’s first congressional district are at the top of the list, with over $1 million spend in the former. Other heavily contested races included New York-24, Florida-19 and Minnesota-05.
Table 2: Ad Airings and Spending in U.S. House by Race
| District | Airings | Cost ($) | Dem Cost ($) | Rep Cost ($) | Dem Airings | Rep Airings | Dem group | Rep group |
|---|---|---|---|---|---|---|---|---|
| TN01 | 8,258 | 1,459,990 | 0 | 1,459,990 | 0 | 8,258 | 0.0% | 12.2% |
| KS01 | 4,910 | 992,500 | 0 | 992,500 | 0 | 4,910 | 0.0% | 29.1% |
| NY24 | 3,528 | 918,400 | 517,650 | 400,750 | 1,978 | 1,550 | 8.2% | 29.4% |
| FL19 | 3,472 | 1,544,910 | 0 | 1,544,910 | 0 | 3,472 | 0.0% | 31.5% |
| MN05 | 3,317 | 2,887,120 | 2,326,030 | 561,090 | 2,775 | 542 | 18.2% | 100.0% |
| NM02 | 3,085 | 528,190 | 522,960 | 5,230 | 3,060 | 25 | 20.9% | 0.0% |
| MA01 | 2,695 | 736,250 | 736,250 | 0 | 2,695 | 0 | 25.9% | 0.0% |
| NY22 | 2,427 | 339,040 | 308,710 | 30,330 | 2,160 | 267 | 0.0% | 0.0% |
| FL03 | 2,152 | 440,620 | 0 | 440,620 | 0 | 2,152 | 0.0% | 0.0% |
| WA05 | 1,903 | 188,040 | 4,820 | 183,220 | 186 | 1,717 | 0.0% | 0.0% |
| OK05 | 1,756 | 570,890 | 380,000 | 190,890 | 1,098 | 658 | 21.3% | 5.2% |
| WA10 | 1,721 | 857,460 | 857,460 | 0 | 1,721 | 0 | 17.3% | 0.0% |
| SC01 | 1,668 | 407,130 | 407,130 | 0 | 1,668 | 0 | 9.0% | 0.0% |
| MA04 | 1,651 | 607,420 | 607,420 | 0 | 1,651 | 0 | 0.0% | 0.0% |
| VA02 | 1,177 | 341,760 | 341,760 | 0 | 1,177 | 0 | 17.2% | 0.0% |
| PA08 | 991 | 317,610 | 293,280 | 24,330 | 930 | 61 | 18.0% | 0.0% |
| CA21 | 954 | 216,090 | 216,090 | 0 | 954 | 0 | 100.0% | 0.0% |
| IA01 | 946 | 353,970 | 299,540 | 54,430 | 740 | 206 | 42.4% | 0.0% |
| KS03 | 851 | 345,170 | 0 | 345,170 | 0 | 851 | 0.0% | 9.0% |
| MO01 | 830 | 358,190 | 358,190 | 0 | 830 | 0 | 13.0% | 0.0% |
| Numbers include ads aired on broadcast television between July 15 and August 9, 2020. CITE SOURCE OF DATA AS: Kantar/CMAG with analysis by the Wesleyan Media Project. |
||||||||
Montana, Kansas Top Senate Races
Table 3 shows television ad airings and spending by party in U.S. Senate races. Montana tops the list, with over 41,000 ad airings starting July 15. Kansas, which saw a heated battle for the Republican nomination, saw $8.6 million of ad spending on 24,600 ad airings since mid-July. Tennessee, which held an August 6 primary, also saw considerable advertising, as did the tossup Senate race in Iowa.
Groups have been particularly involved in certain races. For instance, 74 percent of the pro-Democratic ads in North Carolina’s Senate race have been sponsored by groups.
Table 3: Ad Airings and Spending in U.S. Senate by Race
| State | Airings | Cost ($) | Dem Cost ($) | Rep Cost ($) | Dem Airings | Rep Airings | Dem Group | Rep Group |
|---|---|---|---|---|---|---|---|---|
| MT | 41,322 | 8,520,290 | 4,989,780 | 3,530,510 | 20,712 | 20,610 | 54.5% | 10.1% |
| KS | 24,615 | 8,651,460 | 604,800 | 8,046,660 | 3,238 | 21,377 | 0.0% | 63.1% |
| TN | 21,029 | 5,406,710 | 14,580 | 5,392,130 | 262 | 20,767 | 0.0% | 25.6% |
| IA | 20,415 | 9,049,310 | 5,063,140 | 3,977,710 | 12,405 | 7,991 | 63.5% | 34.9% |
| GA | 20,232 | 9,908,250 | 4,414,370 | 5,493,880 | 11,654 | 8,578 | 47.1% | 24.4% |
| NC | 15,465 | 12,874,840 | 7,805,870 | 5,016,800 | 10,387 | 4,999 | 74.0% | 42.2% |
| ME | 13,913 | 8,355,890 | 4,886,210 | 3,469,680 | 8,250 | 5,663 | 51.3% | 44.2% |
| SC | 12,157 | 3,508,480 | 2,781,940 | 726,540 | 9,432 | 2,725 | 0.0% | 0.0% |
| CO | 11,917 | 8,429,680 | 4,706,840 | 3,722,840 | 5,823 | 6,094 | 64.5% | 53.5% |
| AZ | 11,498 | 5,030,290 | 3,363,170 | 1,667,120 | 7,475 | 4,023 | 24.9% | 9.7% |
| AL | 9,343 | 2,854,820 | 638,630 | 2,216,190 | 3,627 | 5,716 | 0.0% | 99.9% |
| KY | 8,682 | 4,583,050 | 2,968,440 | 1,614,610 | 5,193 | 3,489 | 6.5% | 22.5% |
| AK | 4,080 | 614,060 | 263,950 | 73,410 | 1,550 | 776 | 100.0% | 0.0% |
| MI | 3,964 | 1,835,150 | 787,920 | 1,047,230 | 2,071 | 1,893 | 22.5% | 0.0% |
| MA | 3,776 | 2,206,000 | 2,206,000 | 0 | 3,776 | 0 | 16.8% | 0.0% |
| NM | 756 | 127,820 | 127,820 | 0 | 756 | 0 | 0.0% | 0.0% |
| NH | 572 | 289,840 | 289,840 | 0 | 572 | 0 | 0.0% | 0.0% |
| LA | 41 | 19,320 | 19,320 | 0 | 41 | 0 | 0.0% | 0.0% |
| NE | 30 | 6,040 | 0 | 0 | 0 | 0 | 0.0% | 0.0% |
| WV | 23 | 11,960 | 0 | 0 | 0 | 0 | 0.0% | 0.0% |
| SD | 10 | 900 | 900 | 0 | 10 | 0 | 0.0% | 0.0% |
| AR | 4 | 520 | 0 | 520 | 0 | 4 | 0.0% | 0.0% |
| TX | 4 | 1,320 | 1,320 | 0 | 4 | 0 | 100.0% | 0.0% |
| Numbers include ads aired on broadcast television between July 15 and August 9, 2020. CITE SOURCE OF DATA AS: Kantar/CMAG with analysis by the Wesleyan Media Project. |
||||||||
Pandemic Tops Dem House Ads; Reps Talk Taxes, Guns
Table 4 shows the most mentioned issues (the percentage of total ads that mention each issue) in both pro-Democratic and pro-Republican House ads that have aired since mid-July (these percentages include party, outside group and coordinated airings in addition to candidate-sponsored ones). Democrats’ top issue is the COVID pandemic, which appears in 30 percent of their ads. By contrast, the issue is mentioned in just 13 percent of Republicans’ ads. Business, health care and jobs are also mentioned frequently in pro-Democratic ads.
In pro-Republican ads, the most mentioned issues is taxes, which appears in 29 percent of ads, followed by gun control (25 percent) and business (18 percent). Immigration is also frequently mentioned, appearing in 17 percent of Republican House ads.
“Health care continues to be a big focus of federal airings with the exception of pro-Republican ads for U.S. House where it does not make the top ten topics,” said Erika Franklin Fowler, co-director of the Wesleyan Media Project. “It’s also notable that Medicaid, which typically doesn’t receive a lot of attention in federal campaign ads is being mentioned in one out of every ten airings on pro-Democratic side in U.S. Senate races.”
Table 4: Top Ten Issue Mentions in U.S. House Ads by Party Lean
| Pro-Dem House Airings | Pro-Rep House Airings | ||
|---|---|---|---|
| Issue | Percent | Issue | Percent |
| Infectious diseases (COVID-19) | 30.2% | Taxes | 28.8% |
| Business | 29.8% | Gun control/guns | 25.4% |
| Health care | 28.8% | Business | 17.7% |
| Jobs | 23.1% | Immigration | 17.3% |
| Transportation/infrastructure | 16.6% | Abortion | 16.8% |
| Recession/econ stimulus | 16.0% | Protests/riots | 15.3% |
| Military | 13.7% | Veterans | 12.8% |
| Energy policy | 13.1% | Infectious diseases (COVID-19) | 12.7% |
| Veterans | 10.9% | Moral/family/religious values | 10.4% |
| Education | 9.9% | Military | 9.5% |
| Numbers include ads aired on broadcast television between July 15 and August 9, 2020. CITE SOURCE OF DATA AS: Wesleyan Media Project coding of Kantar/CMAG data. |
|||
Table 5 provides the same information for U.S. Senate races. On the pro-Democratic side, the top issue is health care, followed by the pandemic, business and jobs. Republicans ads are talking the most about business, taxes, health care and jobs. The COVID-19 pandemic is mentioned in 16 percent of pro-Republican ads. Again, there is a clear party difference in the emphasis placed on the pandemic.
Table 5: Top Ten Issue Mentions in U.S. Senate Ads by Party Lean
| Pro-Dem Senate Airings | Pro-Rep Senate Airings | ||
|---|---|---|---|
| Issue | Percent | Issue | Percent |
| Health care | 45.9% | Business | 27.1% |
| Infectious diseases (COVID-19) | 36.4% | Taxes | 24.2% |
| Business | 26.2% | Health care | 23.2% |
| Jobs | 22.0% | Jobs | 19.3% |
| Campaign finance reform | 14.8% | Infectious diseases (COVID-19) | 15.9% |
| Health care expansion/access | 14.3% | Abortion | 13.7% |
| Prescription drugs | 12.0% | China | 13.7% |
| Medicare | 10.3% | Gun control/guns | 12.7% |
| Taxes | 9.9% | Economy (generic) | 12.3% |
| Medicaid | 9.3% | Protests/riots | 9.6% |
| Numbers include ads aired on broadcast television between July 15 and August 9, 2020. CITE SOURCE OF DATA AS: Wesleyan Media Project coding of Kantar/CMAG data. |
|||
Ads for U.S. House and U.S. Senate are also mentioning Trump but in very different ways by party. Whereas 12.6 percent of pro-Democratic ads mention Trump unfavorably, pro-Republican ads are touting the president favorably in one quarter of their airings (25.3 percent). Biden is mentioned in very few pro-Democratic airings (only 225 total, which represent fewer than one percent, all favorably), but four percent of pro-Republican airings (5,608 total) mention Biden unfavorably. Pro-Republican airings also reference former president Barack Obama unfavorably in 3.3 percent of airings and Hillary Clinton unfavorably in 2 percent of airings.
Groups Advertising in Several Senate Races
Outside groups have been very active in Senate campaigns, as Table 6 shows. Majority Forward, the liberal group, has spent $12.7 million in the past four weeks on behalf of Democratic candidates in Colorado, Georgia, Iowa, Maine, Montana and North Carolina—all states expected to be Senate battlegrounds (they have spent nearly $23.8 million on 40,749 ads across the full cycle). Majority Forward does not disclose its donors. The most active conservative group has been One Nation, which has pumped $8.9 million into ads supporting Republicans in ten different states (they have spent $16.6 million on 25,940 airings across the full cycle). Like Majority Forward, One Nation does not disclose its donors.
“Both parties are guilty of using dark money nonprofits to run thousands of advertisements this election cycle,” says Sarah Bryner, Director of Research and Strategy at the Center for Responsive Politics. “Voters don’t know who is paying for these ads, leaving them unable to consider the credibility and possible motives of the anonymous donors behind these groups.”
Table 6: Group Ad Airings and Spending in Senate Races
| Sponsor | Lean | Disclosure | Airings | Est. Spend | States |
|---|---|---|---|---|---|
| Majority Forward | L | no | 18,915 | 12,688,190 | CO, GA, IA, ME, MT, NC |
| One Nation | C | no | 14,558 | 8,885,780 | AL, AZ, CO, GA, IA, KS, KY, ME, MT, NC |
| Senate Majority PAC | L | partial | 10,617 | 5,517,550 | AZ, CO, IA, ME, MT, NC |
| Sunflower State Org | L | yes | 5,974 | 2,888,570 | KS |
| Duty and Honor | L | no | 4,953 | 2,881,840 | AZ, CO, GA, ME, MI, MT, NC |
| Club for Growth Action | C | yes | 3,540 | 1,210,010 | AL |
| The Lincoln Project | L | yes | 3,486 | 2,177,510 | AK, ME, MT |
| Plains PAC | L | yes | 3,051 | 1,312,290 | KS |
| Montana Federation of Public Employees | L | yes | 2,888 | 1,060,850 | MT |
| Standing with Conservatives | C | yes | 2,213 | 1,018,880 | TN |
| Senate Leadership Fund | C | yes | 2,073 | 1,344,720 | KS |
| End Citizens United | L | yes | 1,897 | 726,830 | IA |
| Unite for Colorado | C | no | 1,637 | 828,950 | CO |
| Conservative Outsider PAC | C | yes | 1,600 | 774,190 | TN |
| 1820 PAC | C | yes | 1,268 | 912,460 | ME |
| Free Forever PAC | C | yes | 1,201 | 561,580 | KS |
| Protect Freedom PAC | C | yes | 1,177 | 442,040 | TN |
| U.S. Chamber of Commerce | C | no | 891 | 762,930 | KS, ME |
| Advancing AZ | L | no | 601 | 405,850 | AZ |
| Georgia United Victory | C | yes | 481 | 353,890 | GA |
| Numbers include ads aired on broadcast television between July 15 and August 9, 2020. Group disclosure and ideology classifications provided by the Center for Responsive Politics. “L” indicates that the groups supports liberal/Democratic candidates, while “C” indicates the group supports conservative/Republican candidates. CITE SOURCE OF DATA AS: Kantar/CMAG with analysis by the Wesleyan Media Project. |
|||||
Dark Money Half of Congressional Ad Airings
Overall, about half of the spending in U.S. House and U.S. Senate races since mid-July has been from dark money groups—those that do not disclose their donors. Table 7 shows that in House races since July 15, 43 percent of spending and 51 percent of ad airings has been done by groups that do not disclose their donors. The most active dark money organizations in U.S. House races are House Majority Forward, which has spent $1.9 million on 4,199 ad airings during this period and nearly $8.8 million on 14,029 ads cycle-to-date, and American Action Network, which has spent nearly $1 million during on 1,772 ads during this period and over $7 million on 13,450 ads cycle-to-date.
In U.S. Senate races, 53 percent of ad spending and 49 percent of ad airings are from dark money groups.
Table 7: Ad Spending and Airings by Group Disclosure
| Est. Spend ($) | % Spend | Airings | % Airings | ||
|---|---|---|---|---|---|
| U.S. House | Full | 4,031,890 | 54% | 5,519 | 44% |
| Partial | 220,490 | 3% | 603 | 5% | |
| Dark | 3,222,040 | 43% | 6,464 | 51% | |
| Total | 7,474,420 | 12,586 | |||
| U.S. Senate | Full | 17,913,570 | 36% | 33,096 | 39% |
| Partial | 5,535,510 | 11% | 10,641 | 12% | |
| Dark | 26,807,310 | 53% | 42,136 | 49% | |
| Total | 50,256,390 | 85,873 | |||
| Numbers include ads aired on broadcast television between July 15 and August 9, 2020. CITE SOURCE OF DATA AS: Kantar/CMAG with analysis by the Wesleyan Media Project. Group disclosure classification provided by the Center for Responsive Politics. |
|||||
Senate Dem Challengers Top Digital Ad Spenders
Table 8 shows spending on digital ads by Senate candidate on the two most prominent platforms, Facebook and Google. Since mid-July, Jaime Harrison—a Democrat running in South Carolina—has spent $950,000 on the two platforms, and since early April, Harrison has spent $3.6 million. Another Democratic challenger, Mark Kelly in Arizona, has spent $670,000 on Facebook and Google since mid-July, while challenger Amy McGrath in Kentucky, has spent $570,000.
Table 8: Google and Facebook Spending by Candidates and Single Candidate SuperPAC Sponsors
| State | Party | Sponsor | FB (since Apr 9) | FB (since July 15) | Google (since Apr 12) | Google (since July 19) | FB+Google (since early Apr) | FB+Google (since mid-July) |
|
|---|---|---|---|---|---|---|---|---|---|
| AK | REP | Sullivan, Dan | 18,031 | 4,178 | 5,800 | 1,100 | 23,831 | 5,278 | |
| AK | IND | Gross, Al Dr. | 16,718 | 13,251 | 4,100 | 2,300 | 20,818 | 15,551 | |
| AL | DEM | Jones, Doug | 425,523 | 299,605 | 11,100 | 3,700 | 436,623 | 303,305 | |
| AL | REP | Tuberville, Thomas H | 71,440 | 13,642 | 3,100 | 200 | 74,540 | 13,842 | |
| AL | REP | Sessions, Jefferson B | 5,602 | 375 | 0 | 0 | 5,602 | 375 | |
| AR | REP | Cotton, Thomas | 43,885 | 4,547 | 7,900 | 0 | 51,785 | 4,547 | |
| AR | IND | Whitfield, Daniel Allen | 1,695 | 214 | 0 | 0 | 1,695 | 214 | |
| AZ | DEM | Kelly, Mark | 1,434,835 | 472,442 | 622,600 | 198,500 | 2,057,435 | 670,942 | |
| AZ | REP | Mcsally, Martha | 600,717 | 199,329 | 360,200 | 96,800 | 960,917 | 296,129 | |
| AZ | REP | McCarthy, Daniel | 20,421 | 4,836 | 0 | 0 | 20,421 | 4,836 | |
| CA | DEM | Harris, Kamala D | 0 | 0 | 9,700 | 0 | 9,700 | 0 | |
| CO | DEM | Hickenlooper, John W. | 489,287 | 64,831 | 395,000 | 43,500 | 884,287 | 108,331 | |
| CO | REP | Gardner, Cory | 171,237 | 59,700 | 68,000 | 28,800 | 239,237 | 88,500 | |
| CO | DEM | Let's Turn Colorado Blue | pro-Hickenlooper | 79,245 | 0 | 0 | 0 | 79,245 | 0 |
| CO | DEM | Romanoff, Andrew | 29,000 | 4 | 0 | 0 | 29,000 | 4 | |
| CO | UNK | Rodriguez, Joshua | 25 | 25 | 0 | 0 | 25 | 25 | |
| CO | DEM | Bennet, Michael F. | 19 | 19 | 0 | 0 | 19 | 19 | |
| DE | DEM | Coons, Christopher A. | 38,718 | 7,794 | 22,500 | 18,500 | 61,218 | 26,294 | |
| DE | DEM | Scarane, Jessica | 2,800 | 2,300 | 2,600 | 500 | 5,400 | 2,800 | |
| DE | REP | Witzke, Lauren Elena | 180 | 20 | 0 | 0 | 180 | 20 | |
| FL | REP | Scott, Rick Sen | 15,306 | 4,821 | 0 | 0 | 15,306 | 4,821 | |
| GA | DEM | Ossoff, T. Jonathan | 540,599 | 148,464 | 143,300 | 94,900 | 683,899 | 243,364 | |
| GA | DEM | Warnock, Raphael | 596,913 | 162,220 | 59,000 | 28,600 | 655,913 | 190,820 | |
| GA | REP | Collins, Douglas Allen | 202,350 | 52,801 | 67,200 | 27,100 | 269,550 | 79,901 | |
| GA | REP | Loeffler, Kelly | 146,784 | 27,240 | 54,300 | 5,400 | 201,084 | 32,640 | |
| GA | REP | Perdue, David | 67,255 | 21,467 | 27,400 | 9,700 | 94,655 | 31,167 | |
| GA | DEM | Lieberman, Matthew | 48,051 | 9,920 | 1,700 | 300 | 49,751 | 10,220 | |
| GA | DEM | Tarver, Edward J. | 8,708 | 1,810 | 1,000 | 100 | 9,708 | 1,910 | |
| GA | DEM | Tomlinson, Teresa Pike | 4,111 | 0 | 1,500 | 0 | 5,611 | 0 | |
| GA | REP | Johnson, Arthur Wayne | 2,078 | 754 | 0 | 0 | 2,078 | 754 | |
| GA | REP | Taylor, Kandiss Sharpe Dr | 1,192 | 959 | 0 | 0 | 1,192 | 959 | |
| GA | DEM | Johnson-Shealey, Tamara | 841 | 323 | 0 | 0 | 841 | 323 | |
| GA | REP | Grayson, Derrick E Rev | 403 | 79 | 0 | 0 | 403 | 79 | |
| GA | DEM | Riggs Amico, Sarah | 307 | 0 | 0 | 0 | 307 | 0 | |
| GA | REP | Stovall, Valencia | 184 | 184 | 0 | 0 | 184 | 184 | |
| GA | DEM | Dejesus, Marckeith | 149 | 0 | 0 | 0 | 149 | 0 | |
| GA | DEM | Winfield, Richard Dien | 86 | 0 | 0 | 0 | 86 | 0 | |
| IA | REP | Ernst, Joni K | 310,277 | 90,948 | 273,600 | 180,800 | 583,877 | 271,748 | |
| IA | DEM | Greenfield, Theresa | 152,878 | 46,718 | 340,600 | 99,200 | 493,478 | 145,918 | |
| IA | DEM | Franken, Michael | 88,011 | 0 | 0 | 0 | 88,011 | 0 | |
| IA | DEM | Mauro, Eddie J | 48,624 | 0 | 14,000 | 0 | 62,624 | 0 | |
| IA | DEM | Iowa Forward | anti-Ernst | 38,819 | 500 | 10,500 | 0 | 49,319 | 500 |
| IA | REP | Iowa Values | pro-Ernst | 12,325 | 0 | 0 | 0 | 12,325 | 0 |
| IA | IND | Herzog, Suzanne | 100 | 0 | 0 | 0 | 100 | 0 | |
| ID | DEM | Jordan, Paulette | 5,011 | 3,484 | 0 | 0 | 5,011 | 3,484 | |
| IL | DEM | Durbin, Richard J | 15,174 | 93 | 3,900 | 500 | 19,074 | 593 | |
| IL | REP | Curran, Mark | 4,041 | 388 | 0 | 0 | 4,041 | 388 | |
| IL | LIB | Malouf, Danny | 954 | 246 | 0 | 0 | 954 | 246 | |
| IL | OTH | Wilson, Willie | 292 | 292 | 0 | 0 | 292 | 292 | |
| KS | DEM | Bollier, Barbara | 98,290 | 42,955 | 216,200 | 100,000 | 314,490 | 142,955 | |
| KS | REP | Marshall, Roger W | 49,322 | 12,756 | 1,800 | 200 | 51,122 | 12,956 | |
| KS | REP | Lindstrom, David Alan | 29,579 | 9,790 | 0 | 0 | 29,579 | 9,790 | |
| KS | REP | Laturner, Jake | 27,061 | 12,186 | 0 | 0 | 27,061 | 12,186 | |
| KS | REP | Plains PAC | pro-Marshall | 15,570 | 13,084 | 17,100 | 12,300 | 32,670 | 25,384 |
| KS | REP | Free Forever PAC | pro-Kobach | 8,977 | 7,481 | 0 | 0 | 8,977 | 7,481 |
| KS | REP | Kobach, Kris | 5,615 | 1,726 | 100 | 0 | 5,715 | 1,726 | |
| KS | REP | Pruitt, Bryan | 949 | 949 | 0 | 0 | 949 | 949 | |
| KS | REP | Wagle, Susan | 200 | 0 | 0 | 0 | 200 | 0 | |
| KS | REP | Ellis, Derek C | 200 | 20 | 0 | 0 | 200 | 20 | |
| KS | REP | Matlock, Brian | 200 | 100 | 0 | 0 | 200 | 100 | |
| KS | DEM | Reddi, Usha | 50 | 0 | 0 | 0 | 50 | 0 | |
| KY | DEM | McGrath, Amy | 1,152,486 | 246,441 | 1,444,500 | 322,900 | 2,596,986 | 569,341 | |
| KY | REP | Mcconnell, Mitch | 1,256,162 | 252,317 | 636,700 | 84,900 | 1,892,862 | 337,217 | |
| KY | DEM | Booker, Charles | 995,492 | 0 | 116,200 | 0 | 1,111,692 | 0 | |
| KY | DEM | Ditch Fund | pro-McGrath | 219,083 | 15,190 | 0 | 0 | 219,083 | 15,190 |
| KY | DEM | Save America Fund | pro-McGrath | 104,683 | 17,991 | 0 | 0 | 104,683 | 17,991 |
| KY | DEM | Broihier, Michael George | 36,244 | 0 | 1,000 | 0 | 37,244 | 0 | |
| KY | DEM | Rothmuller, Eric | 800 | 0 | 0 | 0 | 800 | 0 | |
| KY | REP | Morgan, Clinton Wesley | 664 | 0 | 0 | 0 | 664 | 0 | |
| LA | REP | Cassidy, William M. | 2,414 | 2,414 | 0 | 0 | 2,414 | 2,414 | |
| LA | DEM | Perkins, Adrian | 0 | 0 | 2,300 | 2,300 | 2,300 | 2,300 | |
| LA | DEM | Pierce, Antoine | 1,630 | 339 | 0 | 0 | 1,630 | 339 | |
| LA | REP | Murphy, Dustin | 878 | 769 | 0 | 0 | 878 | 769 | |
| LA | REP | Conservative Louisiana | pro-Kennedy | 346 | 0 | 0 | 0 | 346 | 0 |
| MA | DEM | Kennedy, Joseph P Iii | 111,420 | 53,861 | 90,000 | 70,100 | 201,420 | 123,961 | |
| MA | DEM | Markey, Edward J. Sen. | 94,853 | 48,729 | 60,000 | 29,000 | 154,853 | 77,729 | |
| MA | DEM | United for Massachusetts | pro-Markey | 60,630 | 54,876 | 77,500 | 63,900 | 138,130 | 118,776 |
| MA | DEM | Environment America Action Fund | pro-Markey | 43,590 | 0 | 21,500 | 0 | 65,090 | 0 |
| MA | REP | Ayyadurai, Shiva Dr | 12,864 | 12,864 | 5,300 | 5,300 | 18,164 | 18,164 | |
| MA | REP | O'Connor, Kevin J | 362 | 147 | 0 | 0 | 362 | 147 | |
| MA | DEM | Liss-Riordan, Shannon Ms. | 0 | 0 | 300 | 0 | 300 | 0 | |
| MA | DEM | Pemberton, Steve | 48 | 0 | 0 | 0 | 48 | 0 | |
| ME | DEM | Gideon, Sara | 831,581 | 228,732 | 624,300 | 175,700 | 1,455,881 | 404,432 | |
| ME | REP | Collins, Susan M. | 304,603 | 87,546 | 69,100 | 27,900 | 373,703 | 115,446 | |
| ME | REP | 1820 PAC | pro-S. Collins | 17,050 | 9,400 | 18,700 | 6,400 | 35,750 | 15,800 |
| ME | DEM | Sweet, Betsy | 30,811 | 565 | 0 | 0 | 30,811 | 565 | |
| ME | UNK | Savage, Lisa Jill | 20 | 0 | 0 | 0 | 20 | 0 | |
| MI | DEM | Peters, Gary | 266,641 | 95,915 | 110,500 | 44,600 | 377,141 | 140,515 | |
| MI | REP | James, John | 127,604 | 34,255 | 28,700 | 11,600 | 156,304 | 45,855 | |
| MI | REP | Better Future Michigan | pro-James | 56,646 | 10,483 | 8,400 | 3,100 | 65,046 | 13,583 |
| MN | REP | Lewis, Jason | 141,662 | 32,161 | 15,400 | 6,900 | 157,062 | 39,061 | |
| MN | DEM | Smith, Tina | 37,052 | 10,520 | 4,100 | 1,400 | 41,152 | 11,920 | |
| MN | DEM | Klobuchar, Amy J. | 3,354 | 0 | 0 | 0 | 3,354 | 0 | |
| MN | REP | Barrett, Robert Paul Mr Jr. | 3,061 | 0 | 0 | 0 | 3,061 | 0 | |
| MS | DEM | Espy, Michael | 60,791 | 33,681 | 12,500 | 3,200 | 73,291 | 36,881 | |
| MT | REP | Daines, Steven | 1,102,491 | 272,361 | 574,300 | 181,100 | 1,676,791 | 453,461 | |
| MT | DEM | Bullock, Steve | 407,189 | 70,860 | 292,300 | 99,100 | 699,489 | 169,960 | |
| MT | DEM | Mues, John | 5,668 | 0 | 0 | 0 | 5,668 | 0 | |
| NC | DEM | Cunningham, Cal | 351,695 | 126,106 | 46,400 | 17,400 | 398,095 | 143,506 | |
| NC | REP | Tillis, Thom R. Sen. | 15,645 | 1,179 | 152,000 | 22,100 | 167,645 | 23,279 | |
| NC | REP | Smith, Sandy | 4,573 | 849 | 0 | 0 | 4,573 | 849 | |
| NE | REP | Sasse, Benjamin E | 18,422 | 0 | 13,300 | 0 | 31,722 | 0 | |
| NE | DEM | Janicek, Chris Edward Mr | 4,204 | 0 | 0 | 0 | 4,204 | 0 | |
| NE | DEM | Macek, Dennis Frank | 2,322 | 0 | 0 | 0 | 2,322 | 0 | |
| NE | DEM | Shelton, Alisha | 93 | 5 | 0 | 0 | 93 | 5 | |
| NH | REP | Messner, Bryant 'Corky' S. | 37,480 | 14,745 | 4,500 | 300 | 41,980 | 15,045 | |
| NH | DEM | Shaheen, Jeanne | 16,318 | 11,065 | 8,300 | 2,100 | 24,618 | 13,165 | |
| NH | REP | Bolduc, Donald C. | 2,205 | 349 | 0 | 0 | 2,205 | 349 | |
| NJ | DEM | Booker, Cory A. | 64,577 | 24,459 | 0 | 0 | 64,577 | 24,459 | |
| NJ | REP | Singh, Hirsh V | 15,672 | 0 | 0 | 0 | 15,672 | 0 | |
| NJ | DEM | Hamm, Lawrence Mr. | 4,916 | 0 | 0 | 0 | 4,916 | 0 | |
| NJ | REP | Mehta, Rikin | 2,526 | 0 | 0 | 0 | 2,526 | 0 | |
| NJ | IND | Fernandez, Veronica | 1,451 | 56 | 0 | 0 | 1,451 | 56 | |
| NJ | IND | Burke, Daniel C. Mr. | 261 | 161 | 0 | 0 | 261 | 161 | |
| NM | DEM | Lujan, Ben Ray | 30,709 | 10,448 | 3,600 | 3,000 | 34,309 | 13,448 | |
| NM | REP | Ronchetti, Mark V. | 9,674 | 2,486 | 1,900 | 300 | 11,574 | 2,786 | |
| NM | REP | Clarkson, Gavin | 7,783 | 0 | 0 | 0 | 7,783 | 0 | |
| NM | REP | Martinez, Elisa | 5,270 | 0 | 0 | 0 | 5,270 | 0 | |
| NY | DEM | Gillibrand, Kirsten | 70,863 | 23,058 | 0 | 0 | 70,863 | 23,058 | |
| OK | DEM | Broyles, Abby | 63,102 | 803 | 4,600 | 0 | 67,702 | 803 | |
| OK | REP | Inhofe, James M. Sen. | 7,210 | 1,087 | 700 | 0 | 7,910 | 1,087 | |
| OK | REP | Mavis, Neil J Mr. | 7,341 | 0 | 0 | 0 | 7,341 | 0 | |
| OK | REP | Stitt, Jj Mr. | 1,001 | 0 | 0 | 0 | 1,001 | 0 | |
| OK | DEM | Britt, Elysabeth | 735 | 0 | 0 | 0 | 735 | 0 | |
| OR | DEM | Merkley, Jeffrey Alan | 101,643 | 21,422 | 0 | 0 | 101,643 | 21,422 | |
| OR | GRE | Taher, Ibrahim | 213 | 100 | 0 | 0 | 213 | 100 | |
| OR | REP | Perkins, Jo Rae | 160 | 50 | 0 | 0 | 160 | 50 | |
| RI | REP | Waters, Allen | 1,963 | 373 | 0 | 0 | 1,963 | 373 | |
| SC | DEM | Harrison, Jaime | 2,681,973 | 606,920 | 969,200 | 344,500 | 3,651,173 | 951,420 | |
| SC | REP | Graham, Lindsey O. | 1,388,778 | 338,299 | 255,200 | 58,800 | 1,643,978 | 397,099 | |
| SC | REP | Lapierre, Michael James | 14,469 | 0 | 0 | 0 | 14,469 | 0 | |
| SC | REP | Reynolds, Joseph | 6,054 | 0 | 0 | 0 | 6,054 | 0 | |
| SC | REP | Buckner, Dwayne Duke | 921 | 0 | 0 | 0 | 921 | 0 | |
| SC | REP | Security is Strength | pro-Graham | 750 | 0 | 0 | 0 | 750 | 0 |
| SC | REP | Williams, Lloyd Benton Mr. Iii | 200 | 0 | 0 | 0 | 200 | 0 | |
| SD | REP | Rounds, Mike | 7,005 | 0 | 0 | 0 | 7,005 | 0 | |
| SD | REP | Borglum, Scyller | 1,761 | 0 | 0 | 0 | 1,761 | 0 | |
| SD | DEM | Ahlers, Dan | 340 | 10 | 800 | 800 | 1,140 | 810 | |
| TN | REP | Hagerty, Bill | 134,351 | 49,539 | 180,300 | 124,700 | 314,651 | 174,239 | |
| TN | REP | Sethi, Dr. Manny | 60,590 | 21,918 | 40,300 | 12,100 | 100,890 | 34,018 | |
| TN | REP | Flinn, George S Dr Jr | 41,832 | 17,964 | 0 | 0 | 41,832 | 17,964 | |
| TN | DEM | Mackler, James | 15,717 | 14,907 | 12,800 | 6,600 | 28,517 | 21,507 | |
| TN | REP | Bush, Byron | 2,545 | 1,335 | 4,700 | 2,300 | 7,245 | 3,635 | |
| TN | REP | Cope, Roy Dale | 1,372 | 563 | 0 | 0 | 1,372 | 563 | |
| TN | REP | Osborne, John E. | 0 | 0 | 1,200 | 700 | 1,200 | 700 | |
| TN | REP | Henry, Jon | 200 | 0 | 0 | 0 | 200 | 0 | |
| TN | IND | Hill, Garland Dean Ii | 156 | 56 | 0 | 0 | 156 | 56 | |
| TN | IND | Mcleod, Elizabeth D | 130 | 0 | 0 | 0 | 130 | 0 | |
| TX | REP | Cornyn, John Sen | 457,827 | 213,579 | 61,700 | 3,700 | 519,527 | 217,279 | |
| TX | DEM | Hegar, Mary Jennings Mj | 98,615 | 54,778 | 39,000 | 13,700 | 137,615 | 68,478 | |
| TX | DEM | West, Royce | 50,025 | 2,170 | 0 | 0 | 50,025 | 2,170 | |
| TX | REP | Castro, John Anthony | 2,625 | 0 | 0 | 0 | 2,625 | 0 | |
| TX | DEM | Tzintzun Ramirez, Cristina | 100 | 0 | 0 | 0 | 100 | 0 | |
| TX | REP | Stovall, Dwayne | 100 | 0 | 0 | 0 | 100 | 0 | |
| VA | DEM | Warner, Mark Robert | 31,013 | 0 | 1,500 | 600 | 32,513 | 600 | |
| VA | REP | Gade, Daniel Macarthur Mr. | 16,589 | 8,172 | 5,200 | 3,000 | 21,789 | 11,172 | |
| VA | REP | Speciale, Thomas A Ii | 2,315 | 0 | 0 | 0 | 2,315 | 0 | |
| VA | REP | Baldwin, Alissa | 2,115 | 0 | 0 | 0 | 2,115 | 0 | |
| WV | DEM | Swearengin, Paula Jean | 56,920 | 8,312 | 0 | 0 | 56,920 | 8,312 | |
| WV | REP | Whitt, Larry Allen Ii | 1,900 | 0 | 0 | 0 | 1,900 | 0 | |
| WY | REP | Lummis, Cynthia Marie | 27,118 | 6,870 | 10,300 | 3,200 | 37,418 | 10,070 | |
| WY | REP | Miller, Bryan | 2,535 | 1,508 | 0 | 0 | 2,535 | 1,508 | |
| WY | DEM | Ben David, Merav | 1,076 | 510 | 0 | 0 | 1,076 | 510 | |
| WY | REP | Wheeler, Joshua B | 820 | 246 | 0 | 0 | 820 | 246 | |
| Digital spending figures come from the Facebook ad library reports and the Google Transparency Report. Spending covers the April 9 or July 15 to August 8, 2020 (for Facebook); April 12 or July 19 to August 8, 2020 (for Google). Spenders include 2020 U.S. Senate candidates, leadership PACs, and single-candidate super PACs in support of (or in opposition to) those candidates. Single-candidate super PAC identifications are from the Center for Responsive Politics. Classifications of Senate candidates from the Wesleyan Media Project with help from the Center for Responsive Politics. See “About the Data” section at the end of this report for more information on our methodology along with the specific page names and disclaimers that are counted. |
|||||||||
Additional page names (including other outside groups) mentioning senatorial (and presidential) candidates on Facebook can be investigated through the help of the Wesleyan Media Project’s student-driven Delta Lab via our interactive table, Table 9.
Table 9: Facebook Pages Mentioning Candidates for President and Senate in 2020
Click here to view the table in a new tab (with larger text)
Table includes Facebook page names spending approximately $25,000 or more on advertising that mentions 2020 presidential or senatorial candidates (excluding candidate self-references) between April 9 and August 8, 2020, or pages spending approximately $5,000 or more on advertising between July 15 and August 8, 2020. This interactive table is part of an ongoing, work-in-progress project from WMP’s student-driven Delta Lab. Data table by Delta Lab’s Kevin McMorrow (’20).
New Tool: Assessing Regional Focus of Facebook Ads
The Wesleyan Media Project’s Delta Lab is thrilled to release a new tool designed to help assess the regional focus of Facebook advertising by different outside groups and the presidential campaigns. With a dynamic slider for time, actual spend by state viewable in a mouseover, and the ability to compare two entities, we can see clearly, for example, that the Democratic Senatorial Campaign Committee (DSCC) has been spending most heavily on Facebook ads viewed in New York, Texas, Florida and California (all between $80,000 and $90,000) over the last four weeks whereas the National Republican Senatorial Committee (NRSC) has been most heavily spending in Georgia (nearly $90,000 spent) followed by Montana, Texas and Florida, which saw spending in the low to mid $60,000s.
Figure 3: Regional Focus of Facebook Advertising by Top Sponsors Over Time
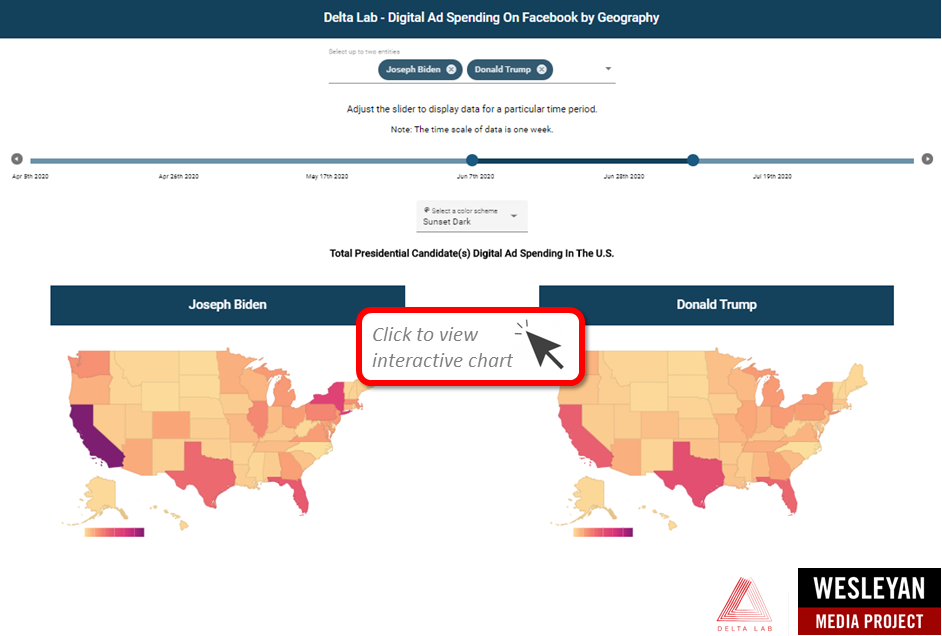
Digital spending comes from the Facebook ad library reports. Data visualization application by Delta Lab’s Roshaan Siddiqui (’22). Classifications from the Wesleyan Media Project with help from the Center for Responsive Politics.
If we compare Majority Forward and One Nation, two of the largest outside spenders on television, for the period from July 12 through August 8, 2020, we see that Majority Forward is concentrating on Montana and Iowa (both have over $100,000 in spending) followed by Colorado, Georgia and North Carolina, each with about half that amount. Small amounts of money (roughly $300 to $400) have been spent in each of the other 45 states during the same period. One Nation, by contrast, has also spent heavily in Colorado and North Carolina (roughly $40,000 each), followed by Iowa, Maine and Georgia at about half that amount. Montana, Alabama and Kentucky are in the next spending tier (ranging from $8,000 to $13,000) and then Arizona (roughly $4,000) followed distantly by Iowa ($230). No other U.S. states have seen any One Nation Facebook ads.
Read more about how we gather the data displayed in it on our Delta Lab post here.
About the Data
For the television ad totals, data reported here are from Kantar/CMAG and do not cover local cable buys, only broadcast television, national network and national cable advertising.
For Facebook ads, data come from the aggregate reports, but our figures are more comprehensive than what Facebook reports on their campaign page because we include spending on ads that are funded by the campaigns even when they run on different pages in our totals (e.g., Trump funded ads on Mike Pence or Brad Parscale’s pages are included in the Trump totalsWe looked for pages attached to each candidate, including possible leadership PACs, joint-fund-raising committees, and, in the case of presidential candidates, affiliated Senate/House pages. Aggregate report entries are provided for each page name and disclaimer combination. Totals for most of this report on spending between April 9, 2020 (or July 15, 2020) and August 8, 2020 are calculated by subtracting the reported cumulative spending (as reported by Facebook as the total spent since May 2018) for the August 8, 2020 report and subtracting off the cumulative spending reported for April 8, 2020 (or July 14, 2020).
In Table 9, the columns Approximate Spend on Mentions and Number of Ads Mentioning candidates are calculated for each entity by averaging the bounds of ads that mention candidates and averaging the bounds of all ads from that entity, then dividing the two to get the proportion of spend (or ads) that mention candidates. We then multiply that proportion by Facebook’s totals from the daily reports to arrive at the Approximate Spend on Mentions and the Number of Ads Mentioning candidates.
Calculating cycle-to-date Facebook totals is more challenging than looking at totals from the last couple of months. In early January 2019, Facebook did not include page IDs (a unique identifier) for each entry in the aggregate report. Because pages can have the same name, a unique identifier for each page would be required to definitively identify an aggregate report entry, which Facebook does not provide going backward. Therefore, we did our best to associate each entry in the January 5, 2019, report with a page ID, which we had access to through the library API. There may be some slippage if two pages associated with candidates had identical names and disclaimers, but we believe these instances are rare for the set of ads covered in this report. For cycle-to-date spending, we subtracted the January 5, 2019 total from the August 8, 2020 total to get the spending by page and disclaimer for January 6, 2019 through August 8, 2020. We also report spending from April 9, 2020 through August 8, 2020 and July 15, 2020 through August 8, 2020. We rely on a Delta Lab monitoring tool to identify and avoid using days on which Facebook has a problem with the aggregated spending report.
Pages can sponsor ads that are funded by different entities. We made the assumption that all spending by federal office-holders running for president this cycle (e.g., Cory Booker) was in support of their presidential campaign up until they date they dropped out of the presidential race (if applicable), even if some spending was reported from their House or Senate page or leadership PAC, especially because many of the leadership PAC spending occurred on the same pages as the campaign spending. Advertisements run by pages known to be associated with presidential candidates are included even in instances where the ads ran without an appropriate disclaimer.
In Table A (click here to download), we list the page names/disclaimer rows from the Facebook aggregate reports that we identified for this report. It is possible that we missed some spending from a Facebook page affiliated with a candidate running for office. This is exacerbated by the absence of EIN or FEC identifiers in the Facebook reports.
For Google ads, we downloaded the weekly reports from the platform’s Transparency Report. As a matter of practice with all of the platform data, we try to replicate our prior spending figures when we are calculating numbers for a new release. In that process, we discovered discrepancies between the data we downloaded in November and the information available in the December download for the same dates, which persists in May. Based on conversations with Google, we believe the discrepancies are partially but not exclusively due to the addition of advertisers targeting state-level races. We are working on a process to report these discrepancies, but the totals reflected in this release are current as of 8/11/20, the day on which we pulled the transparency report. Google only includes spending in federal and state races and only includes weekly totals but lists the sponsor’s EIN or FEC committee ID. We searched the list of advertisers for presidential candidates and affiliated leadership PACs and joint-fund-raising committees, and candidates for U.S Senate and affiliated single-candidate super PACs. We made the same assumption as with the Facebook data about any spending from House and Senate campaign committees by declared presidential candidates. Google spending is from the following time periods: January 6, 2020 through August 8, 2020; April 12, 2020 through August 8, 2020; and July 19, 2020 through August 8, 2020.
In Table B (click here to download), we list the advertiser name for all entities used in this report to calculate Google spending totals.
About This Report
The Wesleyan Media Project (WMP) provides real-time tracking and analysis of political advertising in an effort to increase transparency in elections. Housed in Wesleyan’s Quantitative Analysis Center (QAC) – part of the Allbritton Center for the Study of Public Life – the Wesleyan Media Project is the successor to the Wisconsin Advertising Project, which disbanded in 2009. It is directed by Erika Franklin Fowler, associate professor of government at Wesleyan University, Michael M. Franz, professor of government at Bowdoin College and Travis N. Ridout, professor of political science at Washington State University. WMP personnel include Laura Baum (Project Manager), Colleen Bogucki (Project Coordinator), Pavel Oleinikov (Associate Director, QAC), Markus Neumann (Post-Doctoral Fellow), and Jielu Yao (Post-Doctoral Fellow).
The Wesleyan Media Project’s digital advertising tracking is supported by the contributions of students in Delta Lab, an interdisciplinary research collaborative focusing on computationally-driven and innovative analyses and visualizations of media messaging. We especially thank Kevin McMorrow ‘20 and Roshaan Siddiqui ‘22 for their contributions to this report.
The Wesleyan Media Project is supported by Wesleyan University, the John S. and James L. Knight Foundation, and the Democracy Fund. WMP is partnering again this year with the Center for Responsive Politics, to provide added information on outside group disclosure.
Periodic releases of data will be posted on the project’s website and dispersed via Twitter @wesmediaproject. To be added to our email update list, click here.
For more information contact: Lauren Rubenstein, lrubenstein@wesleyan.edu, (860) 685-3813 or (203) 644-7144
About Wesleyan University Wesleyan University, in Middletown, Conn., is known for the excellence of its academic and co-curricular programs. With more than 2,900 undergraduates and 200 graduate students, Wesleyan is dedicated to providing a liberal arts education characterized by boldness, rigor and practical idealism. For more, visit wesleyan.edu.
About the John S. and James L. Knight Foundation Knight Foundation is a national foundation with strong local roots. We invest in journalism, in the arts, and in the success of cities where brothers John S. and James L. Knight once published newspapers. Our goal is to foster informed and engaged communities, which we believe are essential for a healthy democracy.
About Democracy Fund Created by eBay founder and philanthropist Pierre Omidyar, Democracy Fund is a foundation helping to ensure that our political system can withstand new challenges and deliver on its promise to the American people. Democracy Fund has invested more than $125 million in support of a healthy, resilient, and diverse democracy with a particular focus on modern elections, effective governance, and a vibrant public square.


