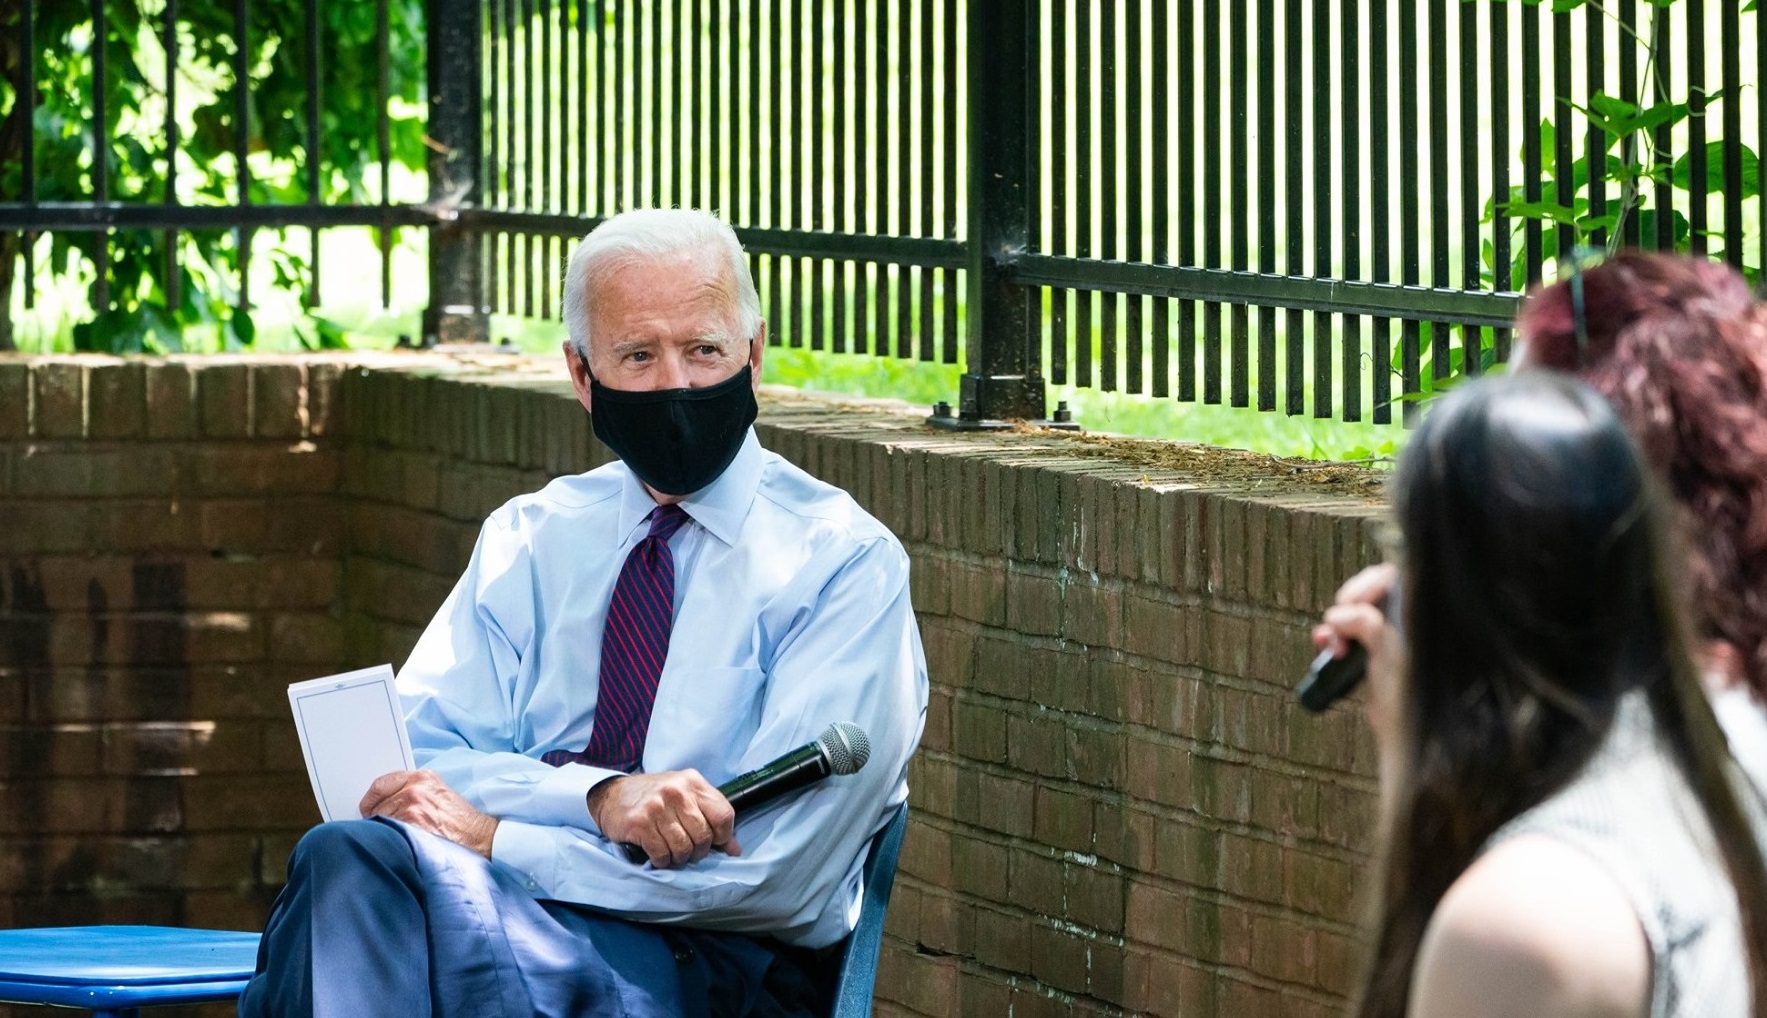
Photo: Joe Biden Campaign
Presidential Ad War Tightens as Biden Closes the Gap on TV; Trump Continues to Dominate Digital
(MIDDLETOWN, CT) August 12, 2020 – A new analysis from the Wesleyan Media Project, in partnership with the Center for Responsive Politics, shows a presidential race that is fairly balanced when it comes to the ad war on television in the period leading up to Biden announcing his pick for vice president. Since July 14, Joe Biden’s campaign, along with pro-Biden advertisers, has aired about 54,000 ads compared to 63,000 ads for Donald Trump and his group allies (Table 1). But the amount spent on pro-Biden advertising, an estimated $40 million, was actually higher than the amount spent on pro-Trump advertising, an estimated $32 million. This discrepancy in spending suggests that the Biden ads may be reaching more viewers than the Trump ads.
This relatively even ad race on television since mid-July is a contrast from earlier in the campaign when Trump had a considerable ad advantage. Overall, in the general election period (starting April 9, the day after Bernie Sanders dropped out, and ending August 9), for instance, there were 83,000 more pro-Trump than pro-Biden ads, and spending on pro-Trump ads was $23 million greater. Outside groups represent a smaller proportion of activity in the recent period (25 percent compared to 32 percent in the general election overall) in part due to the Biden campaign spending more on advertising and pro-Biden groups decreasing their share of advertising activity.
Note that there has been minimal spending by the political parties, with just $47,000 in party-candidate coordinated expenditures on the Democratic side.
Click here to see our recent report on congressional advertising covering the same time periods.
Table 1: TV Ad Airings and Spending by Pro-Biden and Pro-Trump Advertisers (Since April 8 and July 14)
| Candidate | Party | Party-Candidate Coordinated | Groups | Total | |
|---|---|---|---|---|---|
| Since April 8 | |||||
| Pro-Biden | |||||
| Ads Aired | 50,390 | 0 | 121 | 50,879 | 101,390 |
| Cost ($) | 39,449,500 | 0 | 47,280 | 32,591,860 | 72,088,640 |
| Pro-Trump | |||||
| Ads Aired | 145,014 | 0 | 0 | 39,305 | 184,319 |
| Cost ($) | 76,888,430 | 0 | 0 | 18,693,790 | 95,582,220 |
| Since July 14 | |||||
| Pro-Biden | |||||
| Ads Aired | 39,145 | 0 | 121 | 14,599 | 53,865 |
| Cost ($) | 29,106,580 | 0 | 47,280 | 11,241,420 | 40,395,280 |
| Pro-Trump | |||||
| Ads Aired | 48,401 | 0 | 0 | 14,469 | 62,870 |
| Cost ($) | 22,277,530 | 0 | 0 | 9,690,460 | 31,967,990 |
| Numbers include ads aired on broadcast television and national cable between April 9 and August 9, 2020, and between July 15 and August 9, 2020. CITE SOURCE OF DATA AS: Kantar/CMAG with analysis by the Wesleyan Media Project. |
|||||
Groups Spend $51 million in Presidential General Election
About $51 million in television ad spending in the presidential general election race has come from group sponsors, constituting about 90,000 ad airings. The top group spender on television since April 8 has been Priorities USA Action, a pro-Democratic group, with $13.6 million in spending. Close behind is the pro-Republican group America First Action, with $12.8 million in spending. AB PAC, another pro-Biden, anti-Trump group, has put almost $8.5 million into the presidential race.
Table 2: Top Group Spenders in Presidential Race
| Group | Lean | Airings | Spending ($) |
|---|---|---|---|
| Priorities USA Action | Dem | 25,567 | 13,621,150 |
| America First Action | Rep | 27,669 | 12,832,640 |
| AB PAC | Dem | 11,839 | 8,466,170 |
| Unite the Country | Dem | 5,837 | 4,239,110 |
| Restoration PAC | Rep | 2,718 | 3,531,420 |
| Protect Our Care | Dem | 3,710 | 1,876,340 |
| America First Policies, Inc. | Rep | 8,560 | 1,804,390 |
| The Lincoln Project | Dem | 1,031 | 1,181,800 |
| EDF Action Votes | Dem | 729 | 1,008,710 |
| Nuestro PAC | Dem | 776 | 590,930 |
| Future Forward USA PAC | Dem | 576 | 532,790 |
| Americans for Limited Government | Dem | 520 | 531,380 |
| Committee to Defend the President | Rep | 357 | 510,340 |
| MeidasTouch | Dem | 148 | 309,550 |
| Republicans for The Rule of Law | Dem | 2 | 112,100 |
| Be A Hero PAC | Dem | 119 | 98,600 |
| Great America PAC | Rep | 1 | 15,000 |
| Defending Democracy Together | Dem | 7 | 14,100 |
| Don’t Look Away Pact | Dem | 8 | 7,230 |
| ELPC Action Fund | Dem | 10 | 1,900 |
| Numbers include ads aired on broadcast television and national cable between April 9 and August 9, 2020. CITE SOURCE OF DATA AS: Kantar/CMAG with analysis by the Wesleyan Media Project. |
|||
Dark money groups, which do not report the source of their funding, are responsible for 14 percent of the ad airings in the presidential general election race, while 43 percent of the airings have come from groups that only partially disclose their spending. Forty-three percent of the airings were from groups that fully disclose.
“Groups that do not fully disclose their donors airing the majority of recent television ads in the presidential race puts our democracy at risk of being influenced by untraceable special interests” said Sarah Bryner, Director of Research and Strategy for the Center for Responsive Politics. “Americans should be able to easily understand who is paying to influence their vote and opinion, and the ability for spenders to obscure their identity is opening the door for higher levels of misinformation and ultimately the manipulation of public opinion.”
Non-disclosing groups have become responsible for a greater percentage of ad airings recently—as have groups that fully disclose. Since July 14, 22 percent of ad airings have been from dark money groups, 26 percent have been from groups that partially disclose their donors, and 52 percent of group-sponsored airings have been from fully-disclosing groups.
Trump Still Holds Commanding Lead in Digital Advertising
Although Biden is closing the gap on TV, he is still trailing by a very large margin in digital spending, as shown in Table 3. Overall, Trump has spent double what Biden has spent on Facebook since mid-April, and that gap has grown, with Trump spending more than three times what the Biden campaign has spent since mid-July. On Google, Trump has consistently spent roughly double what Biden has spent for both periods. Trump ads continue to appear on additional pages, including most recently Lara Trump’s Facebook page, adding to ads on Mike Pence’s and Brad Parscale’s pages, among others (for a complete list of the pages on which we have tracked Trump’s ads, see Table A in the About the Data section).
Table 3: Digital Ad Spending by Presidential Candidates and Single-Candidate SuperPACs
| Sponsor | FB $ (since mid-April) | FB $ (since mid-July) | Google $ (since mid-April) | Google $ (since mid-July) | FB+Google $ (since mid-April) | FB+Google $ (since mid-July) |
|---|---|---|---|---|---|---|
| Biden | 20,230,730 | 4,396,232 | 14,555,400 | 4,337,600 | 34,786,130 | 8,733,832 |
| Trump | 40,474,103 | 13,930,237 | 26,586,900 | 8,371,700 | 67,061,003 | 22,301,937 |
| Unite the Country (pro-Biden) | 330,652 | 277,890 | 8,300 | 0 | 338,952 | 277,890 |
| Great America PAC (pro-Trump) | 36,910 | 7,871 | 0 | 0 | 36,910 | 7,871 |
| Digital spending figures come from the Facebook ad library reports and the Google Transparency Report.Spending covers the April 9 or July 15 to August 8, 2020 (for Facebook); April 12 or July 19 to August 8, 2020 (for Google). Candidate spending numbers include spending by official campaign committees, leadership PACs, and joint fundraising committees. See “About the Data” section at the end of this report for more information on our methodology along with the specific page names and disclaimers that are counted. |
||||||
All told, we estimate that digital ad spending in the presidential race (by candidates, leadership PACs, and single-candidate super PACs) on Facebook and Google totaled $420.9 million between January 1, 2019, and August 8, 2020. $247.7 million of that total was on Facebook, with $173.2 million in spending on Google.
Key Battleground Markets Flooded with TV Ads; Digital Spend More Varied
2020 general election campaign (Table 4). Phoenix, Arizona, ranks first with over 18,000 presidential airings between April 9 and August 9, with over 9,000 of those coming in the period starting July 15. Green Bay, Wisconsin, ranks second with 13,383 airings for the general election period followed by Grand Rapids, Michigan (11,989 total airings), Harrisburg, Pennsylvania (11,801 total airings), and Tampa, Florida (11,637 total airings). Pennsylvania’s Wilkes Barre, Pittsburgh and Johnstown; La Crosse, Wisconsin, and Charlotte, North Carolina, round out the remaining markets with more than 10,000 airings overall.
Table 4: Presidential Ad Spending and Airings by Market
| April 9 - Aug 9, 2020 | July 15 - Aug 9, 2020 | ||||||
|---|---|---|---|---|---|---|---|
| Market | State | Est. Spend ($) | Total Airings | Trump Ad Adv | Est. Spend ($) | Total Airings | Trump Ad Adv |
| Phoenix | AZ | 11,552,430 | 18,234 | 1,130 | 6,836,500 | 9,165 | -1,897 |
| Green Bay | WI | 5,630,700 | 13,383 | 421 | 2,107,680 | 4,249 | -1,119 |
| Grand Rapids | MI | 5,005,830 | 11,989 | -845 | 1,206,620 | 2,096 | -1,240 |
| Harrisburg | PA | 6,633,040 | 11,801 | 4,301 | 2,507,210 | 3,504 | 684 |
| Tampa | FL | 8,207,470 | 11,637 | 2,745 | 4,231,330 | 5,227 | -863 |
| Wilkes Barre | PA | 3,988,550 | 11,406 | -784 | 1,391,230 | 3,562 | -328 |
| Pittsburgh | PA | 9,564,340 | 11,091 | 655 | 3,435,130 | 3,702 | -608 |
| La Crosse | WI | 3,492,460 | 10,551 | 431 | 1,222,070 | 2,948 | -236 |
| Johnstown | PA | 3,496,440 | 10,171 | 757 | 1,179,600 | 3,026 | 188 |
| Charlotte | NC | 4,991,630 | 10,040 | 6,072 | 2,366,350 | 4,677 | 961 |
| Tucson | AZ | 3,173,970 | 9,591 | 2,981 | 2,528,250 | 6,236 | 172 |
| Milwaukee | WI | 5,814,800 | 9,538 | 616 | 2,271,680 | 3,465 | -261 |
| Orlando | FL | 9,285,630 | 9,075 | 3,601 | 4,243,250 | 3,864 | 280 |
| Miami | FL | 6,202,500 | 8,674 | 4,054 | 3,252,060 | 4,259 | 361 |
| Philadelphia | PA | 6,620,040 | 8,520 | 3,546 | 2,660,150 | 2,806 | -368 |
| Raleigh | NC | 4,699,830 | 7,688 | 1,536 | 3,167,050 | 4,445 | -491 |
| Traverse City | MI | 2,085,290 | 6,570 | -1,406 | 465,150 | 1,207 | -767 |
| Greensboro | NC | 1,716,760 | 6,217 | 2,995 | 1,076,100 | 3,157 | 417 |
| Detroit | MI | 7,610,660 | 5,648 | -2,312 | 2,829,470 | 1,789 | -1,263 |
| Ft. Myers | FL | 2,183,870 | 5,294 | 4,048 | 978,560 | 1,799 | 567 |
| Numbers include ads aired on broadcast television between April 9 and August 9, 2020, and between July 15 and August 9, 2020. CITE SOURCE OF DATA AS: Kantar/CMAG with analysis by the Wesleyan Media Project. |
|||||||
Figure 1 plots the ad advantage to the two presidential candidates by media market with pro-Trump advantages in red and pro-Biden advantages in blue. Whereas Trump held major ad advantages in the full general election period except for Michigan and a few other scattered markets, Biden has gained ground in Wisconsin, Pennsylvania, Florida and Arizona in recent weeks. Trump’s largest ad advantage in this latter period is in Atlanta, Georgia, where he has had the airwaves to himself.
Figure 1: Advertising Advantage in the Presidential Race on Television
Numbers include ads aired on broadcast television (excluding national cable airings) between April 9 and August 9, 2020, and between July 15 and August 9, 2020.
Figure by Delta Lab’s Kevin McMorrow (’20)
Download the data in this map as a spreadsheet.
CITE SOURCE OF DATA AS: Kantar/CMAG with analysis by the Wesleyan Media Project.
Trump is spending heavily on Facebook impressions in Texas and Florida, in particular. Each state has seen nearly $2M in spending since mid-July and August 8, 2020. Trump has also invested heavily in Georgia, New York, Ohio and Pennsylvania, with over $800,000 in spending in each since mid-July. Biden, by contrast, has spent the most on Florida impressions on Facebook, with just over $700,000 in spending since July 14, followed by Pennsylvania (over $580,000) and California a distant third (over $375,000).
Trump’s Ads “All In” on Crime
The issue emphases of the Biden and Trump campaigns have been completely different since July 14, as Table 5 shows. Trump’s television advertising is extremely focused. Roughly 79 percent of Trump’s ad airings have mentioned crime, while 31 percent mention protests and riots. A new ad that started just last week broadens Trump’s issue references to include attacks on Biden for aligning with the radical left in raising taxes, providing amnesty for illegal immigrants and reducing police funding (a version of this ad incorporating Biden’s VP pick Kamala Harris was also circulating on Twitter shortly after the announcement Tuesday). Just a smattering of other issues have been mentioned in Trump ads, most of them in just a few airings.
Biden’s television advertising, by contrast, has focused on a variety of policy issues, with infectious disease at the top. About 69 percent of Biden ads have discussed the COVID-19 pandemic, whereas the issue went unmentioned by the Trump campaign. Biden’s ads have also emphasized the economy and business, with over half of his airings mentioning those two issues. A third of Biden’s ad airings have mentioned jobs and health care, while about a quarter have mentioned civil rights/racial discrimination. China, climate change, foreign policy, energy policy and taxes also received substantial numbers of mentions from Biden’s campaign.
“The two campaigns are talking past each other,” said Erika Franklin Fowler, co-director of the Wesleyan Media Project. “While Biden is focusing in on the COVID-19 pandemic and the economy, Trump’s campaign ads have almost a unilateral focus on crime and the recent protests.”
Table 5: Top Issue Mentions by Biden and Trump Campaigns
| Biden | Trump | ||||
|---|---|---|---|---|---|
| Issue | Airings with Mentions | Percent | Issue | Airings with Mentions | Percent |
| COVID-19 | 26,887 | 68.7% | Crime | 38,151 | 78.8% |
| Economy (generic) | 23,401 | 59.8% | Protests/riots | 15,148 | 31.3% |
| Business | 22,223 | 56.8% | Taxes | 8,894 | 18.4% |
| Jobs | 13,897 | 35.5% | Immigration | 8,894 | 18.4% |
| Health care | 12,427 | 31.7% | Trade | 8,879 | 18.3% |
| Civil rights/racial discrimination | 10,146 | 25.9% | |||
| Gov't spending | 9,429 | 24.1% | |||
| China | 9,153 | 23.4% | |||
| Climate change | 9,153 | 23.4% | |||
| Foreign policy | 9,153 | 23.4% | |||
| Energy policy | 9,153 | 23.4% | |||
| Taxes | 9,153 | 23.4% | |||
| Health care expansion/access | 8,281 | 21.2% | |||
| Emergency prep/response | 7,175 | 18.3% | |||
| Protests/riots | 5,967 | 15.2% | |||
| Military | 4,437 | 11.3% | |||
| Recession/econ stimulus | 4,422 | 11.3% | |||
| Seniors (not Medicare) | 4,226 | 10.8% | |||
| Education | 4,146 | 10.6% | |||
| Minimum wage | 4,146 | 10.6% | |||
| Numbers include candidate-sponsored ads aired on broadcast television and national cable between July 15, 2020, and August 9, 2020. Only issues that appeared in at least 10 percent of the candidate's ads are listed in the table. CITE SOURCE OF DATA AS: Wesleyan Media Project coding of Kantar/CMAG data. |
|||||
Trump TV Ads Largely Negative; Biden Ads Largely Positive
Since the beginning of the general election campaign, which we define to begin on April 9 (the day after Bernie Sanders dropped out), Trump has run a largely negative campaign, with 78.5 percent of his campaign’s ad airings solely attacking Biden. Another 10 percent contrasted Trump with Biden, while 12 percent of airings were positive. During that same time period, 64 percent of Biden’s ads were positive, 25 percent were contrast, and 9 percent were negative.
Since July 14, the Trump campaign has not aired a single positive ad. Ninety-eight percent of its ad airings have been negative—solely focused on their opponent—while 2 percent have been contrast ads—those that compare Trump’s record with that of his opponent. By contrast, 69 percent of Biden’s ad airings have been positive, with 17.3 percent contrast and 12 percent falling into the negative category.
“The fact that Trump is airing so many more negative ads on television is a sign of his vulnerability. Typically, challengers go on the attack, and incumbents only return fire when they absolutely need to,” said Travis Ridout, co-director of the Wesleyan Media Project.
Table 6: Tone of Biden and Trump Campaign Ad Airings
| Positive | Contrast | Negative | |
|---|---|---|---|
| Since April 8 | |||
| Biden | 64.3% | 25.1% | 9.1% |
| Trump | 11.5% | 10.0% | 78.5% |
| Since July 14 | |||
| Positive | Contrast | Negative | |
| Biden | 69.0% | 17.3% | 11.7% |
| Trump | 0.0% | 2.0% | 98.0% |
| Numbers include candidate-sponsored ads aired on broadcast television and national cable between April 8 and August 9, 2020, and between July 14 and August 9, 2020. CITE SOURCE OF DATA AS: Wesleyan Media Project coding of Kantar/CMAG data. |
|||
The tone of the candidate’s campaigns is markedly different on Facebook. Since the start of the general election contest, only 17 percent of Trump’s Facebook ad spending has occurred on ads mentioning Biden (and thus would not be coded as positive) while 64 percent of Biden’s ads have mentioned Trump. Since July 15, Trump has mentioned Biden in 19 percent of his campaign’s Facebook ad spending, while Biden has mentioned Trump in 42 percent of digital ad spending. While Biden’s campaign remains more negative on Facebook than Trump’s campaign, his ads have become more positive as the race has progressed.
Ad Volumes Below 2012, Above 2016
Since May, the volume of television ads in the presidential race has been above levels of airings in 2016—when an ill-funded Trump campaign largely avoided television—but below levels of ad airings in 2012 (Figure 1). Between April 8 and August 9, 2020, $167.7 million was spend on television advertising, compared to $123 million during that same time frame in 2016 and $238 million during the same time frame in 2012.
Figure 2: Presidential Race Ad Volume by Week and Year
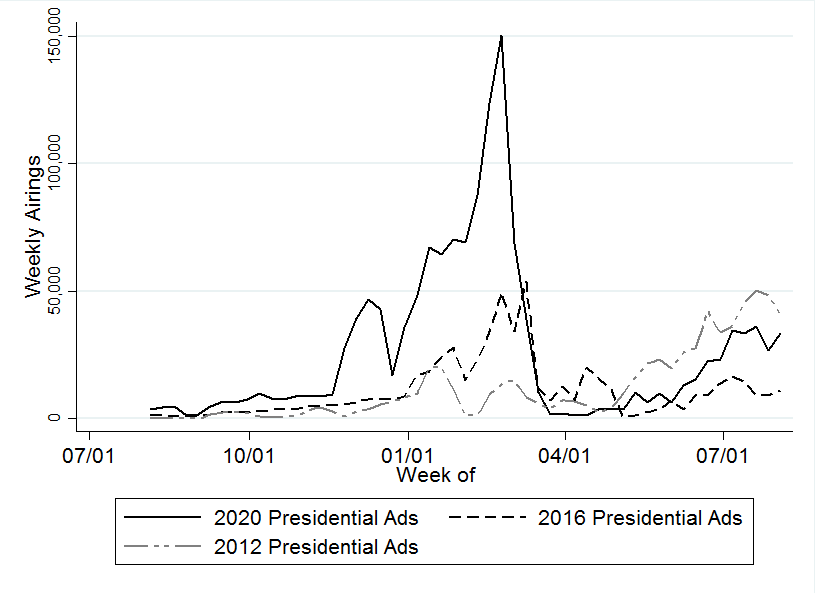
Numbers include ads aired on broadcast television.
CITE SOURCE OF DATA AS: Kantar/CMAG with analysis by the Wesleyan Media Project
“In spite of a global pandemic, there is little indication that ad volumes are out of the ordinary for a presidential race,” said Mike Franz, co-director of the Wesleyan Media Project.
Of course, massive spending by Michael Bloomberg and Tom Steyer in the presidential nomination race means that presidential ad spending in the current election cycle is already a record-setter. $905.8 million has been spent on television advertising in the presidential race since the start of the campaign, compared to $494 million in 2016 and $343 million in 2012.
About the Data
For the television ad totals, data reported here are from Kantar/CMAG and do not cover local cable buys, only broadcast television, national network and national cable advertising.
For Facebook ads, data come from the aggregate reports, but our figures are more comprehensive than what Facebook reports on their campaign page because we include spending on ads that are funded by the campaigns even when they run on different pages in our totals (e.g., Trump funded ads on Mike Pence or Brad Parscale’s pages are included in the Trump totals). We looked for pages attached to each candidate, including possible leadership PACs, joint-fund-raising committees, and, in the case of presidential candidates, affiliated Senate/House pages. Aggregate report entries are provided for each page name and disclaimer combination. Totals for most of this report on spending between April 9, 2020 (or July 15, 2020) and August 8, 2020 are calculated by subtracting the reported cumulative spending (as reported by Facebook as the total spent since May 2018) for the August 8, 2020 report and subtracting off the cumulative spending reported for April 8, 2020 (or July 14, 2020).
Calculating cycle-to-date Facebook totals is more challenging than looking at totals from the last couple of months. In early January 2019, Facebook did not include page IDs (a unique identifier) for each entry in the aggregate report. Because pages can have the same name, a unique identifier for each page would be required to definitively identify an aggregate report entry, which Facebook does not provide going backward. Therefore, we did our best to associate each entry in the January 5, 2019, report with a page ID, which we had access to through the library API. There may be some slippage if two pages associated with candidates had identical names and disclaimers, but we believe these instances are rare for the set of ads covered in this report. For cycle-to-date spending, we subtracted the January 5, 2019 total from the August 8, 2020 total to get the spending by page and disclaimer for January 6, 2019 through August 8, 2020. We also report spending from April 9, 2020 through August 8, 2020 and July 15, 2020 through August 8, 2020. We rely on a Delta Lab monitoring tool to identify and avoid using days on which Facebook has a problem with the aggregated spending report.
Pages can sponsor ads that are funded by different entities. We made the assumption that all spending by federal office-holders running for president this cycle (e.g., Cory Booker) was in support of their presidential campaign up until they date they dropped out of the presidential race (if applicable), even if some spending was reported from their House or Senate page or leadership PAC, especially because many of the leadership PAC spending occurred on the same pages as the campaign spending. Advertisements run by pages known to be associated with presidential candidates are included even in instances where the ads ran without an appropriate disclaimer.
In Table A (click here to download), we list the page names/disclaimer rows from the Facebook aggregate reports that we identified for this report. It is possible that we missed some spending from a Facebook page affiliated with a candidate running for office. This is exacerbated by the absence of EIN or FEC identifiers in the Facebook reports.
For Google ads, we downloaded the weekly reports from the platform’s Transparency Report. As a matter of practice with all of the platform data, we try to replicate our prior spending figures when we are calculating numbers for a new release. In that process, we discovered discrepancies between the data we downloaded in November and the information available in the December download for the same dates, which persists in May. Based on conversations with Google, we believe the discrepancies are partially but not exclusively due to the addition of advertisers targeting state-level races. We are working on a process to report these discrepancies, but the totals reflected in this release are current as of 8/11/20, the day on which we pulled the transparency report. Table B (linked to below) reports these discrepancies as they relate to our previous press release. Google only includes spending in federal and state races and only includes weekly totals but lists the sponsor’s EIN or FEC committee ID. We searched the list of advertisers for presidential candidates and affiliated leadership PACs and joint-fund-raising committees, and candidates for U.S Senate and affiliated single-candidate super PACs. We made the same assumption as with the Facebook data about any spending from House and Senate campaign committees by declared presidential candidates. Google spending is from the following time periods: January 6, 2020 through August 8, 2020; April 12, 2020 through August 8, 2020; and July 19, 2020 through August 8, 2020.
In Table B (click here to download), we list the advertiser name for all entities used in this report to calculate Google spending totals.
About This Report
The Wesleyan Media Project (WMP) provides real-time tracking and analysis of political advertising in an effort to increase transparency in elections. Housed in Wesleyan’s Quantitative Analysis Center (QAC) – part of the Allbritton Center for the Study of Public Life – the Wesleyan Media Project is the successor to the Wisconsin Advertising Project, which disbanded in 2009. It is directed by Erika Franklin Fowler, associate professor of government at Wesleyan University, Michael M. Franz, professor of government at Bowdoin College and Travis N. Ridout, professor of political science at Washington State University. WMP personnel include Laura Baum (Project Manager), Colleen Bogucki (Project Coordinator), Pavel Oleinikov (Associate Director, QAC), Markus Neumann (Post-Doctoral Fellow), and Jielu Yao (Post-Doctoral Fellow).
The Wesleyan Media Project’s digital advertising tracking is supported by the contributions of students in Delta Lab, an interdisciplinary research collaborative focusing on computationally-driven and innovative analyses and visualizations of media messaging. We especially thank Kevin McMorrow ‘20 and Roshaan Siddiqui ‘22 for their contributions to this report.
The Wesleyan Media Project is supported by Wesleyan University, the John S. and James L. Knight Foundation, and the Democracy Fund. WMP is partnering again this year with the Center for Responsive Politics, to provide added information on outside group disclosure.
Periodic releases of data will be posted on the project’s website and dispersed via Twitter @wesmediaproject. To be added to our email update list, click here.
For more information contact: Lauren Rubenstein, lrubenstein@wesleyan.edu, (860) 685-3813 or (203) 644-7144
About Wesleyan University Wesleyan University, in Middletown, Conn., is known for the excellence of its academic and co-curricular programs. With more than 2,900 undergraduates and 200 graduate students, Wesleyan is dedicated to providing a liberal arts education characterized by boldness, rigor and practical idealism. For more, visit wesleyan.edu.
About the John S. and James L. Knight Foundation Knight Foundation is a national foundation with strong local roots. We invest in journalism, in the arts, and in the success of cities where brothers John S. and James L. Knight once published newspapers. Our goal is to foster informed and engaged communities, which we believe are essential for a healthy democracy.
About Democracy Fund Created by eBay founder and philanthropist Pierre Omidyar, Democracy Fund is a foundation helping to ensure that our political system can withstand new challenges and deliver on its promise to the American people. Democracy Fund has invested more than $125 million in support of a healthy, resilient, and diverse democracy with a particular focus on modern elections, effective governance, and a vibrant public square.


