(MIDDLETOWN, CT) October 25, 2023 – The Presidential election in 2024 is nearly one year away, and it is useful to speculate on how many television ads we might see in the coming campaign. Are digital ads squeezing out the appetite for television ads? Is the battleground more narrow today than in prior years, perhaps shrinking as the country has polarized politically?
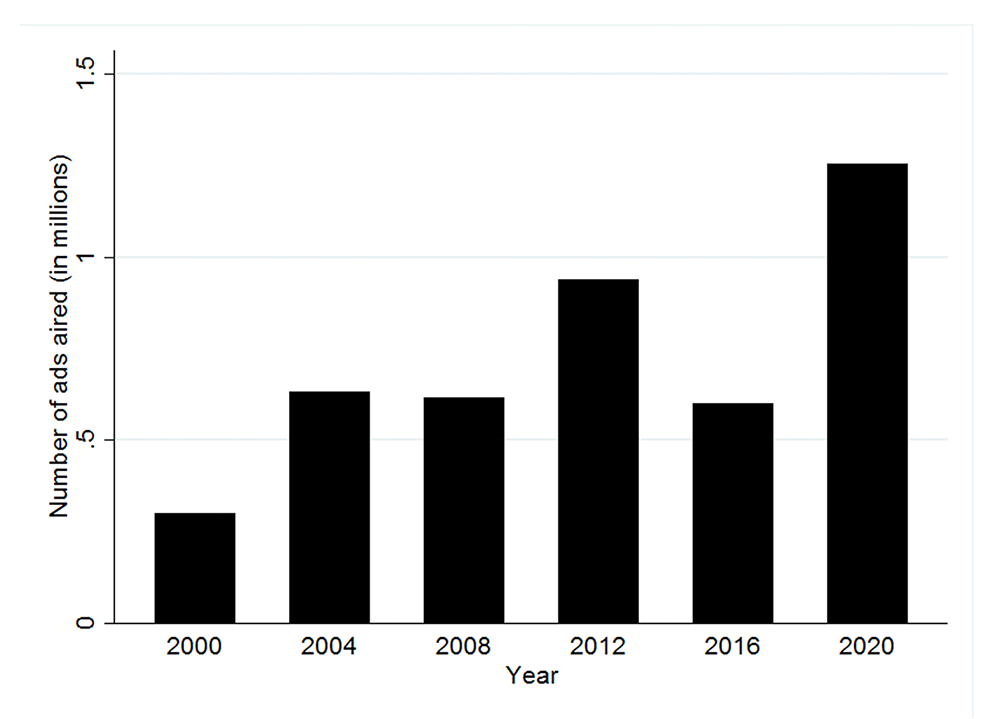
As we reported in our book, Political Advertising in the United States, political advertising volumes on television ebbed in 2016 but surged in 2020. The latter election featured fewer TV ads because Trump was more engaged online (and on Twitter), but volumes spiked in 2020, perhaps because of the pandemic. We show below Figure 3.1 from the book, which looks at total ad volume in the Election Year for the top 75 markets in each year. (Our data include all 210 markets back to 2004 but only the top 75 markets in 2000.)
Volume of Television Advertising for the Presidential Race in the Top 75 Markets, January 1 to Election Day
(Figure 3.1 in the book)
Do these trends mask any increased concentration in fewer media markets, though? Perhaps volumes were up in 2012 over 2008 and in 2020 over 2016 even as the number of markets with ad volumes shrunk. This hypothesis would suggest that the states in-play were fewer, but with the stakes higher than ever, volumes in those places may have sky-rocketed.
To assess that, we looked at ad volumes for the period between September 1 of the election year and Election Day. This is the typical “fall campaign.” We added up the number of markets with any pro-Democratic or pro-Republican ads and plotted by year the number of markets with at least 5,000 spots.
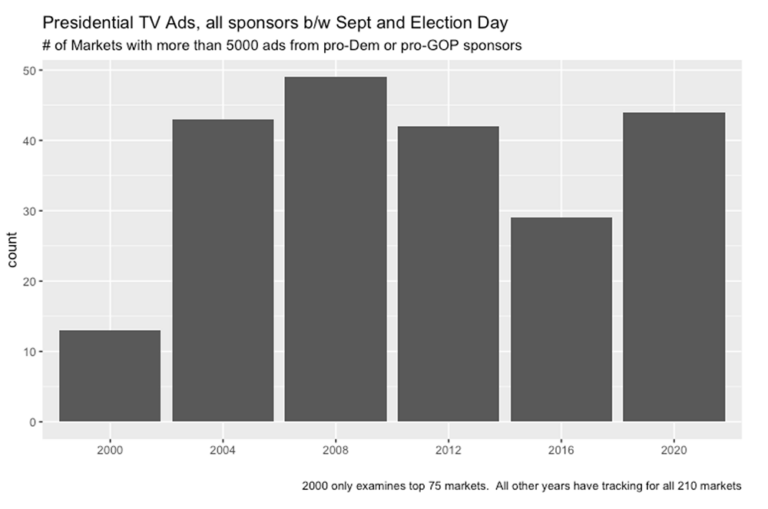
Interestingly, the number of markets in 2020 is very comparable to the 2004 and 2008 campaigns, suggesting that the geographic terrain of the air war had not constricted much in 2020. This does not match the hypothesis suggested above.
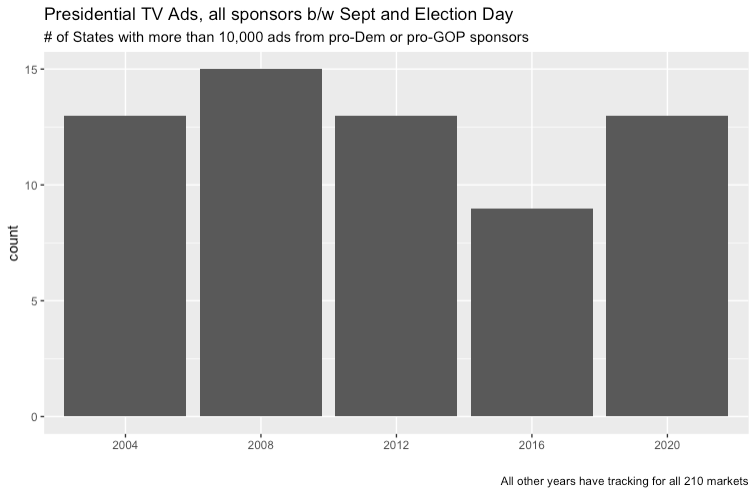
Media markets also cross state boundaries, and so it is also useful to count the number of states with high volumes. We assigned each market to its “home state” (e.g., Philadelphia to Pennsylvania, even though it extends into New Jersey). We then summed the ad totals by the home states of the media markets, and we look here at 2004 to 2020 to make totals comparable across years. We plot below the number of states with at least 10,000 ad spots in the Fall campaign. The data used to make this graph is attached here.
Perhaps ad volumes are not the best metric to discern the battleground states, though campaigns are not likely to invest in places they are sure to win or lose. The broader evidence here, though, does not suggest that the battleground has narrowed since 2004, though it has shifted to different parts of the country, from places like Ohio to Arizona and Georgia. And it is useful to remember that bigger states have more markets, making it easier to cross our arbitrary threshold of 10,000 spots. Florida was not really in play in 2020, but it featured nearly 190,000 ad airings in the fall of 2020, more than any other state in the campaigns back to 2004.