(MIDDLETOWN, CT) December 13, 2017 – The deadline for the fifth open enrollment period of the Affordable Care Act (ACA) is just two days away. With a slashed federal advertising budget, fewer days to sign up, and evidence linking ad volume to enrollment uptake, reports of higher than expected enrollment so far this year are somewhat puzzling.
A new report by the Wesleyan Media Project shows that the volume of television advertising during the first 37 days of the open enrollment period (from November 1 to December 7) is actually up 51 percent over the same time window last year despite the elimination of federal advertising for HealthCare.gov (see Table 1). This increase is largely due to non-governmental advertisers – and insurance companies in particular. Although viewers are seeing many more health insurance ads on TV than they did during this time last year, the total amount of advertising in this fifth open enrollment period is likely to be similar to the volume of activity in the longer fourth enrollment period, as we describe in detail in this report.
![]()
Tracking health insurance advertising over time
The Wesleyan Media Project (WMP), in collaboration with University of Minnesota health policy professor Sarah Gollust, has been tracking the volume, content and effect of health insurance advertising related to the Affordable Care Act since 2013. More specifically, we track and analyze all health insurance ads aired on national cable, national network and local broadcast television in all of the nation’s 210 media markets. The underlying data, which comes from Kantar Media/CMAG, includes information on the frequency of ad airings and video of each creative. WMP has further classified each advertisement based on Kantar Media/CMAG’s reported sponsor into four distinct types: ads from the federal government (specifically those from the U.S. Department of Health and Human Services), ads from states (for their own health insurance marketplaces or Medicaid programs), ads from private entities (including insurance companies, health systems, insurance brokers, and managed care organizations), and ads from other sponsors, such as enrollment advocates.
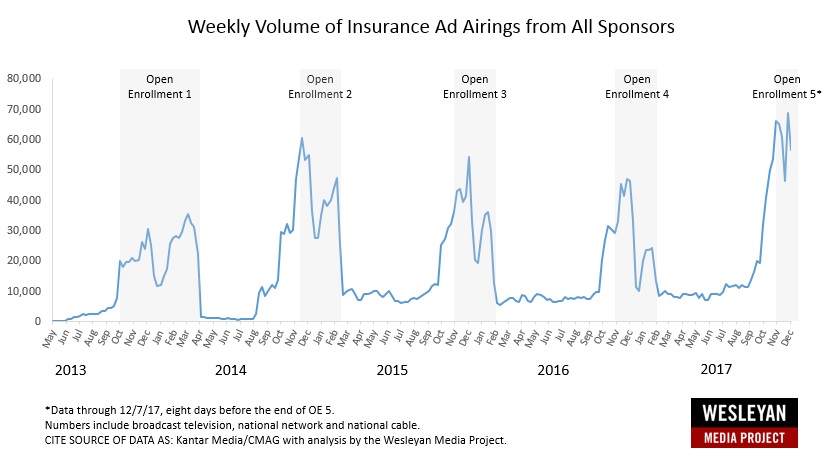
Looking across all sponsors in Figure 1 below, there is a sharp increase in advertising at the start of open enrollment period five compared to the prior four periods.
![]()
Figure 1. Weekly Volume of Insurance Ad Airings from All Sponsors
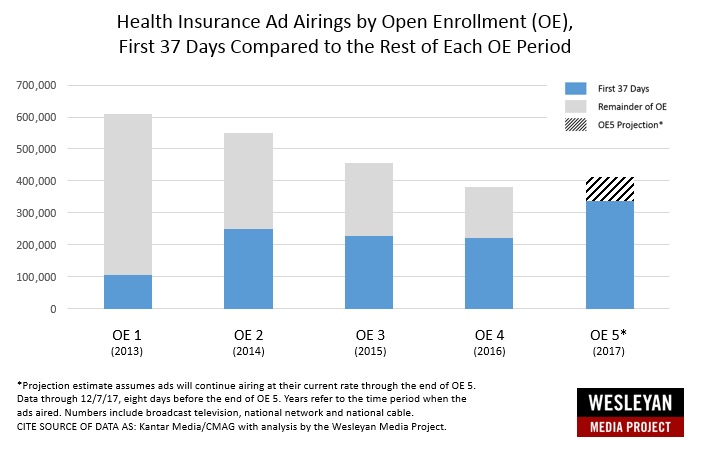
Figure 2 shows this increase in early advertising activity more clearly by aggregating the total volume in the first 37 days of each open enrollment period (OE) in blue, compared to the total advertising activity over the full enrollment period in gray. As shown in gray, total advertising during open enrollment periods has been declining overall (perhaps in part due to the shortened periods), but advertising in the first 37 days is up sharply in OE5 compared to the earlier periods (shown in blue). If advertising in the final eight days of the enrollment period continues at the same pace as the first 37 days, total advertising in OE5 may actually outpace the full activity from OE4, and because the period is so short, consumers are seeing many more health insurance ads at one time than they had in the past. Specifically, the analysis shows that a total of 104,601 ads were aired during the first 37 days of OE1, 250,489 for OE2, 226,980 for OE3, 223,047 for OE4, and 338,224 for OE5. This amounts to a 51 percent increase in insurance ads aired in the first 37 days between OE4 and the current open enrollment period.
![]()
Figure 2. Health Insurance Ad Volume in the First 37 Days of Open Enrollment
Click here for Figure 2 data
![]()
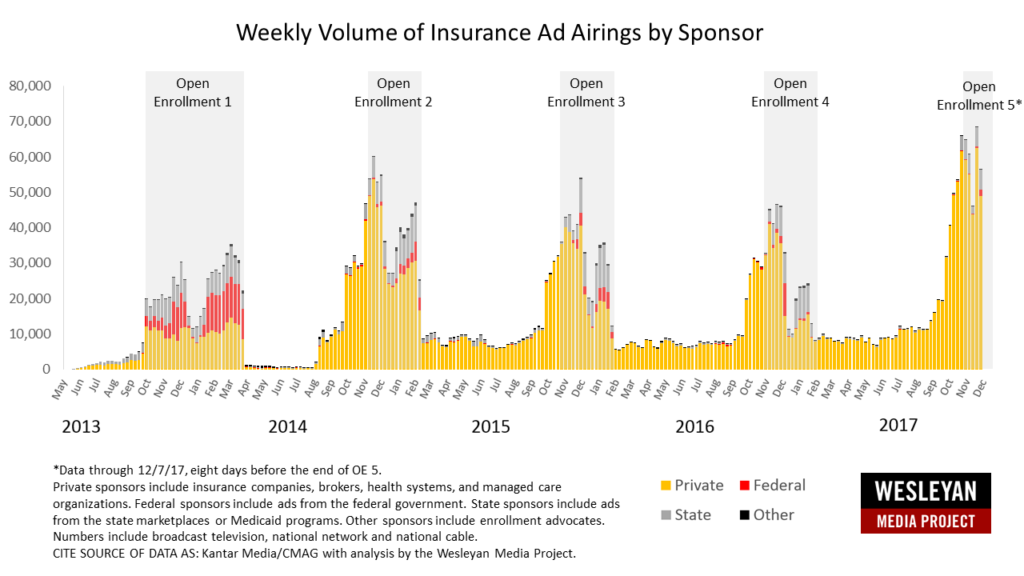
Of course, with the Trump Administration’s decision to slash the federal advertising budget, the relevant question is: where is the advertising increase coming from? As shown in Figure 3, the answer is private insurers.
Figure 3. Weekly Volume of Insurance Ad Airings by Sponsor
Insurance companies and other non-governmental entities have always made up the majority of advertisers encouraging health insurance enrollment. That remains true in 2017, and in fact, it is those advertisers who have stepped up their advertising in light of the shorter enrollment period during which to spread the word. WMP took a look at every one of the ads by private sponsors (e.g., insurance companies, health systems) that aired more than 500 times in OE5, and none of them mentioned HealthCare.gov with the exception of one commercial that mentioned it solely to say you don’t have to go through the government’s site but could instead go directly to the insurer’s portal.
![]()
“Insurance company advertising is not a replacement for federal advertising, which in the past drove enrollees explicitly to the HealthCare.gov,” said Erika Franklin Fowler, Wesleyan Media Project Co-Director. “However, more ads in a shorter window make it more likely that consumers will encounter health insurance messaging on television, which may help to boost awareness and encourage enrollment generally, complimenting other efforts to spread the word.”
![]()
Federal advertising drops off but some mysteries remain
It is well known that the Trump Administration slashed the health insurance advertising budget by 90 percent (from $100M to $10M), and Table 1 clearly shows the drop-off in advertising by the U.S. Department of Health and Human Services during this fifth open enrollment period.
![]()
Table 1. Federally funded insurance advertising airings
by focus and enrollment period
| Healthcare.gov | Medicare | CHIP | Total* | ||
|---|---|---|---|---|---|
| OE1 | 2013-2014 | 166,911 | 157 | 1,739 | 168,821 |
| OE2 | 2014-2015 | 22,312 | 751 | 1,557 | 25,059 |
| OE3 | 2015-2016 | 24,774 | 1,426 | 138 | 26,403 |
| OE4 | 2016-2017 | 15,781 | 1,713 | 64 | 17,558 |
| OE5 | 2017 | 0 | 1,462 | 93 | 1,555 |
| Figures include broadcast television, national network and national cable for the time period of each open enrollment period, which varied depending upon the year. WMP classified each creative by its primary purpose: whether it advertised primarily for HealthCare.gov, Medicare, or the Children’s Health Insurance Program (CHIP). *The total includes a small number of “other” ads from OE periods 1-3 that primarily focused on enrollment help being available but were not explicitly promoting healthcare.gov. CITE SOURCE OF DATA AS: Kantar Media/CMAG with analysis by the Wesleyan Media Project. |
|||||
More specifically, the federal government has not aired a single ad about the federal health insurance marketplace on broadcast TV or national cable. Instead, the vast majority of ads on air during the last few weeks that were sponsored by the U.S. Department of Health and Human Services were ads for Medicare.
Interestingly, Medicare ad volume has been increasing over time, and the 2017 enrollment period was no exception to that trend. In fact, the U.S. Department of Health and Human Services nearly doubled the total ads aired for Medicare this year compared to the last enrollment period (the Medicare open enrollment period spanned from October 15 until December 7 this year). More than four in ten of the Medicare airings (1,305 in total) aired on national network and national cable while the other 1,783 ads were widely disbursed in local media markets throughout the country.
Although Congress has yet to reauthorize the Children’s Health Insurance Program (CHIP), the federal government sponsored 71 airings that focused on CHIP enrollment in the time period between November 1 and December 7, 2017. Nearly half of those airings (46 percent, 33 airings in total) were Spanish-language airings that ran primarily in Monterey, California (21 airings) although Los Angeles and Houston also saw a few Spanish-language airings (7 and 5 respectively). The remaining 38 advertisements aired in Dothan, Alabama (10 airings), Topeka, Kansas (26 airings) and Seattle, Washington (2 airings).
Despite the federal government’s decision not to advertise the health insurance marketplace during the current open enrollment period, our analysis shows that advertising by non-governmental sponsors – specifically insurance companies and other non-public sponsors – has increased to fill the gap. With the window for enrollment ending on December 15, it remains to be seen where the total volume of television advertising will end up and how marketing will translate into enrollment, but one thing is clear: time is running out.
![]()
ADDITION 12/14/17 – This post highlights the 51% increase in overall health insurance-related advertising that happened to coincide with the open enrollment period of the health insurance marketplace in 2017. We are unable to provide definitive explanations for why this advertising increased so much during this time period, and the tighter open enrollment period is likely only one of many other reasons that insurance companies changed their approach from previous years.
![]()
About This Report
Data reported here from Kantar Media/CMAG do not cover local cable buys, only broadcast television, national network and national cable advertising.
This report is based on an ongoing collaboration between the Wesleyan Media Project (specifically WMP Co-Director Erika Franklin Fowler and Project Manager Laura Baum) and Sarah Gollust, Associate Professor of Health Policy and Management at the University of Minnesota School of Public Health. Dr. Gollust is also a Wesleyan alumna (class of 2001).
The Wesleyan Media Project provides real-time tracking and analysis of all political television advertising in an effort to increase transparency in elections, which it has done since 2010. Housed in Wesleyan University’s Quantitative Analysis Center, part of the Allbritton Center for the Study of Public Life, it is directed by Erika Franklin Fowler, associate professor of government at Wesleyan University, Michael M. Franz, associate professor of government at Bowdoin College and Travis N. Ridout, professor of political science at Washington State University. WMP staff include Laura Baum (Project Manager), Dolly Haddad (Project Coordinator) and Matthew Motta (Research Associate).
Periodic releases of data will be posted on the project’s website and dispersed via Twitter @wesmediaproject. To be added to our email update list, click here.
For more information contact:
Lauren Rubenstein, lrubenstein@wesleyan.edu, (860) 685-3813
![]()
About Wesleyan University
Wesleyan University, in Middletown, Conn., is known for the excellence of its academic and co-curricular programs. With more than 2,900 undergraduates and 200 graduate students, Wesleyan is dedicated to providing a liberal arts education characterized by boldness, rigor and practical idealism. For more, visit www.wesleyan.edu.
