Clinton Maintains Huge Advantage Over Trump
Trump Campaign Running Positive Ads;
Dems Hold Ad Advantage in Many Senate Races
October 18, 2016
![]()
Report Highlights
• Clinton ads out-air Trump ads more than 3:1 (Table 1)
• Group ads still favor Clinton campaign (Table 2)
• Pres ads this cycle more positive than the last 4 presidential campaigns (Table 3)
• 50% of Trump ads are positive (Table 4)
• Top media markets data show Florida still at center of pres ad storm (Table 5)
• Senate ad advantage map (Figure 6)
• NV Sen sees the most negative ads this election (Table 8)
• Pro-Republican Senate attacks more personal than Pro-Dem attacks (Table 9)
• Maine House race sees most ads (Table 12)
• In gov races, MT, NC and MO see most ads by volume & spending (Table 13)
• Top outside groups in federal races (Table 15)
• Top issues: Clinton emphasizes jobs while Trump focuses on taxes (Table 17)
![]()
(MIDDLETOWN, CT) October 18, 2016 – Advertising in the presidential race is considerably less intense than it was four years ago, with 117,000 presidential ads airing between September 16 and October 13. That compares to 256,000 ads during that same time period in 2012.
![]()
“People in the battleground states are getting a bit of break this year,” said Erika Franklin Fowler, co-director of the Wesleyan Media Project. “In the past month, ad levels have been less than half what they were four years ago. Certainly, this has a lot to do with Trump running an unconventional campaign, but even pro-Clinton ads are only half the number of pro-Obama ads four years ago.”
![]()
Indeed, the Clinton campaign has aired 62,000 ads in the past month, compared to 124,000 aired by the Obama campaign during the same time period in 2012 (Table 1). Neither the Democratic or Republican party has aired a single ad in the presidential race in the past month.
In spite of the lower ad volumes overall, pro-Clinton ads outnumber pro-Trump ads by more than three to one, 89,000 to 28,000.
![]()
Table 1: Volume of Presidential Ads in 2016 v. 2012 (Since September 16)
| Count | 2012 Pro-Obama | 2012 Pro-Romney | 2016 Pro-Clinton | 2016 Pro-Trump |
|---|---|---|---|---|
| Candidate | 123,714 | 50,413 | 62,351 | 15,440 |
| Group | 17,545 | 52,644 | 27,106 | 12,188 |
| Party | 1 | 11,709 | 0 | 0 |
| TOTALS | 141,260 | 114,766 | 89,457 | 27,628 |
| Figures are from September 16, 2016 to October 13, 2016. Numbers include broadcast television, national network and national cable. CITE SOURCE OF DATA AS: Kantar Media/CMAG with analysis by the Wesleyan Media Project |
||||
Figure 1 visualizes the breakdowns for Democratic advertising in the presidential race between 2012 and 2016. Although there has been more group activity in 2016 than in 2012 (mostly by Priorities USA Action), candidate advertising is down by half.
![]()
Figure 1: Volume of Democratic Ads by Sponsorship (2012 and 2016)
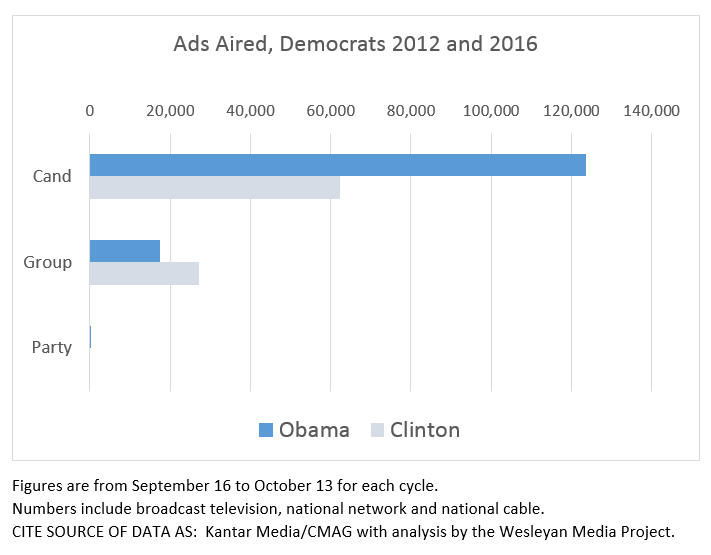
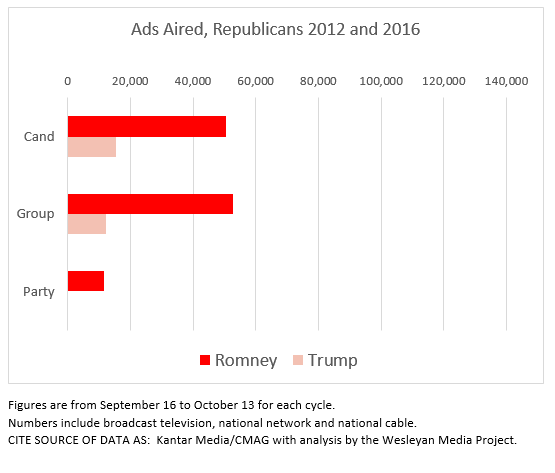
Figure 2 makes the same comparisons for Republicans. Candidate and group-sponsored ads are down dramatically from 2012, and party activity has dropped to 0.
![]()
Figure 2: Volume of Republican Ads by Sponsorship (2012 and 2016)
![]()
Table 2 shows the top group advertisers in the presidential campaign over the past month. Topping the list is Priorities USA Action, a super PAC supporting Hillary Clinton. The group has aired over 21,000 ads at an estimated cost of $20 million since September 16. The NRA Institute for Legislative Action, which has aired ads supporting Trump, is second on the list, with over 5,000 ads. The pro-Clinton NextGen California Action Committee has aired almost 3,900 ads, while the pro-Trump Rebuilding America Now PAC has aired some 2,600 ads.
![]()
Table 2: Top Group Advertisers in the Presidential Campaign
| Sponsor | Party | Ads Airings | Est. Cost (in Millions) |
|---|---|---|---|
| Priorities USA Action | Democrat | 21,398 | 20.0 |
| NRA Institute for Legislative Action | Republican | 5,115 | 4.7 |
| NextGen California Action Committee | Democrat | 3,870 | 5.0 |
| Rebuilding America Now PAC | Republican | 2,660 | 2.1 |
| Reform America Fund | Republican | 2,051 | 1.4 |
| 45committee | Republican | 2,022 | 2.1 |
| SEIU Cope | Democrat | 590 | 0.9 |
| El Super PAC Voto Latino | Democrat | 578 | 0.9 |
| Latino Victory Fund | Democrat | 340 | 0.2 |
| Leading Illinois For Tomorrow | Democrat | 294 | 1.1 |
| AARP | Other | 236 | 0.4 |
| Right to Life of Michigan | Republican | 106 | 0.3 |
| NRA Political Victory Fund | Republican | 104 | 0.1 |
| Figures are from September 16, 2016 to October 13, 2016. Numbers include broadcast television, national network and national cable. CITE SOURCE OF DATA AS: Kantar Media/CMAG with analysis by the Wesleyan Media Project. |
|||
Air War in Last Month More Positive than Last Four Presidential Cycles
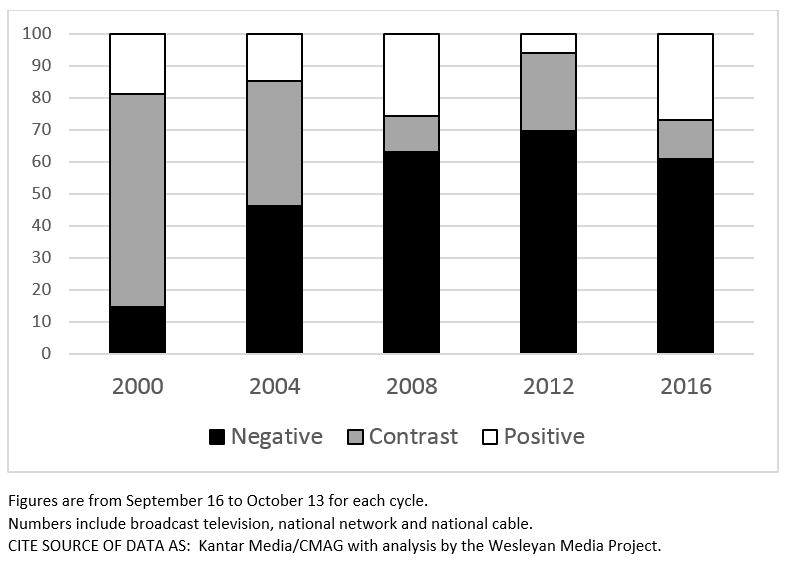
The 2016 campaign has been an ugly one, but political advertising since September 16 has actually been more positive than advertising during the same time period over the last four presidential campaigns (Table 3 and Figure 3). The percentage of ads that are positive—that is, focus solely on the favored candidate—is 27 percent, which is up from a mere 6 percent for this same period in 2012. Still, 61 percent of ads have been purely negative, focused on the opponent, and 12 percent have been contrast ads, those that mention both a favored candidate and the opponent.
![]()
Table 3: Tone of Presidential Race Over Time
| Year | Negative % | Contrast % | Positive % |
|---|---|---|---|
| 2000 | 14.7 | 66.49 | 18.81 |
| 2004 | 46.28 | 39.03 | 14.69 |
| 2008 | 63.02 | 11.14 | 25.84 |
| 2012 | 69.68 | 24.28 | 6.04 |
| 2016 | 60.75 | 12.2 | 27.05 |
| Figures are from September 16 to October 13 for each cycle. Numbers include broadcast television, national network and national cable. CITE SOURCE OF DATA AS: Kantar Media/CMAG with analysis by the Wesleyan Media Project. |
|||
Figure 3: Tone of Presidential Race Over Time
![]()
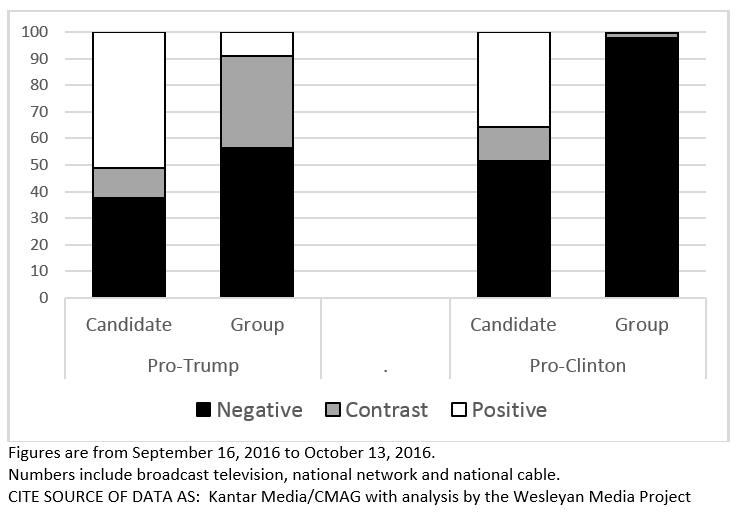
The tone of advertising, however, does vary depending on its sponsorship. Group-sponsored ads tend to be more negative in tone than candidate-sponsored ads, as Table 4 and Figure 4 show. For instance, while 98 percent of ads sponsored by groups promoting Clinton have been purely negative, 52 percent of the ads sponsored by the Clinton campaign have been negative. The groups sponsoring pro-Trump have been over half negative (56 percent), but they also have engaged in considerable contrast advertising (35 percent). Perhaps surprisingly, given the rhetoric on the campaign trail, over half of the ads sponsored by the Trump campaign over the past month have been positive ads aimed at promoting Trump (51 percent).
![]()
“You wouldn’t know it by his behavior on the campaign trail, but Trump’s advertising campaign has been more positive than negative this past month,” said Travis Ridout, co-director of the Wesleyan Media Project. “Perhaps the difference in tone is a strategic move. His caustic style on the stump is well known; the positive ads might be more memorable as a result.”
![]()
Table 4: Tone by Ad Sponsorship
| Negative % | Contrast % | Positive % | ||
|---|---|---|---|---|
| Pro-Trump | Candidate | 37.58 | 11.2 | 51.22 |
| Group | 56.31 | 34.65 | 9.04 | |
| Pro-Clinton | Candidate | 51.5 | 12.67 | 35.84 |
| Group | 97.87 | 1.58 | 0.55 | |
| Figures are from September 16, 2016 to October 13, 2016. Numbers include broadcast television, national network and national cable. CITE SOURCE OF DATA AS: Kantar Media/CMAG with analysis by the Wesleyan Media Project. |
||||
![]()
Figure 4: Tone by Ad Sponsorship
![]()
A more in-depth look at the candidates’ advertising reveals that their attacks often use the opposing candidates’ words against them. For instance, 86 percent of Clinton-sponsored pure attack ads (27,308 total airings) include clips of Trump’s voice, and 98 percent of Trump-sponsored pure attack ads (5,663 total airings) include Clinton’s voice. Moreover, Pro-Clinton ads are focusing on personal characteristics over policy: 87 percent of pro-Clinton attack ads focus on Trump’s personal characteristics. Pro-Trump attacks ads are more likely to focus on both personal characteristics and policy (42 percent) with a third (33 percent) focusing solely on personal characteristics of Clinton. When Trump goes positive, however, the discussion often turns to policy: 75 percent of pro-Trump promotional ads focus on policy as opposed to personal characteristics.
![]()
Florida Still at Center of Presidential Advertising Storm
Florida continues to be at the center of the presidential advertising world, with Orlando and Tampa seeing more ads than any other media market in the country over the past month (Table 5). In both markets, pro-Clinton ads have dominated, comprising 84 and 77 percent of total ads respectively. Media markets in Nevada, North Carolina, Pennsylvania and Ohio round out the top 10. Clinton holds an ad advantage in all of the top 20 media markets. Notably, the Clinton campaign has aired 4,504 ads on national cable over the last month as well, compared to just 608 aired by the Trump campaign.
![]()
Table 5: Top Media Markets in Presidential Race
| Media Market | Dem Ads | Rep Ads | Total Ads | Total Cost (in Ms) | % Dem Ads |
|---|---|---|---|---|---|
| Orlando | 5,655 | 1,039 | 6,694 | 8.3 | 84% |
| Tampa | 4,570 | 1,340 | 5,910 | 5.9 | 77% |
| Las Vegas | 4,597 | 923 | 5,520 | 4.1 | 83% |
| National Cable | 4,504 | 608 | 5,112 | 10.9 | 88% |
| Charlotte | 3,557 | 1,171 | 4,728 | 3.9 | 75% |
| Greensboro | 3,160 | 1,053 | 4,213 | 1.5 | 75% |
| Philadelphia | 3,429 | 561 | 3,990 | 4.2 | 86% |
| West Palm Beach | 3,157 | 805 | 3,962 | 2.4 | 80% |
| Cincinnati | 2,549 | 1,212 | 3,761 | 1.8 | 68% |
| Reno | 2,811 | 897 | 3,708 | 1.8 | 76% |
| Pittsburgh | 2,548 | 1,017 | 3,565 | 3.2 | 71% |
| Cleveland | 2,683 | 679 | 3,362 | 3.1 | 80% |
| Raleigh | 2,762 | 510 | 3,272 | 2.2 | 84% |
| Columbus, OH | 2,323 | 833 | 3,156 | 2.2 | 74% |
| Jacksonville | 2,109 | 935 | 3,044 | 1.1 | 69% |
| Miami | 1,864 | 1,132 | 2,996 | 3.5 | 62% |
| Harrisburg | 1,965 | 936 | 2,901 | 1.5 | 68% |
| Ft. Myers | 2,053 | 743 | 2,796 | 1.0 | 73% |
| Wilkes Barre | 1,925 | 733 | 2,658 | 1.1 | 72% |
| Dayton | 2,131 | 362 | 2,493 | 1.2 | 85% |
| Des Moines | 2,180 | 309 | 2,489 | 1.3 | 88% |
| Figures are from September 16, 2016 to October 13, 2016. Numbers include broadcast television, national network and national cable. CITE SOURCE OF DATA AS: Kantar Media/CMAG with analysis by the Wesleyan Media Project. |
|||||
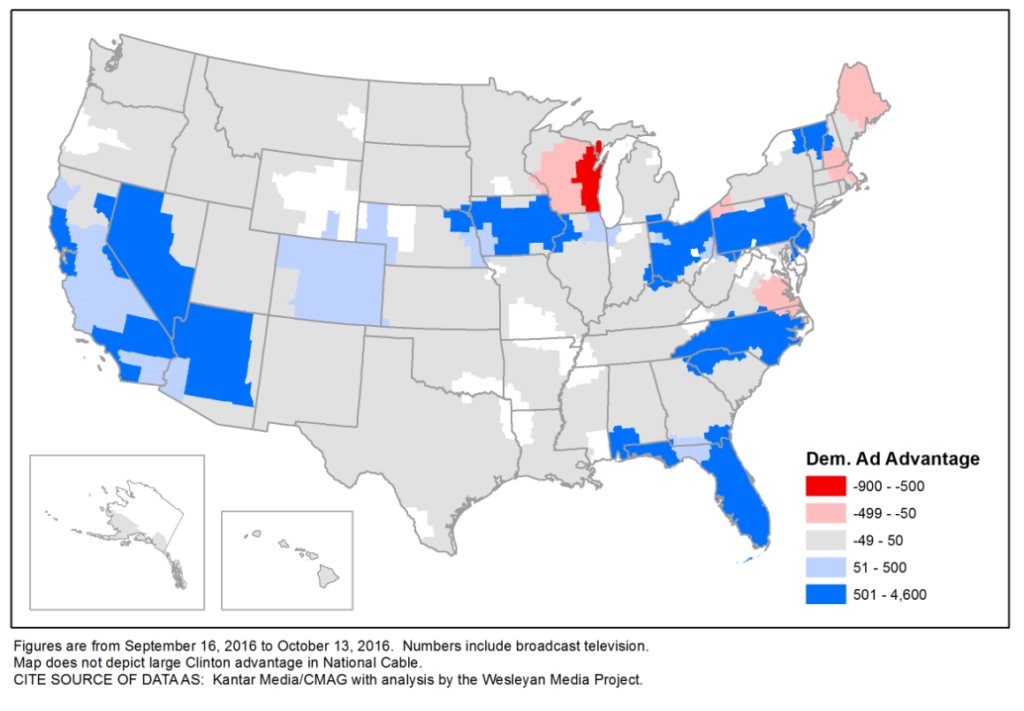
Clinton’s ad advantage does not exist in all media markets, however. Figure 5 displays Clinton’s ad advantage in each media market, with darker blue indicating those markets in which her advantage is highest and dark red markets indicating markets in which Trump has the largest ad advantage. While Clinton has an advantage in almost all of the pure battleground states, pro-Trump ads outnumber pro-Clinton ads in Wisconsin, Maine, parts of New Hampshire, parts of Virginia and in Erie, Pennsylvania.
![]()
Figure 5: Democratic Ad Advantage in Presidential Race
Dems Air More Ads in Tightest Senate Races; Ohio and Florida Exceptions
Table 6 shows the volume and cost of advertising in U.S. Senate races. Pennsylvania’s Senate race, between incumbent Pat Toomey and challenger Katie McGinty, has seen the most advertising since September 16 with over 26,000 airings at an estimated cost of $21.6 million. Indiana’s Senate race is close behind, seeing almost 24,000 ads ($11.3 million). Races in Missouri, Nevada and North Carolina round out the top 5, and in all five the Democratic candidate leads in terms of the volume of advertising. Among the top 10 Senate races, the Republican candidate leads only in Florida and Ohio, two states in which the GOP candidate holds an edge in the polls as well.
![]()
Table 6: Ad Volume and Spending in Top US Senate Races (Since September 16)
| State | Airings | Est. Cost (in Ms) | Dem Ad Adv | Pro-Dem Cand | Pro-Dem Party/ Coord | Pro-Dem Grp | Pro-Rep Cand | Pro-Rep Party/ Coord | Pro-Rep Grp |
|---|---|---|---|---|---|---|---|---|---|
| PA | 26,358 | 21.6 | 2,752 | 5,208 | 2,936 | 6,411 | 3,217 | 1,858 | 6,728 |
| IN | 23,756 | 11.3 | 5,890 | 7,024 | 4,644 | 3,155 | 3,075 | 1,232 | 4,626 |
| MO | 21,695 | 13.7 | 5 | 2,709 | 3,946 | 4,195 | 5,613 | 1,253 | 3,979 |
| NV | 20,882 | 13.6 | 2,678 | 3,846 | 2,901 | 5,033 | 1,845 | 2,091 | 5,166 |
| NC | 20,412 | 10.0 | 5,364 | 5,330 | 4,959 | 2,599 | 1,153 | 2,902 | 3,469 |
| FL | 18,135 | 15.3 | -5,419 | 3,509 | 208 | 2,641 | 5,399 | 1,394 | 4,984 |
| NH | 14,458 | 27.7 | 2,136 | 1,470 | 3,549 | 3,278 | 2,228 | 425 | 3,508 |
| WI | 10,726 | 4.2 | 1,566 | 6,006 | 0 | 140 | 2,102 | 1,401 | 1,077 |
| OH | 9,784 | 5.2 | -7,452 | 1,166 | 0 | 0 | 5,281 | 542 | 2,795 |
| IL | 7,215 | 6.3 | 925 | 4,070 | 0 | 0 | 1,889 | 222 | 1,034 |
| LA | 6,928 | 3.4 | -5,266 | 831 | 0 | 0 | 5,471 | 0 | 626 |
| AZ | 6,318 | 3.6 | -662 | 2,828 | 0 | 0 | 1,623 | 1,428 | 439 |
| GA | 4,926 | 2.2 | -1,222 | 1,852 | 0 | 0 | 3,074 | 0 | 0 |
| KY | 4,069 | 1.3 | 1,165 | 2,507 | 0 | 110 | 447 | 678 | 327 |
| AR | 2,943 | 1.0 | -143 | 1,400 | 0 | 0 | 1,543 | 0 | 0 |
| IA | 2,054 | 0.8 | -2,054 | 0 | 0 | 0 | 2,054 | 0 | 0 |
| ID | 1,893 | 0.3 | -1,881 | 6 | 0 | 0 | 1,887 | 0 | 0 |
| OR | 1,866 | 0.9 | 1,866 | 1,866 | 0 | 0 | 0 | 0 | 0 |
| NY | 1,645 | 0.6 | 1,625 | 1,635 | 0 | 0 | 0 | 0 | 10 |
| CO | 1,582 | 0.9 | 1,442 | 1,512 | 0 | 0 | 70 | 0 | 0 |
| WA | 1,391 | 1.0 | 1,391 | 1,391 | 0 | 0 | 0 | 0 | 0 |
| KS | 1,003 | 0.4 | -1,003 | 0 | 0 | 0 | 1,003 | 0 | 0 |
| ND | 959 | 0.2 | -959 | 0 | 0 | 0 | 959 | 0 | 0 |
| CT | 952 | 0.6 | 952 | 952 | 0 | 0 | 0 | 0 | 0 |
| AK | 608 | 0.1 | -608 | 0 | 0 | 0 | 608 | 0 | 0 |
| VT | 379 | 0.1 | 379 | 379 | 0 | 0 | 0 | 0 | 0 |
| HI | 208 | 0.06 | 208 | 208 | 0 | 0 | 0 | 0 | 0 |
| CA* | 126 | 0.2 | 126 | 126 | 0 | 0 | 0 | 0 | 0 |
| MD | 116 | 0.08 | 116 | 116 | 0 | 0 | 0 | 0 | 0 |
| Figures are from September 16, 2016 to October 13, 2016. Numbers include broadcast television, national network and national cable. CITE SOURCE OF DATA AS: Kantar Media/CMAG with analysis by the Wesleyan Media Project. *Two Democrats are competing against each other in California’s Senate general election. |
|||||||||
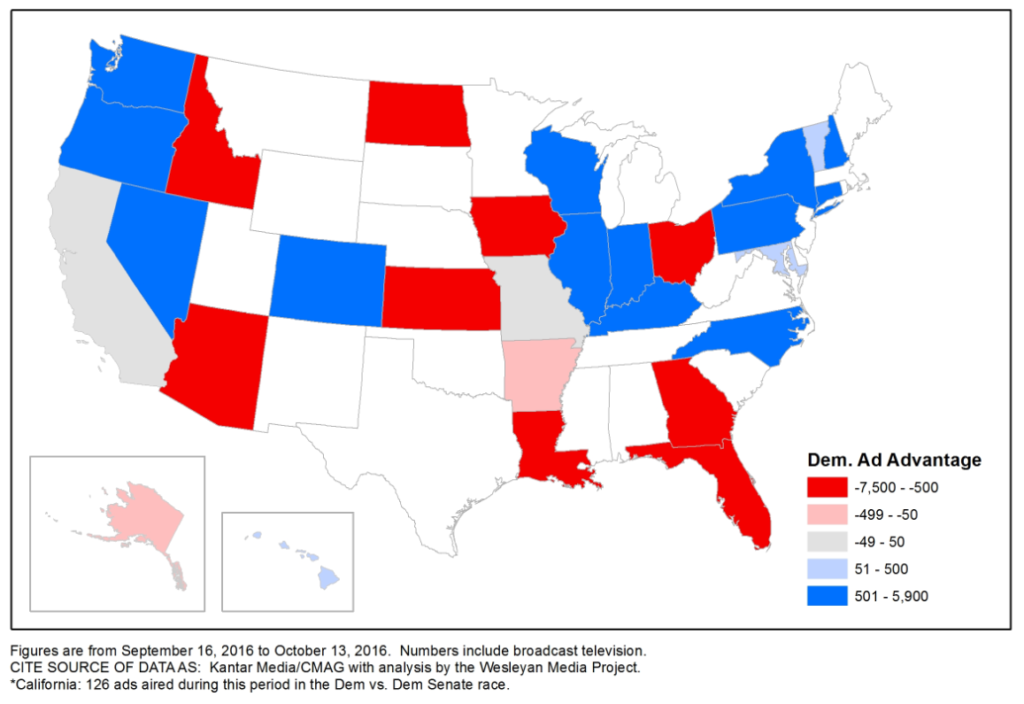
Figure 6 displays which party held an advantage in terms of the number of ads aired over the past month, with blue denoting those states with a Democratic lead and red denoting those states with a Republican lead.
![]()
Figure 6: Democratic Ad Advantage in U.S. Senate Races
Majority of Senate Ads Negative
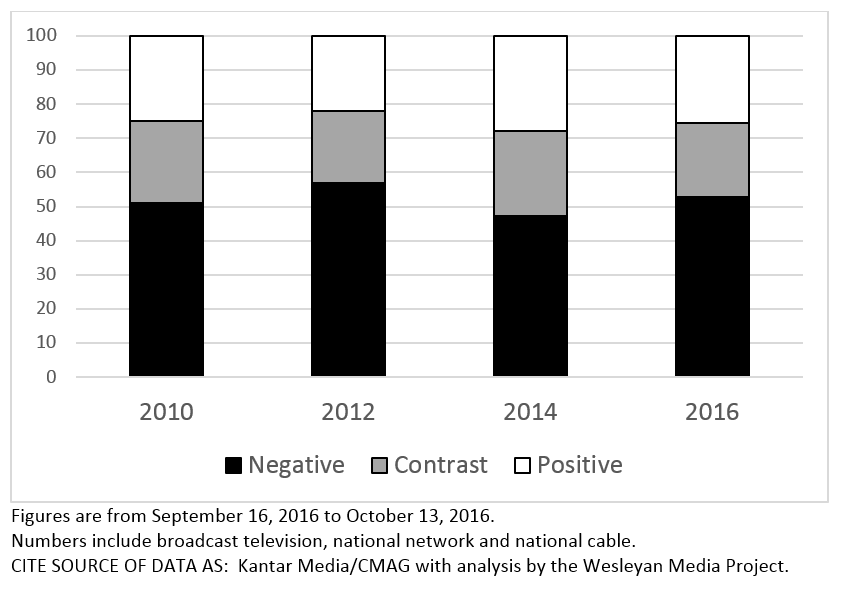
The majority of ads aired in U.S. Senate races over the past month have been negative, as Table 7 and Figure 7 show. Almost 53 percent of ads have been purely negative—focused solely on the opponent—while another 22 percent have been contrast—mentioning both the favored candidate and the opponent. These percentages are similar to what has been seen over the same time period in the last three election cycles.
![]()
Table 7: Tone of Senate Races over Time
| Year | Negative | Contrast | Positive |
|---|---|---|---|
| 2010 | 51.08 | 23.87 | 25.05 |
| 2012 | 56.93 | 21.06 | 22.01 |
| 2014 | 47.35 | 24.73 | 27.92 |
| 2016 | 52.78 | 21.82 | 25.4 |
| Figures are from September 16, 2016 to October 13, 2016. Numbers include broadcast television, national network and national cable. CITE SOURCE OF DATA AS: Kantar Media/CMAG with analysis by the Wesleyan Media Project. |
|||
![]()
Figure 7: Tone of Senate Races over Time
![]()
The most negative Senate race over the past month has been in Nevada, where 76 percent of ads have been purely negative (Table 8). The Senate races in Florida and Indiana have been similarly negative, with 3 in 4 ads being purely negative.
![]()
Table 8: Negativity in Senate Races
| State | Airings | Negative % | Contrast % | Positive % |
|---|---|---|---|---|
| NV | 20,882 | 76% | 15% | 10% |
| FL | 18,135 | 75% | 21% | 4% |
| IN | 23,756 | 74% | 11% | 16% |
| NH | 14,458 | 69% | 14% | 16% |
| NC | 20,412 | 63% | 31% | 6% |
| MO | 21,695 | 61% | 21% | 18% |
| PA | 26,358 | 60% | 23% | 18% |
| OH | 9,784 | 45% | 12% | 43% |
| WI | 10,726 | 34% | 28% | 38% |
| IL | 7,215 | 33% | 55% | 11% |
| AZ | 6,318 | 30% | 50% | 20% |
| KY | 4,069 | 20% | 3% | 78% |
| LA | 6,928 | 8% | 31% | 62% |
| NY | 1,645 | 1% | 0% | 99% |
| GA | 4,926 | 0% | 52% | 48% |
| AR | 2,943 | 0% | 48% | 52% |
| IA | 2,054 | 0% | 37% | 63% |
| CO | 1,582 | 0% | 4% | 96% |
| ID | 1,893 | 0% | 0% | 100% |
| AK | 608 | 0% | 0% | 100% |
| CA | 126 | 0% | 0% | 100% |
| CT | 952 | 0% | 0% | 100% |
| HI | 208 | 0% | 0% | 100% |
| KS | 1,003 | 0% | 0% | 100% |
| MD | 116 | 0% | 0% | 100% |
| ND | 959 | 0% | 0% | 100% |
| OR | 1866 | 0% | 0% | 100% |
| VT | 379 | 0% | 0% | 100% |
| WA | 1391 | 0% | 0% | 100% |
| Figures are from September 16, 2016 to October 13, 2016. Numbers include broadcast television, national network and national cable. CITE SOURCE OF DATA AS: Kantar Media/CMAG with analysis by the Wesleyan Media Project. |
||||
Table 9 shows that among negative ads, those attacking Democratic Senate candidates (pro-Republican ads) have been more focused on their personal characteristics than those negative ads attacking Republicans (Pro-Democratic ads). Fifty nine percent of pro-Democratic ads have attacked on policy compared to 44 percent of pro-Republican ads.
![]()
Table 9: Focus on Personal Characteristics v. Policy by Party in Senate Ads
| Party | Personal | Policy | Both |
|---|---|---|---|
| Pro-Rep % (attacking Dems) | 30.1 | 44.4 | 24.4 |
| Pro-Dem % (attacking GOP) | 16.7 | 59.1 | 21.8 |
| Figures are from September 16, 2016 to October 13, 2016. Numbers include broadcast television, national network and national cable. Based on Wesleyan Media Project coding of Kantar Media/CMAG data (excluding Spanish-language advertising). |
|||
Clinton Frequently Mentioned in GOP Ads; Trump Largely Ignored by Dems
Table 10 reveals that anti-Clinton references appear in more than one of every 10 pro-Republican Senate ads (14 percent), which is more common than disapproving mentions of Obama (which occur in 9.5 percent). Anti-Trump references occur in only 2 percent of pro-Democratic ads.
“Democrats have been very cautious in their attempts to link Trump with Republican Senate candidates,” said Michael Franz, co-director of the Wesleyan Media Project. “The expectation was that Democrats would pin Trump to down ballot candidates. They have not, and it’s very surprising.”
Democratic ads are about twice as likely as Republican ads to convey anti-Congress or anti-Washington sentiments.
![]()
Table 10: Disapproving References by Party in Senate Ads
| Mention | Overall % | Pro-Dem % | Pro-Rep % |
|---|---|---|---|
| Obama | 4.7 | 0.1 | 9.5 |
| Clinton | 7.0 | 0.0 | 14.2 |
| Trump | 1.0 | 1.9 | 0.0 |
| Congress | 5.1 | 6.7 | 3.5 |
| Washington | 17.2 | 24.5 | 9.7 |
| Figures are from September 16, 2016 to October 13, 2016. Numbers include broadcast television, national network and national cable. Based on Wesleyan Media Project coding of Kantar Media/CMAG data (excluding Spanish-language advertising). |
|||
Democrats Speak of Wall Street; Republicans Attack Obamacare
The Wesleyan Media Project also coded for specific words that appeared in Senate advertising. Wall Street is mentioned in 11 percent of all pro-Democratic Senate ads but in only 3.8 percent of Republican ads (Table 11). Obamacare is mentioned in over 12 percent of all pro-Republican Senate ads but in only 1.3 percent of Democratic ads. The ideological label, liberal, is also commonly used in Republican advertising, appearing in nearly 12 percent of Republican ads. Not a single Democratic ad mentions the word, however.
![]()
Table 11: Word Mentions by Party in Senate Ads
| Words | Democrats % | Republicans % |
|---|---|---|
| Change | 1.7 | 0.0 |
| Liberal | 0.0 | 11.5 |
| Conservative | 1.0 | 4.6 |
| Special Interests | 8.2 | 4.0 |
| Working Class | 1.9 | 1.7 |
| Middle Class | 3.4 | 2.9 |
| Wall Street | 11.6 | 3.8 |
| Big Government | 0.0 | 1.3 |
| Obamacare | 1.3 | 12.3 |
| Planned Parenthood | 6.4 | 0.0 |
| Out-of-State Money | 0.0 | 1.4 |
| Rigged | 1.3 | 0.5 |
| Figures are from September 16, 2016 to October 13, 2016. Numbers include broadcast television, national network and national cable. Based on Wesleyan Media Project coding of Kantar Media/CMAG data (excluding Spanish-language advertising). |
||
Maine House Race Sees Most Advertising
Table 12 focuses on the volume and cost of advertising in top U.S. House races since September 16. Maine’s second congressional district leads the pack. Over 9000 ads have aired in that race over the past month. Montana’s at-large congressional district, New York-22, Minnesota-08 and Florida-18 round out the top five House races in terms of ad volumes. In general, Democratic candidates have benefitted from more advertising than their Republican opponents. Democrats held an ad advantage in 8 of the top 10 races and in 16 of the top 20 races over the past month.
![]()
Table 12: Ad Volume and Spending in Top US House Races (Since September 16)
| Race | Airings | Est. Cost (in Ms) | Dem Adv. | Pro-Dem Cand | Pro-Dem Party/Coord | Pro-Dem Grp | Pro-Rep Cand | Pro-Rep Party/Coord | Pro-Rep Grp |
|---|---|---|---|---|---|---|---|---|---|
| ME02 | 9,327 | 2.8 | 2,515 | 3,697 | 749 | 1,475 | 1,463 | 1,943 | 0 |
| MT01 | 7,683 | 0.8 | -669 | 3,507 | 0 | 0 | 4,176 | 0 | 0 |
| NY22 | 6,100 | 1.3 | 5,834 | 2,736 | 0 | 3,231 | 133 | 0 | 0 |
| MN08 | 5,438 | 4.4 | 1,150 | 691 | 1,402 | 1,201 | 659 | 1,196 | 289 |
| FL18 | 4,950 | 2.3 | -118 | 2,416 | 0 | 0 | 9 | 1,805 | 720 |
| CA24 | 4,913 | 0.8 | 249 | 1,235 | 0 | 1,346 | 1,312 | 1,020 | 0 |
| TX23 | 4,803 | 3.2 | 1,093 | 682 | 2,266 | 0 | 793 | 973 | 89 |
| NY24 | 4,479 | 0.9 | 617 | 545 | 2,003 | 0 | 919 | 832 | 180 |
| NY19 | 4,390 | 1.5 | 264 | 1,084 | 593 | 650 | 31 | 1,446 | 586 |
| NE02 | 4,221 | 1.6 | 313 | 1,022 | 710 | 535 | 238 | 1,716 | 0 |
| CO06 | 3,946 | 3.1 | -46 | 354 | 1,207 | 389 | 619 | 1,377 | 0 |
| NV03 | 3,859 | 2.6 | 461 | 440 | 1,468 | 252 | 297 | 1,101 | 301 |
| IA01 | 3,787 | 1.2 | 367 | 815 | 769 | 493 | 836 | 874 | 0 |
| NV04 | 3,760 | 2.3 | 178 | 0 | 1,969 | 0 | 0 | 1,791 | 0 |
| IA03 | 3,742 | 1.2 | 512 | 931 | 1,196 | 0 | 918 | 697 | 0 |
| AZ02 | 3,716 | 1.1 | -1,162 | 1,277 | 0 | 0 | 2,439 | 0 | 0 |
| CA49 | 3,517 | 1.4 | 1,117 | 0 | 2,317 | 0 | 1,200 | 0 | 0 |
| PA08 | 3,370 | 3.2 | 1,424 | 222 | 2,175 | 0 | 284 | 689 | 0 |
| MI07 | 3,213 | 1.1 | 429 | 1,821 | 0 | 0 | 1,130 | 262 | 0 |
| NY21 | 3,141 | 0.6 | 685 | 1,913 | 0 | 0 | 1,228 | 0 | 0 |
| UT04 | 3,140 | 1.4 | 384 | 1,762 | 0 | 0 | 1,378 | 0 | 0 |
| MN03 | 3,037 | 2.4 | 991 | 776 | 1,238 | 0 | 1,016 | 7 | 0 |
| FL26 | 2,846 | 2.7 | 184 | 49 | 1,306 | 160 | 456 | 852 | 23 |
| MN02 | 2,740 | 2.5 | 1,564 | 979 | 698 | 475 | 119 | 469 | 0 |
| CA07 | 2,716 | 1.4 | 356 | 898 | 638 | 0 | 382 | 485 | 313 |
| AZ01 | 2,711 | 1.3 | 1,425 | 741 | 1,327 | 0 | 492 | 151 | 0 |
| CA21 | 2,681 | 0.7 | -869 | 0 | 0 | 906 | 1,775 | 0 | 0 |
| WI08 | 2,492 | 0.8 | -424 | 943 | 91 | 0 | 627 | 831 | 0 |
| CO03 | 2,482 | 1.0 | 384 | 729 | 0 | 704 | 475 | 574 | 0 |
| Figures are from September 16, 2016 to October 13, 2016. Numbers include broadcast television, national network and national cable. CITE SOURCE OF DATA AS: Kantar Media/CMAG with analysis by the Wesleyan Media Project. |
|||||||||
Montana Race for Governor Garners Most Ads
Table 13 shows advertising levels in gubernatorial races, with Montana’s race between incumbent Democrat Steve Bullock and Republican challenger Greg Gianforte topping the list. Pro-Gianforte ads have outnumbered pro-Bullock ads by nearly 8,000 over the last month. North Carolina’s gubernatorial race between incumbent Republican Pat McCrory and Democratic challenger Roy Cooper ranks number two in volume of airings (though it is highest in cost), with pro-Cooper ads dominating. Missouri’s open race between Democrat Chris Koster and Republican Eric Greitens ranks third overall in volume, with Koster-sponsored ads slightly edging out Greitens-sponsored ones by just over 700 airings.
![]()
Table 13: Ad Volume and Spending in Top Gubernatorial Races (Since September 16)
| Gov Race | Airings | Est Cost (in Millions) | Dem Ad Adv | Dem Cand | Dem Party | Dem Group | Rep Cand | Rep Party | Rep Group |
|---|---|---|---|---|---|---|---|---|---|
| MT | 20,056 | 2.4 | -7,924 | 2,898 | 0 | 3,168 | 12,940 | 1,050 | 0 |
| NC | 16,493 | 7.7 | 5,537 | 8,544 | 0 | 2,471 | 3,920 | 1,558 | 0 |
| MO | 15,825 | 5.5 | 724 | 8,274 | 0 | 0 | 7,550 | 0 | 0 |
| IN | 9,647 | 3.4 | 21 | 4,759 | 0 | 75 | 4,813 | 0 | 0 |
| OR | 3,459 | 1.1 | 2,009 | 2,734 | 0 | 0 | 725 | 0 | 0 |
| VT | 2,937 | 1.2 | 87 | 622 | 0 | 890 | 287 | 0 | 1,138 |
| WV | 2,868 | 0.6 | 104 | 1,484 | 0 | 2 | 780 | 602 | 0 |
| NH | 1,471 | 2.3 | 965 | 102 | 635 | 481 | 0 | 0 | 253 |
| WA | 1,277 | 1.3 | 919 | 1,098 | 0 | 0 | 179 | 0 | 0 |
| UT | 266 | 0.2 | 266 | 266 | 0 | 0 | 0 | 0 | 0 |
| ND | 166 | 0.04 | -166 | 0 | 0 | 0 | 166 | 0 | 0 |
| Figures are from September 16, 2016 to October 13, 2016. Numbers include broadcast television, national network and national cable. CITE SOURCE OF DATA AS: Kantar Media/CMAG with analysis by the Wesleyan Media Project. |
|||||||||
In terms of tone, the race for governor in West Virginia is the most negative by far, with 99.7 percent of ad airings in the past month classified as purely negative. At the other extremely, all airings in the North Dakota race for governor have been positive, though there have been only 166 airings in the past month.
![]()
Table 14: Most Negative Gubernatorial Races
| State | Airings | Negative % | Contrast % | Positive % |
|---|---|---|---|---|
| WV | 2,868 | 99.7 | 0.0 | 0.3 |
| NC | 16,493 | 75.2 | 15.8 | 8.9 |
| MT | 20,056 | 64.4 | 6.3 | 29.3 |
| MO | 15,825 | 56.0 | 17.6 | 26.3 |
| NH | 1,471 | 49.9 | 5.2 | 44.9 |
| VT | 2,937 | 47.8 | 7.8 | 44.4 |
| IN | 9,647 | 40.1 | 19.7 | 40.3 |
| OR | 3,459 | 21.0 | 0.0 | 79.0 |
| WA | 1,277 | 14.0 | 0.0 | 86.0 |
| UT | 266 | 10.2 | 0.0 | 89.8 |
| ND | 166 | 0.0 | 0.0 | 100.0 |
| Figures are from September 16, 2016 to October 13, 2016. Numbers include broadcast television, national network and national cable. CITE SOURCE OF DATA AS: Kantar Media/CMAG with analysis by the Wesleyan Media Project. |
||||
Most Active Groups Are Super PACs
An analysis of group activity this election cycle, done in conjunction with the Center for Responsive Politics, reveals that the majority of the most active groups are those that do disclose their donors (Table 15). Airing the most ads in the presidential race is Priorities USA Action, a pro-Clinton super PAC. Most active in Senate races has been Senate Majority PAC, a super PAC working to elect Democrats to the Senate. Right to Rise, Jeb Bush’s super PAC, even though they have not aired any ads for months, is still the third most active group in this election cycle. All three are super PACs and thus must disclose their donors.
However, two of the ten most active groups this cycle, One Nation and the U.S. Chamber of Commerce, are “dark money” groups that do not disclose who their donors are.
![]()
Table 15: Top Group Advertisers in 2015-16 Election Cycle
| Group | Ad Airings | Pres Ads | Sen Ads | House Ads | Disclose?* | Org. Type |
|---|---|---|---|---|---|---|
| Priorities USA Action | 66,278 | 66,278 | 0 | 0 | Y | super PAC |
| Senate Majority PAC | 38,189 | 0 | 38,189 | 0 | Y | super PAC |
| Right To Rise USA | 35,558 | 35,558 | 0 | 0 | Y | super PAC |
| Conservative Solutions PAC | 30,169 | 30,169 | 0 | 0 | Y | super PAC |
| Freedom Partners Action Fund | 25,126 | 0 | 25,126 | 0 | Y | super PAC |
| Senate Leadership Fund | 22,606 | 0 | 22,606 | 0 | Y | superPAC |
| One Nation | 20,216 | 0 | 20,216 | 0 | N | c4 |
| U.S. Chamber of Commerce | 17,266 | 0 | 15,073 | 2,193 | N | c6 |
| House Majority PAC | 16,075 | 0 | 0 | 16,075 | Y | super PAC |
| Fighting For Ohio Fund | 12,846 | 0 | 12,846 | 0 | Y | super PAC |
| Club For Growth Action | 12,612 | 6,548 | 991 | 5,073 | Y | super PAC |
| Women Vote | 11,082 | 1,305 | 9,477 | 300 | P | super PAC |
| Rebuilding America Now PAC | 10,498 | 10,498 | 0 | 0 | Y | super PAC |
| Stand For Truth, Inc | 10,330 | 10,330 | 0 | 0 | Y | super PAC |
| American Future Fund | 8,380 | 5,291 | 3,089 | 0 | N | c4 |
| NRA Inst. for Legislative Action | 7,948 | 5,119 | 2,829 | 0 | N | c4 |
| AFSCME People | 7,417 | 0 | 7,417 | 0 | Y | PAC |
| End Citizens United | 7,085 | 0 | 5,623 | 1,462 | Y | PAC |
| Our Principles PAC | 7,000 | 7,000 | 0 | 0 | Y | super PAC |
| NextGen California Action Cmte | 6,911 | 6,911 | 0 | 0 | Y | super PAC |
| NRA Political Victory Fund | 6,313 | 4,618 | 1,695 | 0 | Y | PAC |
| Americans For Prosperity | 5,427 | 0 | 5,427 | 0 | N | c4 |
| New Day For America | 5,394 | 5,394 | 0 | 0 | Y | super PAC |
| America Leads | 5,377 | 5,377 | 0 | 0 | Y | super PAC |
| Granite State Solutions | 5,039 | 0 | 5,039 | 0 | Y | super PAC |
| Keep The Promise I | 4,957 | 4,957 | 0 | 0 | Y | super PAC |
| Conservative Solutions Project | 4,882 | 4,882 | 0 | 0 | N | c4 |
| Independence USA Pac | 4,787 | 0 | 4,392 | 395 | Y | super PAC |
| Group classification by the Center for Responsive Politics. Figures are from January 1, 2015 to October 13, 2016. Numbers include broadcast television, national network and national cable. CITE SOURCE OF DATA AS: Kantar Media/CMAG with analysis by the Wesleyan Media Project. *In the Disclose column, a Y indicates the group full discloses its donors, a P indicates partial disclosure, while N indicates no disclosure of donors. |
||||||
Dark Money Declines in Senate Races as Election Day Approaches
Groups have been sponsoring a large number of the ads airing in the most competitive Senate races, but the extent of their involvement has varied across the course of the campaign. In the past month, the average competitive Senate race has seen about 35 percent of its ads sponsored by groups, but prior to September 16, the average race saw about 44 percent of its ads sponsored by groups. As Election Day approaches and candidate-sponsored advertising ramps up, the involvement of groups as a percentage of total ads declines. See Table 16.
The other important change is that, as we approach Election Day, the percentage of ads sponsored by “dark money” groups—those that do not disclose their donors—has declined. On average, it was 42.5 percent of group ads prior to September 16, but since the FEC’s 60-day reporting window has kicked in, dark money groups have sponsored, on average, only about 11 percent of group-sponsored ads in the most competitive Senate races.
![]()
“We’re seeing dark money groups that have spent millions of dollars in Senate races fade away, rather than report their spending to the FEC as they’re required to do beginning two months before the election,” said Sheila Krumholz, the executive director of the Center for Responsive Politics. “It’s a way to get around telling the IRS next year that a great deal of their activity was political, which isn’t supposed to be the case with 501(c) groups.”
![]()
Table 16: Group Involvement in Competitive Senate Races over Time
| State | Est. Cost (in Ms) | Ad Airings | % group | % of grp that is dark money |
|---|---|---|---|---|
| Between 9/16 and 10/13 | ||||
| PA | 21.6 | 26,358 | 49.8% | 8.8% |
| IN | 11.3 | 23,756 | 32.8% | 12.2% |
| MO | 13.7 | 21,695 | 37.7% | 29.4% |
| NV | 13.7 | 20,882 | 48.8% | 17.1% |
| NC | 10.0 | 2,0412 | 29.7% | 9.0% |
| FL | 15.3 | 18,135 | 42.0% | 21.6% |
| NH | 27.7 | 14,458 | 46.9% | 1.8% |
| WI | 4.2 | 10,726 | 11.3% | 11.5% |
| OH | 5.2 | 9,784 | 28.6% | 0.0% |
| IL | 6.3 | 7,215 | 14.3% | 0.0% |
| mean | 34.2% | 11.1% | ||
| total | 37.4% | 13.4% | ||
| From 1/1/2015 to 9/15/16 | ||||
| PA | 64.4 | 63,971 | 61.4% | 33.1% |
| OH | 48.9 | 63,489 | 78.6% | 28.1% |
| WI | 21.1 | 35,992 | 35.8% | 53.8% |
| NV | 22.3 | 34,320 | 55.8% | 32.3% |
| IN | 15.7 | 32,348 | 21.0% | 36.7% |
| FL | 22.1 | 25,736 | 29.0% | 58.5% |
| NH | 45.6 | 22,435 | 62.9% | 39.0% |
| CO | 9.9 | 14,743 | 22.8% | 56.9% |
| MO | 8.6 | 14,220 | 32.1% | 51.4% |
| IL | 13.1 | 12,271 | 38.5% | 35.7% |
| mean | 43.8% | 42.5% | ||
| total | 50.8% | 36.0% | ||
| Numbers include broadcast television, national network and national cable. CITE SOURCE OF DATA AS: Kantar Media/CMAG with analysis by the Wesleyan Media Project. |
||||
Clinton Emphasizes Jobs, Trump Emphasizes Taxes
Table 17 lists the top issues mentioned by the Trump and Clinton campaigns—and the number of times each issue was mentioned in their advertising. The Clinton campaign has been focused foremost on jobs and unemployment during the past four weeks, though veterans’ issues, the economy and education are also in their top five. The Trump campaign, by contrast, has focused on the issue of taxes, with terrorism, women’s rights and jobs receiving many mentions as well.
The issues mentioned by the groups supporting the candidates are quite different. Groups supporting Clinton discussed immigration, first and foremost, followed by terrorism, faith, civil rights and green energy. Groups supporting Trump most frequently mentioned gun control, followed by the Supreme Court, public safety, jobs and unemployment.
![]()
Table 17: Top Issues in Presidential Race by Sponsor
| Clinton | Pro-Clinton Groups | Trump | Pro-Trump Groups |
|---|---|---|---|
| Jobs | Immigration | Taxes | Gun Control |
| Unemployment | Terrorism | Terrorism | Supreme Court |
| Vets | Faith | Women’s Rights | Public Safety |
| Economy | Civil Rights | Jobs | Jobs |
| Education | Green Energy | Unemployment | Unemployment |
| Figures are from September 16, 2016 to October 13, 2016. Numbers include broadcast television, national network and national cable. CITE SOURCE OF DATA AS: Kantar Media/CMAG with analysis by the Wesleyan Media Project. |
|||
Appendix
Download Table A: US Senate Advertising by Race and Sponsor (since September 16)
Figures are from September 16, 2016 to October 13, 2016.
CITE SOURCE OF DATA AS: Kantar Media/CMAG with analysis by the Wesleyan Media Project.
![]()
Download Table B: US House Advertising by Race and Sponsor (since September 16)
Figures are from September 16, 2016 to October 13, 2016.
CITE SOURCE OF DATA AS: Kantar Media/CMAG with analysis by the Wesleyan Media Project.
![]()
Download Table C: Gubernatorial Advertising by Race and Sponsor (since September 16)
Figures are from September 16, 2016 to October 13, 2016.
CMAG classifies both RGA and RGA Right Direction PAC as parties, as both explicitly mention RGA (“Republican Governors Assn.”).
CITE SOURCE OF DATA AS: Kantar Media/CMAG with analysis by the Wesleyan Media Project.
![]()
Download a PDF of this report here
![]()
![]()
About This Report
Data reported here do not cover local cable buys, only broadcast television, national network and national cable buys. We include all ads that mention individuals running for office, and therefore sums may include issue advocacy advertising. All cost estimates are precisely that: estimates. Disclosure categorization information on outside groups comes from the Center for Responsive Politics.
The Wesleyan Media Project provides real-time tracking and analysis of all political television advertising in an effort to increase transparency in elections. Housed in Wesleyan’s Quantitative Analysis Center – part of the Allbritton Center for the Study of Public Life – the Wesleyan Media Project is the successor to the Wisconsin Advertising Project, which disbanded in 2009. It is directed by Erika Franklin Fowler, associate professor of government at Wesleyan University, Michael M. Franz, associate professor of government at Bowdoin College and Travis N. Ridout, professor of political science at Washington State University. WMP staff include Laura Baum (Project Manager), Dolly Haddad (Project Coordinator) and Matthew Motta (Research Associate).
The Wesleyan Media Project is supported by grants from The John S. and James L. Knight Foundation and Wesleyan University. Data provided by Kantar Media/CMAG with analysis by the Wesleyan Media Project using Academiclip, a web-based coding tool. The Wesleyan Media Project is partnering this year with both the Center for Responsive Politics, to provide added information on outside group disclosure, and Ace Metrix, to assess ad effectiveness.
Periodic releases of data will be posted on the project’s website and dispersed via Twitter @wesmediaproject.
![]()
For more information contact:
Heather Tolley-Bauer, htolleybauer@wesleyan.edu, (860) 398-9018
![]()
About Wesleyan University
Wesleyan University, in Middletown, Conn., is known for the excellence of its academic and co-curricular programs. With more than 2,900 undergraduates and 200 graduate students, Wesleyan is dedicated to providing a liberal arts education characterized by boldness, rigor and practical idealism. For more, visit www.wesleyan.edu.
About the John S. and James L. Knight Foundation
Knight Foundation supports transformational ideas that promote quality journalism, advance media innovation, engage communities and foster the arts. We believe that democracy thrives when people and communities are informed and engaged. For more, visit www.knightfoundation.org.
About the Center for Responsive Politics
The Center for Responsive Politics is the nation’s premier research group tracking money in U.S. politics and its effect on elections and public policy. Nonpartisan, independent and nonprofit, the organization aims to create a more educated voter, an involved citizenry and a more transparent and responsive government. CRP’s award-winning website, OpenSecrets.org, is the most comprehensive resource available anywhere for federal campaign contribution and lobbying data and analysis.
![]()


