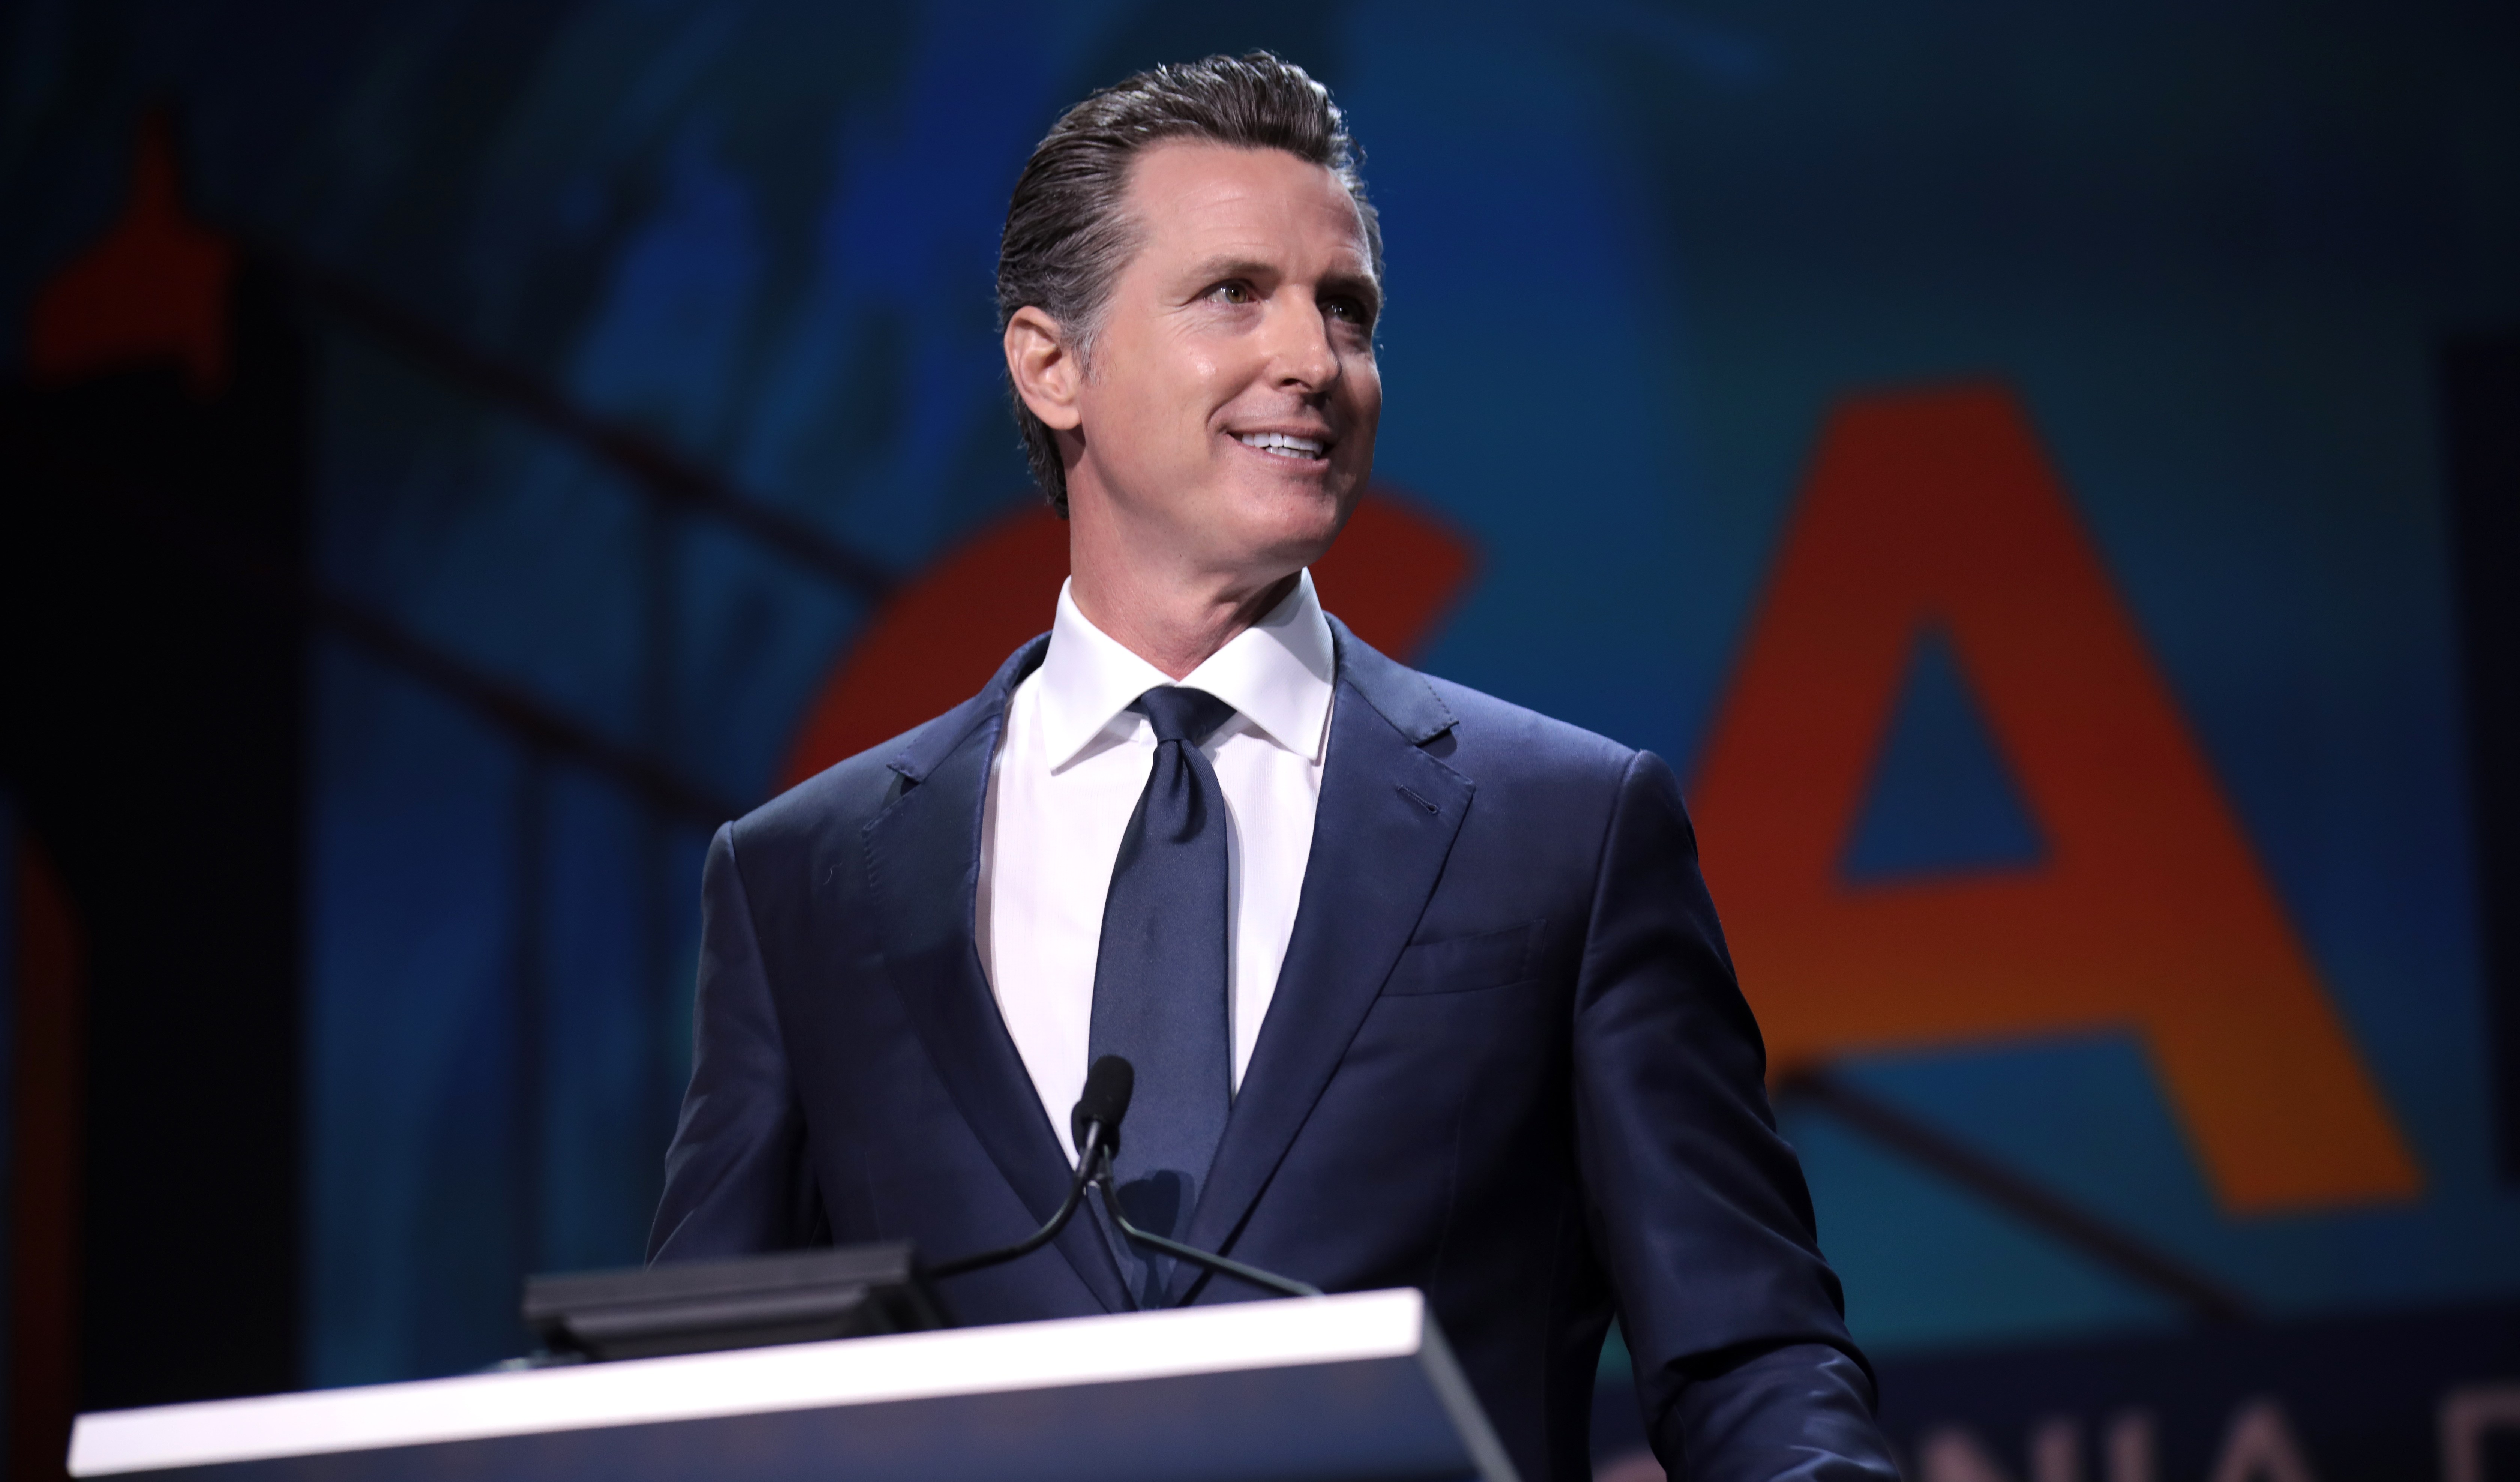
Photo Gage Skidmore/Flickr
Dark Money Up 26% over 2014;
Over $40M in California for House, Senate, and Governor
![]()
June 7, 2018
![]()
Report Highlights
• Over 1 million ads (nearly $375 M) in congressional and gov races since Jan. 1, 2017 (Table 3)
• Midterm ad volumes overall have nearly doubled over the previous midterm cycle (Table 3)
• Nearly a quarter million ads costing over $70 million aired in states with primaries on June 5 (Table 1)
• Summary of ad airings & spending in states with June 12 primaries (Table 2)
• California Charter Schools Association Advocates tops list of biggest outside group advertisers (Table 7)
• Majority of outside group advertisers don’t fully disclose donors (Table 8)
• Dems talk healthcare, anti-Trump; GOP focus on pro-Trump, immigration, economy (Tables 9 and 10)
![]()
(MIDDLETOWN, CT) June 7, 2018 – The 2018 general election has begun in several states that held June 5 primary races, and it will begin soon in another set of states that hold primaries next Tuesday. With much at stake in the November midterms, there has been no shortage of advertising in the 2018 cycle. The number of television ads aired in federal and gubernatorial races is up by 86 percent over the comparable period in 2014, and dark money advertising is up by 26 percent. Primary contests in early June have seen thousands of ads and nearly $100M in spending.
As Table 1 shows, over $34 million was spent on over 47,000 ads to advance candidates to the second round of California’s race for governor from which Democrat Gavin Newsom and Republican John Cox emerged. Five gubernatorial candidates and three outside groups were on the air through Monday, June 4. Another $7 million was spent on nearly 21,000 ads for House candidates in California during the primary phase of the campaign, but spending in the state’s U.S. Senate contest has been relatively low, less than $5 million for just over 10,000 airings.
The U.S. Senate race that has attracted the most advertising is Montana’s, where four Republicans vied for the chance to take on potentially vulnerable incumbent Jon Tester. Tester, who was unopposed in the primary, aired over 14,000 spots on local broadcast stations across the state, spending $1 million. In recent weeks three groups aired over 2,500 spots in support of Tester, including Vote Vets, Senate Majority PAC, and the American Bankers Association. On the Republican side, the four candidates aired over 6,000 ads, while five groups were active in recent months on behalf of Republican candidates, including the Club for Growth (opposing Republican Russ Fagg and supporting Matt Rosendale), Americans for Prosperity (opposing Tester), Restoration PAC (pro-Rosendale), and American First Action (opposing Tester).
All told, nearly 250,000 spots costing over $70 million have aired in states with races on June 5th.
![]()
Table 1: Ad Airings and Spending in States with June 5 Primaries
| # Ads | Est. Cost (in Ms) | |
|---|---|---|
| Senate | ||
| CA | 10,074 | 4.7 |
| MS | 6,279 | 1.6 |
| MT | 29,928 | 5.3 |
| NJ | 2,091 | 2.4 |
| NM | 0 | 0 |
| Governor | ||
| AL | 15,805 | 2.4 |
| CA | 47,014 | 34.4 |
| IA | 17,165 | 2.4 |
| NM | 4,985 | 0.7 |
| SD | 8,510 | 1.2 |
| House | ||
| AL | 4,102 | 0.8 |
| CA | 20,918 | 7.1 |
| IA | 8,979 | 1.8 |
| MS | 2,186 | 0.5 |
| MT* | 51,671 | 4.6 |
| NJ | 628 | 0.6 |
| NM | 10,634 | 1.8 |
| SD | 3,202 | 0.45 |
| Total | 245,410 | 72.9 |
| *Total includes the MT-01 special election in 2017 Figures are from January 1, 2017 to June 4, 2018. Numbers include broadcast television. CITE SOURCE OF DATA AS: Kantar Media/CMAG with analysis by the Wesleyan Media Project. |
||
For races on June 12th, sponsors have spent over $25 million on 75,000 ad airings (Table 2). The Senate and gubernatorial races in Nevada account for over half of that spending, and the race for governor in South Carolina has attracted considerable spending as well (over $5 million).
![]()
Table 2: Ad Airings and Spending in States with June 12 Primaries
| # Ads | Est. Cost (in Ms) | |
|---|---|---|
| House | ||
| ME | 3,406 | 0.6 |
| NV | 1,455 | 0.6 |
| ND | 1,197 | 100K |
| SC* | 8,577 | 2.4 |
| VA | 3,850 | 2.1 |
| Senate | ||
| ME | 389 | 72K |
| NV | 13,762 | 6.0 |
| ND | 6,399 | 1.3 |
| VA | 0 | 0 |
| Governor | ||
| ME | 3,641 | 0.6 |
| NV | 13,186 | 6.7 |
| SC | 19,709 | 5.3 |
| Total | 75,571 | 25.8 |
| *Total includes the SC-5 special election in 2017 Figures are from January 1, 2017 to June 4, 2018. Numbers include broadcast television. CITE SOURCE OF DATA AS: Kantar Media/CMAG with analysis by the Wesleyan Media Project. |
||
Ad Volumes Almost Double 2014 Cycle
In cycle-to-date numbers, over 1 million ads have aired in congressional and gubernatorial races since January 1, 2017. One in four airings has been from outside groups. The total cost of TV ads to date is nearly $375 million in the 2017-18 cycle. Table 3 shows the volume of ads in the current election cycle compared with the volume of ads in the 2013-14 election cycle. Overall, there has been a massive increase in advertising from four years ago.
![]()
“The rise in advertising has been especially prominent in House races and gubernatorial races, where ad volumes have more than doubled from four years ago,” said Travis Ridout, co-director of the Wesleyan Media Project. “One reason is that groups are starting their advertising earlier than the past, trying to shape primary race outcomes. Moreover, we’ve seen more candidates throwing their hats in the ring this cycle than in the past, especially on the Democratic side.”
![]()
Table 3: Cycle-to-Date Midterm Comparison, 2014 vs. 2018
| Candidate Ads | Party Ads | Group Ads | Coord Ads | Total Ads | % Inc. | ||
|---|---|---|---|---|---|---|---|
| 2014 | House | 72,044 | 5,254 | 32,399 | 396 | 110,093 | |
| Senate | 113,656 | 452 | 111,255 | 929 | 226,292 | ||
| Governor | 146,796 | 4,814 | 61,272 | 5,984 | 218,866 | ||
| Total | 332,496 | 10,502 | 204,926 | 7,309 | 555,251 | ||
| 2018 | House | 165,135 | 14,398 | 69,682 | 1,286 | 250,501 | +128 % |
| Senate | 164,569 | 7 | 104,695 | 1,344 | 270,615 | +20% | |
| Governor | 428,297 | 3,729 | 82,185 | 0 | 514,211 | +135% | |
| Total | 758,001 | 18,134 | 256,562 | 2,630 | 1,035,327 | +86% | |
| % increase | +128% | +72% | +25% | -64% | |||
| Figures are from January 1, 2013 to June 4, 2014 and January 1, 2017 to June 4, 2018. Numbers include broadcast television. CITE SOURCE OF DATA AS: Kantar Media/CMAG with analysis by the Wesleyan Media Project. |
|||||||
Table 4 shows cycle-to-date ad volumes in specific Senate races. At the top of the list is last year’s special election in Alabama, followed by the Senate races in Florida and Indiana. Among states holding June 5 primaries, Montana’s and California’s Senate campaigns crack the top 10 in ad spending. Nevada, a state with a June 12 primary, is also among the top 10 Senate races in ad spending.
![]()
“Outside group spending has been especially heavy in many of the most competitive Senate races,” said Michael Franz, co-director of the Wesleyan Media Project. “In some states, such as Wisconsin, Nevada and Missouri, over 70 percent of the ads aired so far have been group sponsored.”
![]()
Table 4: Ad Volumes and Spending in Top Senate Races
| State | # Ads | Est. Cost (in Ms) | Dem Cand Ads | GOP Cand Ads | Dem Group Ads | GOP Group Ads | % Group |
|---|---|---|---|---|---|---|---|
| AL | 59,857 | 14.0 | 23,215 | 17,411 | 3,565 | 14,322 | 29.9% |
| FL | 14,855 | 10.6 | 0 | 9,805 | 2,358 | 2,692 | 34.0% |
| IN | 41,080 | 10.3 | 3,127 | 23,017 | 5,025 | 9,904 | 36.3% |
| WI | 21,503 | 6.5 | 4,755 | 0 | 4,971 | 11,770 | 77.9% |
| NV | 13,762 | 6.0 | 3,224 | 497 | 9,305 | 660 | 72.4% |
| WV | 33,192 | 5.8 | 870 | 22,068 | 6,144 | 4,034 | 30.7% |
| MO | 11,618 | 5.4 | 1,563 | 0 | 4,945 | 5,110 | 86.5% |
| MT | 29,928 | 5.3 | 14,071 | 6,166 | 4,349 | 5,337 | 32.4% |
| CA | 10,074 | 4.7 | 10,023 | 0 | 51 | 0 | 0.5% |
| AZ | 6,923 | 3.0 | 4,031 | 2 | 2,830 | 23 | 41.2% |
| NJ | 2,091 | 2.4 | 0 | 2,091 | 0 | 0 | 0.0% |
| MS | 6,279 | 1.6 | 1,302 | 3,547 | 0 | 1,430 | 22.8% |
| ND | 6,399 | 1.3 | 1,121 | 1,669 | 2,066 | 1,437 | 54.7% |
| OH | 3,201 | 1.2 | 1,710 | 1,321 | 0 | 164 | 5.1% |
| TN | 5,696 | 1.0 | 5,037 | 0 | 0 | 0 | 0.0% |
| Figures are from January 1, 2017 to June 4, 2018. Numbers include broadcast television. CITE SOURCE OF DATA AS: Kantar Media/CMAG with analysis by the Wesleyan Media Project. |
|||||||
Turning to gubernatorial races in Table 5, the most expensive this cycle is the barnburner in Illinois, where over $41 million has been spent on ads so far. California’s is the second most expensive race this cycle, with spending at $34 million. Nevada, which holds a June 12 primary, comes in tenth place with over 13,000 airings costing over $6.5 million. Outside groups have been especially active in the Florida race, where they account for 62 percent of all airings, and to a lesser, but still prominent, extent in California’s Democratic primary.
![]()
Table 5: Ad Volumes and Spending in Top Gubernatorial Races
| State | # Ads | Est. Cost (in Ms) | Dem Cand Ads | GOP Cand Ads | Dem Group Ads | GOP Group Ads | % Group |
|---|---|---|---|---|---|---|---|
| IL | 90,218 | 41.4 | 49,786 | 31,867 | 3,186 | 4,823 | 8.9% |
| CA | 47,014 | 34.4 | 25,654 | 1,129 | 20,231 | 0 | 43.% |
| VA | 87,841 | 33.8 | 46,702 | 34,630 | 2,609 | 3,891 | 7.4% |
| FL | 23,901 | 13.1 | 9,058 | 0 | 6,638 | 8,195 | 62.1% |
| NJ | 8,616 | 11.3 | 4,221 | 2,633 | 544 | 0 | 6.3% |
| OH | 24,220 | 8.4 | 3,322 | 19,103 | 0 | 1,785 | 7.4% |
| GA | 27,284 | 8.4 | 8,195 | 14,215 | 2,982 | 1,892 | 17.9% |
| PA | 19,859 | 7.5 | 2,846 | 15,354 | 1,659 | 0 | 8.4% |
| TN | 23,296 | 7.3 | 1,480 | 20,183 | 0 | 1,633 | 7.0% |
| NV | 13,186 | 6.7 | 8,998 | 186 | 3,278 | 724 | 30.4% |
| CO | 12,794 | 5.6 | 7,015 | 2,595 | 2,514 | 670 | 24.9% |
| SC | 19,709 | 5.3 | 1,461 | 13,806 | 0 | 4,442 | 22.5% |
| MI | 13,776 | 3.0 | 7,720 | 1,988 | 0 | 4,068 | 29.5% |
| ID | 28,404 | 2.8 | 7,631 | 18,244 | 0 | 2,529 | 8.9% |
| IA | 17,165 | 2.4 | 15,087 | 1,474 | 196 | 408 | 3.5% |
| AL | 15,805 | 2.4 | 0 | 15,805 | 0 | 0 | 0.0% |
| OK | 5,577 | 1.9 | 0 | 4,864 | 0 | 713 | 12.8% |
| SD | 8,510 | 1.2 | 0 | 8,255 | 0 | 255 | 3.0% |
| AZ | 1,935 | 1.0 | 0 | 0 | 329 | 0 | 17.0% |
| WI | 2,597 | 0.9 | 0 | 2,305 | 0 | 277 | 10.7% |
| Figures are from January 1, 2017 to June 4, 2018. Numbers include broadcast television. CITE SOURCE OF DATA AS: Kantar Media/CMAG with analysis by the Wesleyan Media Project. |
|||||||
Table 6 shows ad totals in the top House races. Among House primaries decided on either June 5 or 12, CA-49, NM-01, and VA-10 are in the top 10. Of these, NM-01 has featured 12 ad sponsors in the race for the Democratic nomination, six candidates and six outside groups. In CA-49, two Democratic candidates and two Republicans aired ads (12 candidates across both parties were on the ballot), with additional ads from six outside groups along with the Democratic Congressional Campaign Committee (which attacked Republican Rocky Chavez). Spending in these races, however, is still less than what was spent earlier this cycle in special elections in Georgia’s 6th congressional district, Pennsylvania’s 18th congressional district and in Montana’s at-large congressional district. Outside groups have aired roughly 70 percent of the advertising in Nebraska’s second district (where nearly 2,100 pro-Republican ads have aired) and Iowa’s first district, which has seen group ads on both sides.
![]()
Table 6: Ad Volumes and Spending in Top U.S. House Races
| District | # Ads | Est. Cost (in Ms) | Dem Cand Ads | GOP Cand Ads | Dem Group Ads | GOP Group Ads | % Group |
|---|---|---|---|---|---|---|---|
| GA-06 | 33,183 | 28.8 | 18,051 | 4,885 | 748 | 4,624 | 16.2% |
| PA-18 | 8,733 | 8.4 | 3,053 | 757 | 472 | 2,431 | 33.2% |
| MT-01 | 51,671 | 4.6 | 22,787 | 19,172 | 552 | 4,734 | 10.2% |
| CA-49 | 12,588 | 4.3 | 8,468 | 102 | 1,565 | 926 | 19.8% |
| MD-06 | 2,223 | 1.9 | 2,223 | 0 | 0 | 0 | 0.0% |
| PA-05 | 1,986 | 1.8 | 1,606 | 0 | 380 | 0 | 19.1% |
| SC-05 | 5,263 | 1.7 | 829 | 2,686 | 0 | 1,736 | 33.0% |
| AZ-08 | 2,568 | 1.6 | 1,406 | 0 | 64 | 0 | 2.5% |
| NM-01 | 8,166 | 1.4 | 4,641 | 0 | 3,525 | 0 | 43.2% |
| VA-10 | 1,034 | 1.3 | 631 | 0 | 161 | 242 | 39.0% |
| PA-01 | 994 | 1.2 | 994 | 0 | 0 | 0 | 0.0% |
| NE-02 | 2,928 | 1.1 | 829 | 0 | 8 | 2,091 | 71.7% |
| KY-06 | 4,745 | 1.1 | 4,487 | 258 | 0 | 0 | 0.0% |
| IL-03 | 1,614 | 1.0 | 1,214 | 0 | 400 | 0 | 24.8% |
| IA-01 | 5,553 | 1.0 | 1,680 | 0 | 2,729 | 1,144 | 69.7% |
| PA-13 | 4,163 | 1.0 | 0 | 3,477 | 0 | 686 | 16.5% |
| TX-23 | 2,212 | 0.9 | 1,513 | 0 | 145 | 554 | 31.6% |
| CA-48 | 1,057 | 0.9 | 114 | 135 | 195 | 0 | 18.4% |
| IA-03 | 3,251 | 0.8 | 1,963 | 0 | 1,288 | 0 | 39.6% |
| TX-16 | 3,417 | 0.7 | 2,642 | 19 | 618 | 138 | 22.1% |
| Figures are from January 1, 2017 to June 4, 2018. Numbers include broadcast television. CITE SOURCE OF DATA AS: Kantar Media/CMAG with analysis by the Wesleyan Media Project. |
|||||||
California Group Tops List of Group Spenders
Table 7 shows the top group advertisers in ads this cycle. The California Charter Schools Association tops the list in spending, with over $11 million in spending on behalf of Democratic candidate for governor Antonio Villaraigosa. Senate Majority PAC and Americans for Prosperity have each spent more than $5 million. As the Wesleyan Media Project reported in May, American Action Network has been active in over 30 House districts, primarily thanking Republicans for action on health care and tax reform.
![]()
Table 7: Top Group Advertisers in Federal and Gubernatorial Races
| Sponsor | # Ads | Est. Cost (in Ms) | Party Lean | Races |
|---|---|---|---|---|
| California Charter Schools Association Advocates | 15,502 | 11.5 | Dem | Gov-CA |
| Senate Majority PAC | 15,399 | 6.3 | Dem | Sen-FL, Sen-IN, Sen-MO, Sen-MT, Sen-ND, Sen-WI, Sen-WV |
| Americans for Prosperity | 15,325 | 5.5 | Rep | Gov-VA, Gov-WI, Sen-IN, Sen-MO, Sen-MT, Sen-ND, Sen-WI |
| Congressional Leadership Fund | 8,457 | 4.6 | Rep | House: GA-06, MT-01, PA-18 |
| American Action Network | 16,056 | 4.6 | Rep | House: CA-10, CA-21, CA-25, CA-49, CO-06, FL-18, FL-26, IA-01, IA-02, ID-01, IL-12, IL-13, IL-17, KS-03, ME-02, MN-01, MN-07, MN-08, NC-11, NE-02, NV-03, NY-21, NY-22, NY-23, NY-24, NY-27, OH-10, PA-16, PA-17, TX-23, VA-10, WI-01, WI-03 |
| Florida Grown PC | 4,615 | 3.8 | Rep | Gov-FL |
| State Solutions, Inc. | 4,823 | 3.7 | Rep | Gov-IL |
| U.S. Chamber of Commerce | 4,889 | 3.3 | Rep | Sen-AL, Sen-FL, Sen-MS, House: AL-02, GA-06, MT-01, NE-02, OH-16, TX-23, VA-10 |
| SEIU California State Council | 3,800 | 3.2 | Dem | Gov-CA |
| Frontier Fairness PAC | 2,272 | 2.5 | Dem | Gov-CO |
| Senate Leadership Fund | 9,903 | 2.5 | Rep | Sen-AL |
| Save My Care | 6,967 | 2.2 | Dem | Sen-AZ, Sen-NV, House: AK-01, AZ-02, CA-21, CA-49, ME-02, NJ-03, NV-02, OH-01, OH-12, OH-16 |
| All About Florida | 4,711 | 2.2 | Dem | Gov-FL |
| Club for Growth Action | 4,627 | 2.1 | Rep | Sen-MT, House: GA-06, ID-01, PA-13, SC-05, TX-21, TX-27, UT-03 |
| Restoration PAC | 5,578 | 1.9 | Rep | Sen-MT, Sen-WI, Sen-WV |
| Figures are from January 1, 2017 to June 4, 2018. Numbers include broadcast television. CITE SOURCE OF DATA AS: Kantar Media/CMAG with analysis by the Wesleyan Media Project. |
||||
Majority of Spending by Groups that Don’t Disclose
In partnership with the Center for Responsive Politics, the Wesleyan Media Project tracks the disclosure type of outside groups in federal races. We classify groups as full disclosure groups (meaning they disclose contributor lists to the Federal Election Commission), non-disclosure dark money groups (which are not required to disclose publicly their donors; these are most often 501c4 non-profits), and partial disclosure groups (those that disclose donors but also accept contributions from dark money sources).
Table 8 shows that only 19 percent of the ads aired in House races in this cycle—and 28 percent of the ads aired in Senate races this cycle—are from groups that fully disclose their donors. The majority of spending has come from groups, mostly 501c organizations, that do not report their donors.
For comparison, we also show disclosure types for outside group ads in congressional races in the 2014 and 2016 cycles. Overall, dark money advertising is up – both in total volume (99,353 airings so far in 2018 federal races compared to 79,088 in 2014, a 26 percent increase) and slightly up as a proportion of outside group airings (57% in 2018 compared to 55% in 2014).
Group ad totals in House races are much higher in 2018 than in the previous two elections, and a much larger percentage of those ads are from dark money sources. In 2014, just over half of the nearly 33,000 ads by outside groups were from groups that do not disclose donor lists publicly. Nearly 2 in 3 of the 70,000 airings this cycle are from dark money sources.
The rate of dark money in Senate races is not much changed from 2014 or 2016, but full disclosure groups account for a smaller share; spending by partially disclosing groups is higher in 2018.
![]()
“This report shows that absent meaningful oversight from the FEC or the IRS, groups that raise money from anonymous – possibly even foreign donors – will continue to spend heavily to influence who wields power in Washington,” said Sheila Krumholz, executive director of the Center for Responsive Politics.
![]()
Table 8: Outside Group Donor Disclosure
| 2018 | 2014 | 2016 | |||
|---|---|---|---|---|---|
| # Ads | Cost (in Ms) | % Ads | % Ads | % Ads | |
| House | |||||
| Full | 13,146 | 6.5 | 18.87% | 45.65% | 76.17% |
| Partial | 11,081 | 5.5 | 15.90% | 0.00% | 6.17% |
| None | 45,455 | 16.6 | 65.23% | 54.35% | 17.66% |
| Total | 69,682 | 32,399 | 7,584 | ||
| Senate | |||||
| Full | 29,456 | 9.8 | 28.14% | 41.31% | 40.85% |
| Partial | 21,341 | 8.1 | 20.38% | 3.43% | 11.19% |
| None | 53,898 | 18.0 | 51.48% | 55.26% | 47.95% |
| Total | 104,695 | 111,255 | 57,715 | ||
| Group classification by the Center for Responsive Politics. Figures are from January 1, 2017 to June 4, 2018. Totals for 2014 and 2016 are also through June 4 in each respective year. Numbers include broadcast television. CITE SOURCE OF DATA AS: Kantar Media/CMAG with analysis by the Wesleyan Media Project. |
|||||
Dems Talk Healthcare; Republicans Talk Trump
In the primary races decided June 5 (Table 9), pro-Democratic ads focused issue discussion on healthcare, opposition to Trump, veterans and education. By contrast, support for Trump was the top issue mention among pro-Republican ads, followed by immigration, the economy and tax reform.
![]()
“Republicans and Democrats are decidedly not talking about the same things in their advertising so far,” said Erika Franklin Fowler, co-director of the Wesleyan Media Project. “It will be interesting to see if that changes as we move into the general election phase of the campaign when candidates must compete more for the persuadable voter in the middle.”
![]()
Table 9: Top Issues Mentioned in Ads Aired in June 5 Primary Races
| Pro-Dem | Pro-Rep |
|---|---|
| Healthcare | Pro-Trump |
| Anti-Trump | Immigration |
| Veterans | Economy (Jobs/Taxes) |
| Education | Tax Reform |
| Medicare | Healthcare |
| Women's Rights | Corruption |
| Energy / Environment | Anti-ACA |
| Guns | Budget |
| Pro-ACA | Veterans |
| Economy (Jobs/Taxes) | Public Safety |
| Figures are from January 1, 2018 to June 4, 2018. Races include House and Senate races in states holding June 5 primaries (Alabama, California, Iowa, Mississippi, Montana, New Jersey, New Mexico and South Dakota). CITE SOURCE OF DATA AS: Kantar Media/CMAG with analysis by the Wesleyan Media Project. |
|
In the June 12 primary races, healthcare remains the top issue among Democrats, with ads from candidates in Virginia and Nevada in particular criticizing Republicans for supporting repeal and replace efforts and/or policies to reduce access to affordable health care (Table 10). Less common, but still prominent in over 1,100 pro-Democratic airings were attacks on Republican votes for the tax reform bill. Republican candidates in the June 12 primary states, on the other hand, are talking most about the economy, support for Trump and immigration issues. Republican candidates in the North Dakota Senate contest aired ads touting their support for the 2017 tax bill, calling it “bold tax reform” and/or suggesting that most North Dakotans will benefit, and they have attacked incumbent Senator Heidi Heitkamp for voting against the tax reform bill.
![]()
Table 10: Top Issues Mentioned in Ads Aired in June 12 Primary Races
| Pro-Dem | Pro-Rep |
|---|---|
| Healthcare | Economy (Taxes/Budget) |
| Economy (Budget) | Pro-Trump |
| Anti-Trump | Immigration |
| Energy / Environment | Tax Reform |
| Taxes | Corruption |
| Figures are from January 1, 2018 to June 4, 2018. Races include House and Senate races in states holding June 12 primaries (Maine, Nevada, North Dakota, South Carolina, and Virginia). Fewer issues are listed here compared to Table 9 because there were fewer ad airings in June 12 races compared to June 5 races. CITE SOURCE OF DATA AS: Kantar Media/CMAG with analysis by the Wesleyan Media Project. |
|
![]()
![]()
About This Report
Data reported here from Kantar/CMAG do not cover local cable buys, only broadcast television, national network and national cable buys. All cost estimates are precisely that: estimates.
The Wesleyan Media Project (WMP) provides real-time tracking and analysis of all political television advertising in an effort to increase transparency in elections. Housed in Wesleyan’s Quantitative Analysis Center – part of the Allbritton Center for the Study of Public Life – the Wesleyan Media Project is the successor to the Wisconsin Advertising Project, which disbanded in 2009. It is directed by Erika Franklin Fowler, associate professor of government at Wesleyan University, Michael M. Franz, professor of government at Bowdoin College and Travis N. Ridout, professor of political science at Washington State University. WMP staff include Laura Baum (Project Manager), Dolly Haddad (Project Coordinator) and Matthew Motta (Research Associate).
The Wesleyan Media Project is supported by Wesleyan University. Data are provided by Kantar Media/CMAG with analysis by the Wesleyan Media Project. WMP is partnering again this year with the Center for Responsive Politics, to provide added information on outside group disclosure.
Periodic releases of data will be posted on the project’s website and dispersed via Twitter @wesmediaproject. To be added to our email update list, click here.
For more information contact:
Lauren Rubenstein, lrubenstein@wesleyan.edu, (860) 685-3813
About Wesleyan University
Wesleyan University, in Middletown, Conn., is known for the excellence of its academic and co-curricular programs. With more than 2,900 undergraduates and 200 graduate students, Wesleyan is dedicated to providing a liberal arts education characterized by boldness, rigor and practical idealism. For more, visit wesleyan.edu.