Dems Hold Advantages in Air War in Senate and House;
GOP Airs More Ads in Gubernatorial Races
(MIDDLETOWN, CT) September 16, 2014 – In the past two weeks, advertising in federal and gubernatorial races has not only increased in volume compared to the same period in 2010, but is more negative as well. Democratic advertising has outpaced Republicans advertising over the past two weeks in House and Senate races, while Republicans hold an edge in gubernatorial races.
Table 1 shows that over 34,000 pro-Democratic ads aired between August 29 and September 11 in Senate races compared to just over 29,000 pro-Republican advertisements. Slightly over 30 percent of total ads were sponsored by interest groups, a percentage that was similar for both Republicans and Democrats. Advertising in Senate races over the two weeks ending on September 11 is quite intense. The 63,000 ad airings are over 13,000 more than the over 49,000 ads aired in Senate races during the same time period in 2010, a 27.5 percent increase.
The Democratic lead on the House side is even greater over the past two weeks, with pro-Democratic ads outnumbering pro-Republican ads by almost a 2 to 1 margin, 20,554 to 10,855. This finding stands in contrast to an earlier report from the Wesleyan Media Project that showed a substantial Republican ad advantage over the entire election cycle. (Those cycle-to-date numbers also included primary ads in the early part of the year.) This recent Democratic ad advantage in House races was led by Democratic candidates, who sponsored 70 percent of pro-Democratic airings over the past two weeks.
“Clearly, Democrats are starting to reverse the early Republican lead in the ad war,” said Travis Ridout, co-director of the Wesleyan Media Project. “Forecasts of House races suggest that the Republicans will keep control of the chamber, but Democrats are working hard to hold on to–or tip—every competitive seat,” he added.
In the various races for governor, however, Republicans held an ad advantage over the past two weeks. There were about 5,000 more pro-Republican than pro-Democratic ads. Outside groups (including the Republican and Democratic Governors associations) have both aired upwards of 8,000 airings, but groups make up a slightly larger proportion of the pro-Democratic airings (nearly 26 percent compared to nearly 22 percent) while party sponsored airings are slightly higher proportion on the Republican side (22 percent compared to nearly 18 percent for the Democrats).
Table 1: Ad Totals First Two Weeks of Traditional Campaign by Race Type and Sponsorship
| 2010 Midterms | ||||||
|---|---|---|---|---|---|---|
| Pro-Democratic Advertising | ||||||
| Cand. | Party | Coord. | Group | Total | ||
| Governor | 17,075 | 7,099 | 2,823 | 0 | 26,997 | |
| US House | 19,907 | 0 | 1,708 | 15 | 21,630 | |
| US Senate | 14,066 | 2,931 | 879 | 0 | 17,876 | |
| Pro-Republican Advertising | ||||||
| Cand. | Party | Coord. | Group | Total | ||
| Governor | 25,608 | 3,397 | 3,854 | 0 | 32,859 | |
| US House | 9,484 | 92 | 1,414 | 0 | 10,990 | |
| US Senate | 21,572 | 0 | 9,617 | 552 | 31,741 | |
| 2014 Midterms | ||||||
| Pro-Democratic Advertising | ||||||
| Cand. | Party | Coord. | Group | Total | % Change | |
| Governor | 19,242 | 6,035 | 0 | 8,865 | 34,142 | 26.5% |
| US House | 14,387 | 4,644 | 0 | 1,523 | 20,554 | -5% |
| US Senate | 15,842 | 7,575 | 350 | 10,405 | 34,172 | 91.2% |
| Pro-Republican Advertising | ||||||
| Cand. | Party | Coord. | Group | Total | % Change | |
| Governor | 21,819 | 8,406 | 0 | 8,344 | 38,569 | 17.4% |
| US House | 4,496 | 3,628 | 450 | 2,281 | 10,855 | -1.2% |
| US Senate | 11,692 | 2,264 | 5,635 | 9,479 | 29,070 | -8.4% |
| Totals are from August 29, 2010 to September 11, 2010 and August 29, 2014, to September 11, 2014. Numbers include broadcast television. CITE SOURCE OF DATA AS: Kantar Media/CMAG with analysis by the Wesleyan Media Project. |
||||||
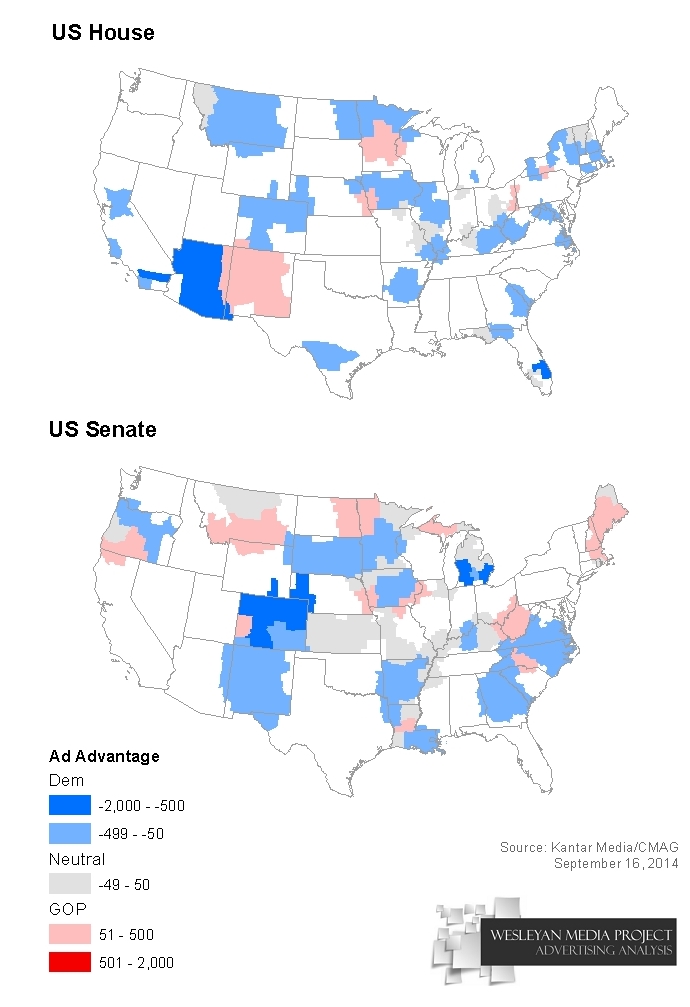
Figure 1 depicts which party held the ad advantage in each media market over the past two weeks, with separate maps for House and Senate advertising. Blue, which indicates a Democratic ad advantage, is much more common than red, which indicates a Republican ad advantage.
Figure 1: Advertising Balance in US House and US Senate Races (Aug 29, 2014 – Sept 11)
Download Figure 1 data (.xlsx)
Negative Ads More Common than 2012 Cycle and 2010 Midterms
Much of the advertising over the past two weeks has been negative, and that has been especially true in races for the U.S. Senate (Table 2). Fifty-five percent of the ad airings in Senate races were negative, and another 17.5 percent were contrast ads; that is, they mentioned both a sponsor and an opponent. Only 27.5 percent of ad airings were positive ads, those that focused solely on a favored candidate. Gubernatorial and House ads were both over 40 percent negative, and negativity totals for all three races are up in comparison to the same time period in the 2012 elections and in 2010, the previous midterm cycle. In 2012, 23 percent of gubernatorial ads were negative as were 32 percent of House ads and 44 percent of Senate ads. In 2010, 34 percent of gubernatorial ads were negative, as were nearly 27 percent of House ads and 44 percent of Senate ads.
“So far the 2014 midterms are seeing increased volume and increased negativity over 2010, which is going to make citizens even less happy with the tone of the airwaves,” said Michael Franz, co-director of the Wesleyan Media Project. “Evidence from political science suggests, however, that citizens may be more informed as a result of the negativity.”
Table 2: Tone of Advertising over Time by Race Type
| Negative | Contrast | Positive | ||
|---|---|---|---|---|
| 2010 | Governor | 33.7% | 13.7% | 52.7% |
| US House | 27.6% | 20.4% | 52% | |
| US Senate | 43.7% | 13.2% | 43.1% | |
| 2012 | Governor | 23.3% | 14.9% | 61.8% |
| US House | 32.3% | 17.2% | 50.5% | |
| US Senate | 44.1% | 22.4% | 33.5% | |
| 2014 | Governor | 43.8% | 15.1% | 41.1% |
| US House | 41.4% | 11% | 47.6% | |
| US Senate | 55% | 17.5% | 27.5% | |
| Percentages are from August 29 to September 11 from all three cycles. Totals in 2014 are based on ongoing Wesleyan Media Project coding and 2010 and 2012 totals are from prior Wesleyan Media Project coding of Kantar Media/CMAG ad airings. |
||||
Table 3 shows that candidates in U.S. Senate battles this year are taking different negative strategies, with Democrats far more likely to air pure attack ads (42 percent) and Republicans airing more contrast spots (42 percent). Group-sponsored and party airings continue to be the attack dogs for both parties, though group-sponsored airings have been even more negative on the Democratic side of the aisle. In the House, candidate-sponsored airings have been overwhelmingly positive from both sides (71 percent for Democrats and 78 percent for Republicans), but parties and interest groups have been overwhelmingly negative. Overall, over half of pro-Republican airings (52 percent) were negative while only slightly over a third of pro-Democratic airings (36 percent) were negative thanks, in large part, to the abundance of positive Democratic candidate airings.
Table 3: Tone of Advertising by Party and Race Type
| Pro-Democrat | Pro-Republican | ||||||
|---|---|---|---|---|---|---|---|
| Negative | Contrast | Positive | Negative | Contrast | Positive | ||
| House | Candidate | 11.6% | 17% | 71.4% | 14.2% | 8.3% | 77.6% |
| Coord. | 0% | 0% | 100% | ||||
| Group | 82% | 0.6% | 17.4% | 75.7% | 21.7% | 2.5% | |
| Party | 96% | 0% | 4% | 90.1% | 3.4% | 6.5% | |
| Total | 35.9% | 11.9% | 52.2% | 51.9% | 9.1% | 39% | |
| Senate | Candidate | 41.9% | 12% | 46.1% | 12.3% | 41.3% | 46.5% |
| Coord. | 100% | 0% | 0% | 5.9% | 64.1% | 30% | |
| Group | 91.4% | 4.6% | 4% | 77.9% | 5.3% | 16.8% | |
| Party | 100% | 0% | 0% | 100% | 0% | 0% | |
| Total | 70.5% | 6.9% | 22.6% | 39.3% | 30.7% | 30% | |
| Percentages are from August 29, 2014, to September 11, 2014. Numbers include broadcast television. Totals in 2014 are based on ongoing Wesleyan Media Project coding of Kantar Media/CMAG ad airings. CITE SOURCE OF DATA AS: Kantar Media/CMAG with analysis by the Wesleyan Media Project. |
|||||||
More Democratic Ads in 9 of 10 Top Senate Races and All Top House Races
Table 4 shows the top 10 U.S. Senate races, ranked by the total volume of advertising over the past two weeks. In many of the races, the Democratic candidate holds a small ad advantage, with larger Democratic advantages in Michigan, Colorado, Arkansas and Georgia. The one state in the top ten in which pro-Republican ads outnumber pro-Democratic ads is Alaska. The table also shows the percentage of ads in each race that are group-sponsored, along with the percentage of pro-Democratic and pro-Republican ads that were sponsored by groups. Group-sponsored ads as a percentage of total ads are high in many of these races. For instance, in Michigan, 58 percent of the total airings in the past two weeks were sponsored by groups, and fully 73 percent of the pro-Democratic ads were group-sponsored.
Table 4: Ad Volume in Top Senate Races
| State | Total Ads | Pro-Dem Ads | Pro-Rep Ads | % Group | Pro-Dem % Group | Pro-Rep % Group |
|---|---|---|---|---|---|---|
| Kentucky | 7,736 | 4,119 | 3,617 | 29.9% | 46.3% | 11.3% |
| N. Carolina | 7,513 | 4,228 | 3,285 | 35.2% | 27.3% | 45.5% |
| Michigan | 7,203 | 4,349 | 2,854 | 58.3% | 73.1% | 35.7% |
| Iowa | 6,669 | 3,353 | 3,316 | 34.6% | 21.5% | 47.9% |
| Louisiana | 6,071 | 3,455 | 2,616 | 10.2% | 7.3% | 14% |
| Alaska | 4,167 | 2,014 | 2,153 | 40.2% | 34.7% | 45.3% |
| Colorado | 4,012 | 2,336 | 1,676 | 27.3% | 9.2% | 52.6% |
| Arkansas | 3,991 | 2,218 | 1,773 | 35.1% | 24.4% | 48.4% |
| Georgia | 2,798 | 1,915 | 883 | 29% | 24.4% | 39.1% |
| Virginia | 2,351 | 1,439 | 912 | 38.3% | 62.6% | 0% |
| Figures are from August 29, 2014, to September 11, 2014. Numbers include broadcast television. CITE SOURCE OF DATA AS: Kantar Media/CMAG with analysis by the Wesleyan Media Project. |
||||||
The top U.S. House races, ranked by total ads aired over the past two weeks, are shown in Table 5. In all ten of these competitive races, the Democratic campaign holds an ad advantage. The race with the most advertising was the contest for Georgia’s 12th congressional seat, which saw 3,300 ads in the past two weeks. Arizona-02 and West Virginia-03 both saw more than 2,000 ads in the past two weeks. Many of the most competitive House races saw little interest group activity, but there are some exceptions, including Arizona-02, Florida-02 and California-07.
Table 5: Ad Volume in Top House Races
| District | Total Ads | Pro-Dem Ads | Pro-Rep Ads | % Group | Pro-Dem % Group | Pro-Rep % Group |
|---|---|---|---|---|---|---|
| Georgia-12 | 3,300 | 2,032 | 1,268 | 0% | 0% | 0% |
| Arizona-02 | 2,848 | 1,952 | 896 | 32.9% | 36.7% | 24.7% |
| WV-03 | 2,597 | 1,590 | 1,007 | 7.4% | 0% | 19.1% |
| Florida-02 | 1,697 | 1,021 | 676 | 31.4% | 52.2% | 0% |
| Arizona-01 | 1,682 | 999 | 683 | 0% | 0% | 0% |
| Iowa-03 | 1,273 | 786 | 487 | 0% | 0% | 0% |
| Montana-01 | 1,142 | 843 | 299 | 0% | 0% | 0% |
| Illinois-12 | 1,140 | 680 | 460 | 16% | 0% | 39.6% |
| Illinois-17 | 921 | 681 | 240 | 0% | 0% | 0% |
| Calif.-07 | 894 | 499 | 395 | 44.2% | 0% | 100% |
| Figures are from August 29, 2014, to September 11, 2014. Numbers include broadcast television. CITE SOURCE OF DATA AS: Kantar Media/CMAG with analysis by the Wesleyan Media Project. |
||||||
Democratic ad advantages in the Senate and House, however, do not carry over to gubernatorial races, as Table 6 shows. In the past two weeks, pro-Republican ads have outnumbered pro-Democratic ads in Florida, Texas, Michigan, Kansas and Arizona, while Democratic ads have been more common in Illinois, Wisconsin, Pennsylvania, Maine and Rhode Island. Interest groups are most heavily involved in the races in Kansas, Maine and Wisconsin.
Table 6: Ad Volume in Top Gubernatorial Races
| State | Total Ads | Pro-Dem Ads | Pro-Rep Ads |
|---|---|---|---|
| Florida | 14,237 | 5,831 | 8,406 |
| Texas | 8,380 | 2,997 | 5,383 |
| Illinois | 5,473 | 2,899 | 2,574 |
| Michigan | 5,331 | 2,125 | 3,206 |
| Wisconsin | 4,663 | 2,674 | 1,989 |
| Kansas | 3,548 | 1,524 | 2,024 |
| Penn. | 3,489 | 1,805 | 1,684 |
| Arizona | 2,593 | 653 | 1,940 |
| Maine | 1,929 | 1,434 | 495 |
| RI | 2,217 | 1,938 | 279 |
| S. Carolina | 2,178 | 1,081 | 839 |
| New York | 1,888 | 1,888 | 0 |
| Connecticut | 1,884 | 1,305 | 579 |
| Alabama | 1,845 | 454 | 1,391 |
| Arkansas | 1,796 | 971 | 825 |
| Figures are from August 29, 2014, to September 11, 2014. Numbers include broadcast television. CITE SOURCE OF DATA AS: Kantar Media/CMAG with analysis by the Wesleyan Media Project. |
|||
Table 7 reveals that Denver television stations aired the most ads over the past two weeks, some 5,600. Denver is followed by stations in Grand Rapids, Michigan, Boston and Providence. Over the entire 2013-14 election cycle, the most ads aired in New York City, almost 42,000. Next on the full cycle-to-date list are Denver, Little Rock, Washington, D.C., and Norfolk-Portsmouth, Virginia.
Table 7: Total Ad Volume in Top Media Markets
| Market | Airings |
|---|---|
| Denver | 5,632 |
| Grand Rapids-Kalamazoo | 4,650 |
| Boston | 4,320 |
| Providence | 4,312 |
| Little Rock | 4,070 |
| Phoenix | 3,928 |
| Tucson | 3,922 |
| Des Moines | 3,568 |
| Tampa-St. Petersburg | 3,384 |
| Charleston-Huntington | 3,310 |
| Figures are from August 29, 2014, to September 11, 2014. Numbers include broadcast television. CITE SOURCE OF DATA AS: Kantar Media/CMAG with analysis by the Wesleyan Media Project. |
|
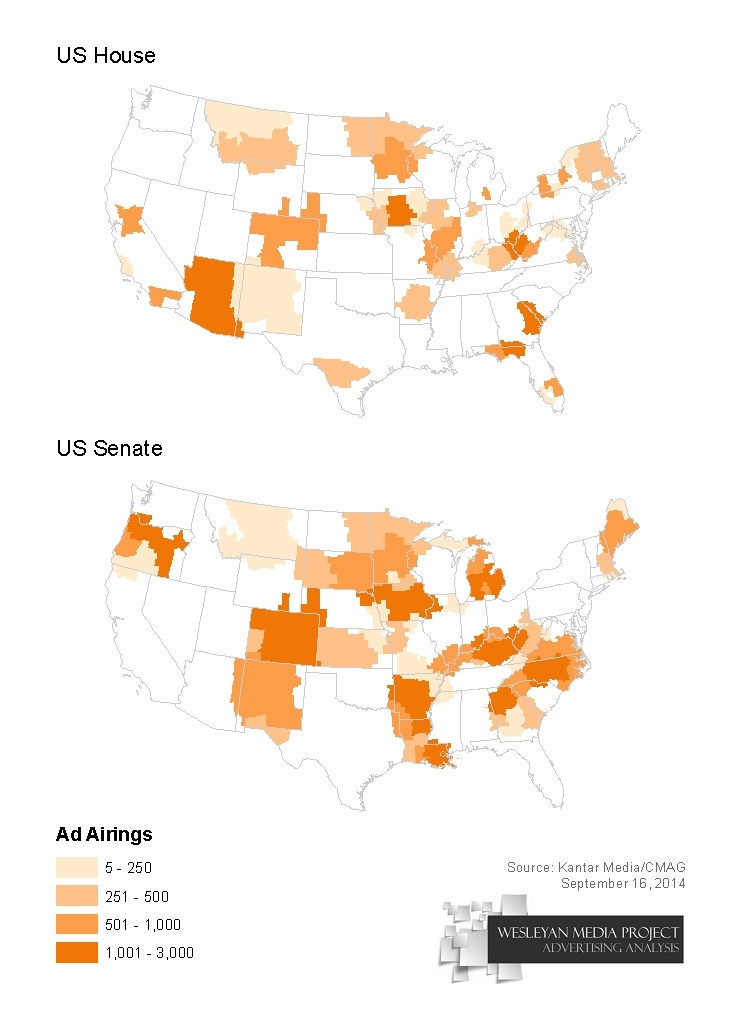
Figure 2 shows how the volume of House and Senate advertising has varied considerably by media market over the past two weeks, with intense pockets of activity in Colorado, Iowa and Kentucky.
![]()
Figure 2: Volume of Ad Airings In House and Senate Races by Media Market (Aug 29, 2014 – Sept 11)
Download Figure 2 data (.xlsx)
Republican Governors Association Top Group Advertiser
The top group advertiser in the past two weeks was the Republican Governors’ Association, which aired almost 6,400 ads (Table 8). The ads were aired in eight different gubernatorial races. NextGen Climate Action Committee, which wants to make the issue of climate change central to campaign discourse, aired almost 4,000 ads in the past two weeks in the Florida gubernatorial race and four U.S. Senate races.
Table 8: Top Group Sponsors Over Past Two Weeks
| Sponsor | Type/Disclose? | # Ads | Races |
|---|---|---|---|
| Republican Governors Association | 527/yes | 6,378 | AR, AZ, CO, KS, ME, MI, NE, OH Governor |
| NextGen Climate Action Committee | Super PAC/yes | 3,975 | FL Governor, CO, IA, MI, NH Senate |
| Crossroads Grassroots Policy Strategies | 501c4/no | 2,599 | CA07, CA52, IL12, AK, AR, CO, MI, NC Senate |
| Senate Majority PAC | Super PAC/yes | 2,159 | AR, KY, LA, MI, NC Senate |
| U.S. Chamber Of Commerce | 501c6/no | 1,976 | AZ02, CA07, CO06, MN08, WV03, CO, NC, NH Senate |
| Democratic Governors Association | 527/yes | 1,828 | MD, MI Governor |
| Americans For Prosperity | 501c4/no | 1,298 | AK, AR, CO, LA Senate |
| Greater Wisconsin Committee | 501c4/no | 1,235 | WI Governor |
| Freedom Partners Action Fund | Super PAC/ partial | 1,118 | NH02, AR, IA, OR Senate |
| NEA Advocacy Fund | Super PAC/yes | 1,004 | AK, NC Senate |
| Vote Vets Action Fund | 501c4/no | 921 | MA06, AK, KY Senate |
| Virginia Progress PAC | Super PAC/yes | 901 | VA Senate |
| Concerned Veterans For America | 501c4/no | 866 | IA, NC Senate |
| Kansas Values Institute | 501c4/no | 859 | KS Governor |
| Alliance For Freedom | 501c4/no | 842 | KS Governor |
| Figures are from August 29, 2014, to September 11, 2014. Numbers include broadcast television. CITE SOURCE OF DATA AS: Kantar Media/CMAG with analysis by the Wesleyan Media Project. Disclosure information from the Center for Responsive Politics. |
|||
A Wesleyan Media Project analysis, in partnership with the Center for Responsive Politics, speaks to the extent to which those groups advertising disclosed their donors (Table 9). In gubernatorial races, fully 80 percent of ad airings over the past two weeks were sponsored by groups that fully disclose their donors, while fewer than half of airings in Senate races were sponsored by groups that fully disclose. In House races, full disclosure was even rarer, at only 27 percent. Over 60 percent of ad airings in House races were from dark money groups that do not disclose their donors. Overall, across House, Senate and gubernatorial races, 35 percent of ad airings were sponsored by groups that did not disclose.
Table 9: Donor Disclosure by Race Type
| Full | Partial | None | Total | |
|---|---|---|---|---|
| Governor | 80.6% | 0% | 19.4% | 17,209 |
| House | 27.3% | 12.2% | 60.5% | 3,804 |
| Senate | 48.3% | 9.7% | 42% | 19,884 |
| Combined | 59.9% | 5.8% | 34.3% | 40,897 |
| Figures are from August 29, 2014, to September 11, 2014. Numbers include broadcast television. CITE SOURCE OF DATA AS: Kantar Media/CMAG with analysis by the Wesleyan Media Project. Disclosure information from the Center for Responsive Politics. |
||||
The extent to which interest groups have dominated advertising varies from one media market to the next, as Figure 3 shows.
![]()
Figure 3: Percentage of Total Senate and House Ad Airings Sponsored by Groups (Aug. 29, 2014 – Sept 11) 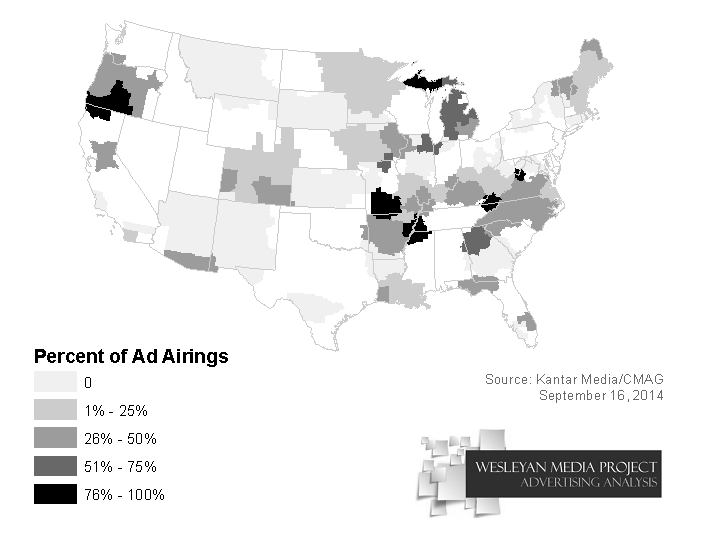
Download Figure 3 data (.xlsx)
Affordable Care Act Attacks a Consistent Focus, Increasing in Number
In the last six weeks, 37,544 ads criticizing the Affordable Care Act have aired, which is only 1,620 fewer political attacks than aired during the entire six-month enrollment period in which a grand total of 39,069 attacks aired (Figure 4). Furthermore, references to the health care law (including both attacks and oblique positive references) have increased in number along with the increase in campaign ads generally, staying at a steady 16-17 percent of all campaign ads over the last six weeks.
“It may not be the overwhelming campaign issue many predicted, but attacks on the Affordable Care Act are not going away. In fact they are increasing in volume as we head into the upcoming enrollment period,” said Erika Franklin Fowler, co-director of the Wesleyan Media Project. “How those attacks collide and interact with marketing ads will be interesting to watch with potentially important consequences for citizen attitudes, information and behavior.”
![]()
Figure 4: Volume of Ads Mentioning Affordable Care Act 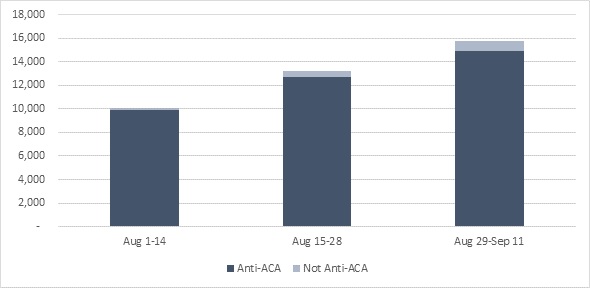
![]()
CITE SOURCE OF DATA AS: Kantar Media/CMAG with analysis by the Wesleyan Media Project. Data include airings from 8/1-9/11/2014
[spacer]
About This Report
Data reported here do not cover local cable buys, only broadcast television and national cable buys. All cost estimates are precisely that: estimates. Content information is based on ongoing Wesleyan Media Project coding and analysis of Kantar Media/CMAG video. Disclosure categorization information on interest groups comes from the Center for Responsive Politics.
The Wesleyan Media Project provides real-time tracking and analysis of all political television advertising in an effort to increase transparency in elections. Housed in Wesleyan’s Quantitative Analysis Center – part of the Allbritton Center for the Study of Public Life – the Wesleyan Media Project is the successor to the Wisconsin Advertising Project, which disbanded in 2009. It is directed by Erika Franklin Fowler, assistant professor of government at Wesleyan University, Michael M. Franz, associate professor of government at Bowdoin College and Travis N. Ridout, associate professor of political science at Washington State University. Laura Baum is the Project Manager. The Wesleyan Media Project is supported by grants from The John S. and James L. Knight Foundation, the MacArthur Foundation and Wesleyan University. Data provided by Kantar Media/CMAG with analysis by the Wesleyan Media Project using Academiclip, a web-based coding tool. The Wesleyan Media Project is partnering in 2014 with both the Center for Responsive Politics, to provide added information on interest group disclosure, and Ace Metrix, to assess ad effectiveness.
The Center for Responsive Politics is the nation’s premier research group tracking money in U.S. politics and its effect on elections and public policy. Nonpartisan, independent and nonprofit, the organization aims to create a more educated voter, an involved citizenry and a more transparent and responsive government. CRP’s award-winning website, OpenSecrets.org, is the most comprehensive resource available anywhere for federal campaign contribution and lobbying data and analysis.
Periodic releases of data will be posted on the project’s website and dispersed via Twitter @wesmediaproject. To be added to our email update list, click here.
For more information contact:
Lauren Rubenstein, lrubenstein@wesleyan.edu, (860) 685-3813
![]()
About Wesleyan University
Wesleyan University, in Middletown, Conn., is known for the excellence of its academic and co-curricular programs. With more than 2,900 undergraduates and 200 graduate students, Wesleyan is dedicated to providing a liberal arts education characterized by boldness, rigor and practical idealism. For more, visit www.wesleyan.edu.
About the John S. and James L. Knight Foundation
Knight Foundation supports transformational ideas that promote quality journalism, advance media innovation, engage communities and foster the arts. We believe that democracy thrives when people and communities are informed and engaged. For more, visit www.knightfoundation.org.
About the MacArthur Foundation
The MacArthur Foundation supports creative people and effective institutions committed to building a more just, verdant, and peaceful world. In addition to selecting the MacArthur Fellows, the Foundation works to defend human rights, advance global conservation and security, make cities better places, and understand how technology is affecting children and society. More information is at www.macfound.org.