Photo Gage Skidmore/flickr
Pro-Republican Outside Groups Airing More Ads than Republican Candidates
(MIDDLETOWN, CT) November 3, 2022 – An estimated $2.71 billion has been spent in federal and gubernatorial races on broadcast television advertising this election cycle, according to a new analysis by the Wesleyan Media Project. That represents 4.3 million ad airings so far cycle-to-date (between January 6, 2021, and October 30, 2022), an increase of 10 percent over the same period in the 2018 midterms. Nearly a third (29.9 percent) of all pro-Democratic and pro-Republican ads were sponsored by groups. These totals include any ads aired in congressional and gubernatorial elections in 2021 and 2022, including the off-year gubernatorial campaigns in 2021 (Virginia and New Jersey) and the recall election campaign in California in 2021.
Outside group activity in federal races has been especially high on the Republican side, with 42 percent of all airings in U.S. House races and 48 percent of airings in U.S. Senate contests being sponsored by groups (Table 1). These ad campaigns from pro-Republican outside groups in congressional races total nearly $600 million in spending. Notably, there have been more pro-Republican U.S. Senate airings sponsored by groups than by the Republican candidates themselves (nearly 350,000 to just under 300,000).
“In ad dollars, outside groups account for 45 percent of the total spending so far in this election cycle,” said Erika Franklin Fowler, co-director of the Wesleyan Media Project. “They have sponsored about 30 percent of the ads. Because groups typically pay more for television ad time than candidates, their heavy presence on television drives up the final cost of the campaign.”
Outside groups are also far more active than the party committees, even when including candidate/coordinated efforts with party independent spending. Parties have sponsored or jointly sponsored about 14 percent of pro-Democratic ads in House races, compared to over 26 percent for Democrats from outside groups. And they have sponsored or jointly sponsored only 5 percent of pro-Democratic ads in Senate races, compared to over 30 percent from pro-Democratic outside groups.
Table 1: Ad Airings and Spending by Party, Race and Sponsorship (Full Cycle)
| Candidates | Group | Coordinated and Party | Total | ||
|---|---|---|---|---|---|
| Governor | |||||
| Pro-Dem | Airings | 481,071 | 203,146 | 78,514 | 762,731 |
| Est. cost (in $Ms) | 244.14 | 156.19 | 39.42 | 439.76 | |
| % airings | 63.1% | 26.6% | 10.3% | ||
| Pro-Rep | Airings | 636,800 | 105,396 | 146,878 | 889,074 |
| Est. cost (in $Ms) | 231.83 | 107.17 | 92.87 | 431.88 | |
| % airings | 71.6% | 11.9% | 16.5% | ||
| U.S. House | Candidates | Group | Coordinated and Party | Total | |
| Pro-Dem | Airings | 380,274 | 167,251 | 86,973 | 634,498 |
| Est. cost (in $Ms) | 161.81 | 170.51 | 76.10 | 408.41 | |
| % airings | 59.9% | 26.4% | 13.7% | ||
| Pro-Rep | Airings | 251,626 | 234,716 | 77,927 | 564,269 |
| Est. cost (in $Ms) | 89.28 | 219.96 | 70.35 | 379.59 | |
| % airings | 44.6% | 41.6% | 13.8% | ||
| U.S. Senate | Candidates | Group | Coordinated and Party | Total | |
| Pro-Dem | Airings | 435,735 | 215,425 | 34,017 | 685,177 |
| Est. cost (in $Ms) | 237.95 | 231.30 | 34.98 | 504.23 | |
| % airings | 63.6% | 31.4% | 5.0% | ||
| Pro-Rep | Airings | 296,297 | 348,166 | 87,677 | 732,140 |
| Est. cost (in $Ms) | 142.98 | 346.30 | 57.51 | 546.73 | |
| % airings | 40.5% | 47.6% | 12.0% | ||
| Figures are from January 6, 2021 to October 30, 2022. Numbers include broadcast television for all sponsors. In governor races, coordinated spending includes candidate/party and candidate/group jointly-sponsored ads. Spending from independent candidates is excluded. CITE SOURCE OF DATA AS: Kantar Media/CMAG with analysis by the Wesleyan Media Project. |
|||||
Volume of Ads High but Not Record-Breaking
While spending is up 10 percent overall compared to 2018, the volume of broadcast television ads does not break historical records in all cases. These comparisons are shown in Figure 1 (for congressional races) and Figure 2 (for gubernatorial races).
In House races, ad volumes cycle-to-date are up 4.5 percent over 2018 but down 7 percent from 2020. In Senate races, volumes are up 19 percent over 2018 and down 35 percent from 2020, but they are also up 81 percent over 2016, when the same seats were in play. In general, though, ad volumes in congressional races since (and including) 2018 are higher than in the three previous elections in 2012, 2014, and 2016.
Figure 1: Volume of Ad Airings by Year (U.S. House and U.S. Senate)
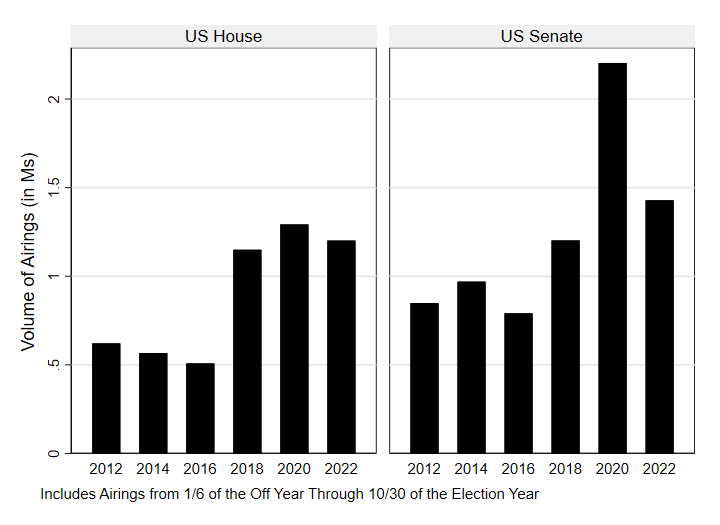
Figures are from January 6, 2021, to October 30, 2022.
Numbers include broadcast television for all sponsors.
CITE SOURCE OF DATA AS: Kantar/CMAG with analysis by the Wesleyan Media Project.
Ad volumes in gubernatorial races are breaking historical records, with cycle-to-date airing totals up 8 percent over 2018 and well above totals from 2014.
Figure 2: Volume of Ad Airings by Year (Governor Races)
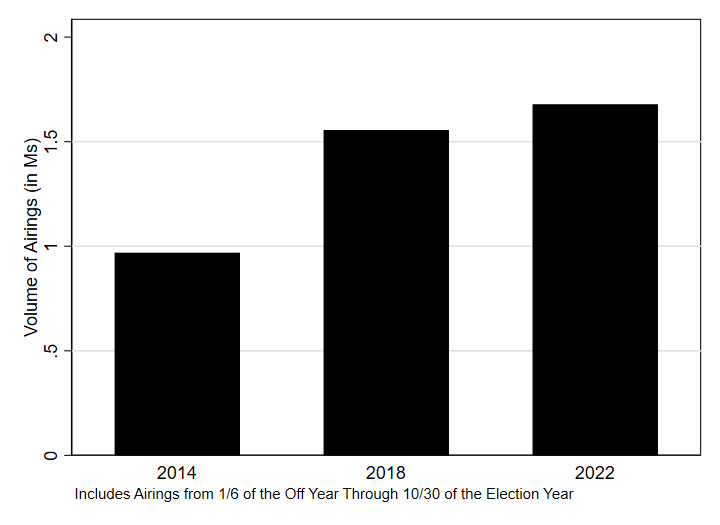
Figures are from January 6, 2021, to October 30, 2022.
Numbers include broadcast television for all sponsors.
CITE SOURCE OF DATA AS: Kantar/CMAG with analysis by the Wesleyan Media Project.
Phoenix and Las Vegas are Top Markets in the 2022 Cycle
Table 2 shows the top markets in the full cycle (to October 30) for airings in congressional and gubernatorial elections. Phoenix tops the list with over 145,000 spots; over 100,000 of those are from the Senate race in the state. In Las Vegas, half of the 120,000 spots are from the Senate campaign there, with the remaining number split between House races and the campaign for governor.
Six other markets have seen over 70,000 spots in the cycle, including both Milwaukee and Green Bay in Wisconsin. Tucson adds to the list of ads for Arizona media markets, with 73,000 airings cycle to-date.
Table 2: Top Media Markets by Airings (Full Cycle)
| Media Market | Federal and Gov Airings | U.S. Senate Airings | U.S. House Airings | Governor Airings | Percent Change from 2017-2018 |
|---|---|---|---|---|---|
| Phoenix | 145,840 | 100,369 | 14,167 | 31,304 | 143% |
| Las Vegas | 120,578 | 64,142 | 26,805 | 29,631 | 56% |
| Milwaukee | 96,273 | 49,501 | 776 | 45,996 | 113% |
| Atlanta | 88,554 | 43,360 | 11,562 | 33,632 | 44% |
| Portland, OR | 83,749 | 2,337 | 43,549 | 37,863 | 161% |
| Philadelphia | 75,427 | 39,840 | 16,182 | 19,405 | 68% |
| Tucson | 73,631 | 44,104 | 12,886 | 16,641 | 30% |
| Green Bay | 72,210 | 43,384 | 166 | 28,660 | 75% |
| Chicago | 69,204 | 1,198 | 13,782 | 54,224 | 6% |
| Reno | 63,340 | 36,847 | 2,628 | 23,865 | 26% |
| Albuquerque | 63,252 | 126 | 21,928 | 41,198 | 40% |
| Cleveland | 60,439 | 31,927 | 18,367 | 10,145 | 112% |
| Washington DC | 59,590 | 1,519 | 22,302 | 35,769 | 47% |
| Pittsburgh | 56,229 | 27,494 | 11,220 | 17,515 | 97% |
| Wilkes Barre | 54,980 | 25,064 | 18,795 | 11,121 | 106% |
| Harrisburg | 52,162 | 35,035 | 900 | 16,227 | 192% |
| Hartford | 50,089 | 10,738 | 12,041 | 27,310 | 106% |
| Savannah | 48,981 | 23,201 | 3,079 | 22,701 | 227% |
| Cincinnati | 48,930 | 31,751 | 10,196 | 6,983 | 50% |
| Kansas City | 48,653 | 14,328 | 20,238 | 14,087 | -17% |
| Fresno | 47,782 | 357 | 37,689 | 9,736 | 69% |
| La Crosse | 45,682 | 24,716 | 6,078 | 14,888 | 67% |
| Raleigh | 45,128 | 19,745 | 25,383 | 0 | 514% |
| Norfolk | 45,032 | 16 | 25,419 | 19,597 | -1% |
| Boston | 44,127 | 29,545 | 9,053 | 5,529 | 296% |
| Figures are from January 6, 2021, to October 30, 2022 (and percentage change is calculated over the same period, January 6, 2017, to October 30, 2018). Numbers include broadcast television for all sponsors. CITE SOURCE OF DATA AS: Kantar Media/CMAG with analysis by the Wesleyan Media Project. |
|||||
GA, PA, and WI Lead in Senate Ad Volumes; Democrats Out-Airing Republicans in 9 of Top 10 Races
Over 60,000 spots have aired on broadcast television stations in three Senate races—Georgia, Pennsylvania, and Wisconsin—in the period between September 5 and October 30. The Wesleyan Media Project refers to this period in this release as the Fall General Election, even though primaries in many states were held in the weeks and months prior to September 5.
In all three states, Democrats heavily out-advertised Republicans, by over 11,500 ads in Georgia and by over 10,000 ads in Pennsylvania. In 9 of the top 10 states by ad volume, Democrats had more ads on the air than Republicans in the general election period since September 5. This includes a 22,000 spot advantage in Arizona, where Mark Kelly and his allies have sponsored over 32,000 spots in comparison to his opponent, Blake Masters, with just 10,000 spots advocating for his campaign. The one exception to the rule is Florida, where Republican Marco Rubio has out-aired his Democratic challenger, Val Demings, by 4,300 spots.
Outside group efforts are vigorous in these top states, with groups sponsoring about half of all ads in Pennsylvania, Wisconsin, North Carolina, and New Hampshire. Groups account for at least 1 in 3 ads in four other states in the top ten. Pro-Republican groups are also more active than pro-Democratic groups. As Table 3 shows, the percentage of pro-Republican ads sponsored by outside groups exceeds 50 percent in the top eight states by ad volume in the fall general election period. Generally, then, outside groups are keeping Republican candidates competitive in the air war, even though Democrats are still heavily out-advertising them in most states with competitive races.
“If Republicans win control of the Senate, the air cover offered by Republican groups will be part of the reason,” said Michael Franz, co-director of the Wesleyan Media Project. “Republicans would otherwise be pressed to do much more fund-raising to bankroll more aggressive television ad campaigns if it were not for the spots from supportive outside groups.”
Table 3: Senate Airings by State (Fall General Election)
| State | Airings | Pro-Dem Airings | Pro-Rep Airings | Pro-Dem Advantage | % Group Airings | % Pro-Dem Group Airings | % Pro-Rep Group Airings |
|---|---|---|---|---|---|---|---|
| GA | 65,871 | 38,729 | 27,142 | 11,587 | 37.4% | 27.1% | 52.0% |
| PA | 63,868 | 37,055 | 26,813 | 10,242 | 49.1% | 45.4% | 54.2% |
| WI | 63,280 | 35,380 | 27,900 | 7,480 | 47.3% | 39.0% | 57.8% |
| NV | 48,580 | 28,963 | 19,617 | 9,346 | 36.8% | 26.1% | 52.6% |
| OH | 46,384 | 26,045 | 20,339 | 5,706 | 38.5% | 17.9% | 64.9% |
| AZ | 42,152 | 32,071 | 10,064 | 22,007 | 37.2% | 27.6% | 67.6% |
| NC | 39,136 | 21,675 | 17,461 | 4,214 | 45.0% | 27.9% | 66.2% |
| NH | 36,345 | 21,004 | 15,341 | 5,663 | 53.6% | 36.5% | 77.0% |
| FL | 31,902 | 13,779 | 18,123 | -4,344 | 3.4% | 0.0% | 6.0% |
| WA | 19,333 | 12,126 | 7,207 | 4,919 | 23.6% | 24.6% | 21.7% |
| CO | 18,505 | 13,215 | 5,290 | 7,925 | 45.3% | 42.8% | 51.6% |
| UT | 14,502 | 0 | 8,039 | -8,039 | 63.0% | 63.0% | |
| IA | 13,669 | 5,168 | 8,501 | -3,333 | 3.7% | 1.6% | 5.0% |
| AK | 10,449 | 1,595 | 8,854 | -7,259 | 73.7% | 100.0% | 68.9% |
| MO | 10,423 | 7,658 | 2,765 | 4,893 | 1.9% | 2.6% | 0.0% |
| ID | 9,465 | 0 | 9,465 | -9,465 | 0.0% | 0.0% | |
| LA | 9,395 | 1,380 | 8,015 | -6,635 | 0.0% | 0.0% | 0.0% |
| NY | 8,352 | 8,348 | 4 | 8,344 | 0.0% | 0.0% | 100.0% |
| OR | 6,781 | 6,781 | 0 | 6,781 | 0.0% | 0.0% | |
| CT | 5,263 | 4,106 | 1,157 | 2,949 | 16.0% | 0.0% | 72.9% |
| IN | 3,721 | 71 | 3,650 | -3,579 | 0.0% | 0.0% | 0.0% |
| ND | 3,410 | 0 | 3,011 | -3,011 | 0.0% | 0.0% | |
| KY | 2,624 | 0 | 2,624 | -2,624 | 0.0% | 0.0% | |
| KS | 2,611 | 0 | 2,611 | -2,611 | 0.0% | 0.0% | |
| IL | 2,610 | 2,610 | 0 | 2,610 | 0.0% | 0.0% | |
| OK | 2,157 | 331 | 1,826 | -1,495 | 4.9% | 0.0% | 5.8% |
| AR | 1,536 | 0 | 1,536 | -1,536 | 19.0% | 19.0% | |
| SC | 1,447 | 0 | 1,447 | -1,447 | 0.0% | 0.0% | |
| SD | 1,379 | 0 | 1,379 | -1,379 | 0.0% | 0.0% | |
| MD | 873 | 873 | 0 | 873 | 0.0% | 0.0% | |
| HI | 789 | 789 | 0 | 789 | 0.0% | 0.0% | |
| VT | 727 | 565 | 162 | 403 | 1.7% | 0.0% | 7.4% |
| AL | 110 | 0 | 110 | -110 | 100.0% | 100.0% | |
| AK | 66 | 0 | 66 | -66 | 0.0% | 0.0% | |
| Figures are from September 5, 2022, to October 30, 2022. Numbers include broadcast television for all sponsors. Table does not show 6463 airings promoting independent candidate Evan McMullin in Utah. Of these, 33 percent are from a supportive group, Put Utah First PAC. CITE SOURCE OF DATA AS: Kantar Media/CMAG with analysis by the Wesleyan Media Project. |
|||||||
Table 4 looks at ad spending across a wider range of venues and platforms for Senate candidates in the fall general election period. It combines candidates and party/candidate coordinated spending. Two incumbent Democratic Senators, Raphael Warnock in Georgia and Mark Kelly in Arizona, are in the top 3 for spending (Table 4). Warnock’s campaign has spent an estimated $31 million on ads (including television, radio, and digital) since early September, with 18 percent of his spending on digital ads. Warnock’s Republican opponent, Herschel Walker, has spent just under $13 million. Mark Kelly has spent over $20 million on ads in the Fall general election, vastly more than his Republican opponent, Blake Masters, who has spent just over $2.5 million on ads.
One Democratic challenger, John Fetterman in Pennsylvania, is number two on the list, with over $21 million in ad spending in the fall general election campaign. Sixteen percent of his ad spending has been for Google and Facebook ads.
In Nevada, the Democratic incumbent, Catherine Cortez Masto, has spent over $17 million on ads since early September, most of it on broadcast television spots. Her opponent, Adam Laxalt, has spent about half that total, $8 million. Neither candidate has spent a significant amount on Facebook or Google ads. This is in comparison to the Democratic challenger in Wisconsin, Mandela Barnes, who has spent nearly $4 million on digital ads since early September (in addition to over $14 million on television and radio ads), accounting for 22 percent of his ad spending.
Table 4: Ad Spending by Candidate Sponsors in Senate Races (Fall General Election)
| Sponsor | State | Party | TV Broadcast Cost (in $Ms) | Other TV & Radio Cost (in $Ms) | Facebook Cost (in $Ms) | Google Cost (in $Ms) | Total Cost (in $Ms) | % Digital |
|---|---|---|---|---|---|---|---|---|
| Warnock, Raphael | GA | DEM | 16.84 | 8.72 | 1.91 | 3.75 | 31.22 | 18% |
| Fetterman, John | PA | DEM | 14.62 | 3.32 | 1.27 | 2.05 | 21.27 | 16% |
| Kelly, Mark | AZ | DEM | 13.18 | 5.29 | 0.81 | 1.03 | 20.3 | 9% |
| Barnes, Mandela | WI | DEM | 11.64 | 2.4 | 1.13 | 2.77 | 17.94 | 22% |
| Masto, Catherine Cortez | NV | DEM | 14.77 | 1.32 | 0.33 | 0.72 | 17.14 | 6% |
| Demings, Val | FL | DEM | 12.56 | 1.93 | 1.08 | 1.11 | 16.68 | 13% |
| Ryan, Tim | OH | DEM | 11.11 | 2.6 | 0.57 | 1.84 | 16.12 | 15% |
| Rubio, Marco | FL | REP | 11.4 | 2.46 | 0.13 | 0.71 | 14.71 | 6% |
| Walker, Herschel | GA | REP | 7.49 | 4.62 | 0.21 | 0.58 | 12.9 | 6% |
| Hassan, Maggie | NH | DEM | 7.61 | 4.16 | 0.18 | 0.59 | 12.54 | 6% |
| Oz, Mehmet | PA | REP | 9.59 | 1.02 | 0.06 | 0.59 | 11.25 | 6% |
| Johnson, Ron | WI | REP | 7.4 | 3.16 | 0.15 | 0.41 | 11.12 | 5% |
| Beasley, Cheri | NC | DEM | 6.77 | 2.33 | 0.13 | 1.2 | 10.43 | 13% |
| Laxalt, Adam | NV | REP | 4.86 | 3.09 | 0.02 | 0.34 | 8.32 | 4% |
| Bennet, Michael | CO | DEM | 5.34 | 1.28 | 0.43 | 0.45 | 7.49 | 12% |
| Schumer, Chuck | NY | DEM | 4.35 | 2.61 | 0.21 | 0.3 | 7.47 | 7% |
| Murray, Patty | WA | DEM | 3.55 | 1.58 | 0.15 | 0.79 | 6.07 | 16% |
| Vance, Jd | OH | REP | 4.05 | 1.01 | 0.01 | 0.45 | 5.52 | 8% |
| Smiley, Tiffany | WA | REP | 3.85 | 1.3 | 0.09 | 0.22 | 5.46 | 6% |
| Busch Valentine, Trudy | MO | DEM | 3.08 | 1.01 | 0.03 | 0.69 | 4.8 | 15% |
| Kennedy, John | LA | REP | 2.51 | 1.34 | 0.12 | 0.22 | 4.2 | 8% |
| Budd, Ted | NC | REP | 3.22 | 0.65 | 0.01 | 0.29 | 4.16 | 7% |
| Duckworth, Tammy | IL | DEM | 1.61 | 0.99 | 0.18 | 0.01 | 2.79 | 7% |
| O'Dea, Joe | CO | REP | 1.75 | 0.79 | 0.06 | 0.16 | 2.76 | 8% |
| Masters, Blake | AZ | REP | 2.15 | 0.22 | 0.08 | 0.18 | 2.62 | 10% |
| Grassley, Chuck | IA | REP | 2.27 | 0.16 | 0.02 | 0.04 | 2.49 | 2% |
| Franken, Michael | IA | DEM | 1.57 | 0.38 | 0.37 | 0.14 | 2.46 | 21% |
| Paul, Rand | KY | REP | 0.99 | 1.04 | 0.06 | 0.09 | 2.18 | 7% |
| Scott, Tim | SC | REP | 0.9 | 0.96 | 0.07 | 0.18 | 2.11 | 12% |
| Murkowski, Lisa | AK | REP | 1.23 | 0.42 | 0.16 | 0.26 | 2.07 | 21% |
| Young, Todd | IN | REP | 1.19 | 0.56 | 0.03 | 0.23 | 2 | 13% |
| Crapo, Mike | ID | REP | 0.98 | 0.85 | 0.03 | 0.09 | 1.95 | 6% |
| Blumenthal, Richard | CT | DEM | 0.81 | 1.05 | 0.01 | 0.06 | 1.93 | 4% |
| Schmitt, Eric | MO | REP | 1.58 | 0 | 0 | 0.01 | 1.59 | 1% |
| Wyden, Ron | OR | DEM | 1.24 | 0.1 | 0.09 | 0.11 | 1.55 | 13% |
| Lee, Mike | UT | REP | 1.15 | 0.13 | 0.12 | 0.14 | 1.54 | 17% |
| McMullin, Evan | UT | UN | 0.85 | 0.19 | 0.13 | 0.11 | 1.29 | 19% |
| Hoeven, John | ND | REP | 1.04 | 0.1 | 0.01 | 0 | 1.15 | 1% |
| Bolduc, Don | NH | REP | 0.72 | 0.36 | 0.03 | 0.01 | 1.12 | 4% |
| Boozman, John | AR | REP | 0.56 | 0.12 | 0 | 0 | 0.68 | 0% |
| Mullin, Markwayne | OK | REP | 0.37 | 0 | 0 | 0 | 0.37 | 0% |
| Mixon, Luke | LA | DEM | 0.25 | 0 | 0 | 0 | 0.25 | 2% |
| Van Hollen, Chris | MD | DEM | 0.21 | 0 | 0 | 0.04 | 0.25 | 15% |
| Tshibaka, Kelly | AK | REP | 0.19 | 0.02 | 0 | 0.03 | 0.24 | 12% |
| Thune, John | SD | REP | 0.15 | 0.02 | 0 | 0.02 | 0.2 | 13% |
| Horn, Kendra | OK | DEM | 0.13 | 0.05 | 0 | 0 | 0.18 | 4% |
| Welch, Peter | VT | DEM | 0.08 | 0.02 | 0.01 | 0.06 | 0.17 | 45% |
| Lankford, James | OK | REP | 0.07 | 0.05 | 0 | 0 | 0.13 | 3% |
| McDermott, Tom | IN | DEM | 0 | 0.08 | 0.01 | 0 | 0.09 | 15% |
| Schatz, Brian | HI | DEM | 0 | 0 | 0.02 | 0.03 | 0.05 | 100% |
| Booker, Charles | KY | DEM | 0 | 0 | 0.03 | 0 | 0.03 | 100% |
| Moran, Jerry | KS | REP | 0 | 0 | 0.01 | 0.01 | 0.03 | 100% |
| Meuser, Mark | CA | REP | 0 | 0 | 0.03 | 0 | 0.03 | 100% |
| Bengs, Brian | SD | DEM | 0 | 0.01 | 0.01 | 0 | 0.02 | 60% |
| Malloy, Gerald | VT | REP | 0.01 | 0.01 | 0 | 0 | 0.02 | 2% |
| Levy, Leora | CT | REP | 0 | 0 | 0.01 | 0.01 | 0.01 | 100% |
| Chesbro, Patricia | AK | DEM | 0 | 0 | 0.01 | 0 | 0.01 | 100% |
| Britt, Katie Boyd | AL | REP | 0 | 0 | 0.01 | 0 | 0.01 | 100% |
| Pinion, Joseph III | NY | REP | 0 | 0 | 0.01 | 0 | 0.01 | 100% |
| TV and radio figures are from September 5, 2022, to October 30, 2022. Figures include coordinated spending between candidates and parties. Numbers include broadcast television, local and national cable, radio, and satellite television. Facebook figures are from September 5, 2022, to October 29, 2022. Google figures are from September 4, 2022, to October 29, 2022. Spending figures smaller than $5,000 will show as $0 in this table. Table includes candidates heading into the general election with at least $5,000 in total spending across these sources. Candidate status provided by OpenSecrets and the Wesleyan Media Project. CITE SOURCE OF DATA AS: Kantar/CMAG (for TV and radio) and the Google and Facebook Ad Libraries (for digital) with analysis by the Wesleyan Media Project. |
||||||||
Additionally, the Wesleyan Media Project is looking at the content of digital ads placed on Facebook. For this report, WMP examined general election Senate candidates and their Facebook ads in the second half of October. A longer description of the methodology of the estimates in Table 5 is provided at the end of this report. WMP assessed each of the Facebook ads purchased by Senate candidates to determine whether they were likely intended to persuade voters to cast a ballot for or against a candidate or were intended to raise money. The analysis also examines the geographic reach of these ads, reporting the percentage of impressions on Facebook that were in the candidate’s state.
John Fetterman has spent the most on Facebook in the last two weeks, just over $530,000, which is a change from the prior month when Warnock was the top spender. In the past two weeks, 11 of the top 12 candidates in total spending by Senate candidates on Facebook are Democrats. Across candidates, though, the goal and geographic reach of their ads is very different. Fetterman is heavily focused on fund-raising out of the state, for example, while Catherine Cortez Masto in Nevada is comparatively more focused on voters in-state and on persuasion over fund-raising. Similarly, over 80 percent of Facebook ads from Democratic challenger Val Demings in Florida are focused on fund-raising, compared to just 23 percent of Facebook ads from Mandela Barnes in Wisconsin.
Table 5: Facebook Ad Spending by U.S. Senate Candidates (Last Two Weeks)
| Sponsor | Party | State | Pct Goal Persuade | Pct Goal Fundraising | Pct In-State | Est. Spend from Fb Ad Library Report |
|---|---|---|---|---|---|---|
| Fetterman, John | DEM | PA | 16% | 83% | 37% | 532,132 |
| Warnock, Raphael | DEM | GA | 18% | 54% | 23% | 512,601 |
| Barnes, Mandela | DEM | WI | 73% | 23% | 54% | 372,141 |
| Demings, Val | DEM | FL | 15% | 83% | 27% | 345,536 |
| Kelly, Mark | DEM | AZ | 56% | 42% | 49% | 298,531 |
| Cortez Masto, Catherine | DEM | NV | 55% | 44% | 56% | 191,264 |
| Ryan, Tim | DEM | OH | 27% | 72% | 38% | 146,937 |
| Schumer, Charles E | DEM | NY | 100% | 0% | 100% | 129,660 |
| Bennet, Michael F. | DEM | CO | 37% | 63% | 52% | 105,983 |
| Duckworth, L. Tammy | DEM | IL | 73% | 26% | 61% | 74,002 |
| Beasley, Cheri | DEM | NC | 67% | 33% | 64% | 71,014 |
| Lee, Mike | REP | UT | 11% | 73% | 44% | 64,141 |
| Franken, Michael T | DEM | IA | 7% | 93% | 10% | 58,048 |
| Kennedy, John Neely | REP | LA | 67% | 11% | 74% | 54,090 |
| Murray, Patty | DEM | WA | 70% | 26% | 98% | 51,034 |
| McMullin, Evan | UN | UT | 40% | 57% | 55% | 49,666 |
| Walker, Herschel | REP | GA | 36% | 55% | 45% | 48,957 |
| Wyden, Ronald Lee | DEM | OR | 100% | 0% | 87% | 46,041 |
| Murkowski, Lisa | REP | AK | 99% | 0% | 100% | 40,721 |
| Hassan, Margaret Wood | DEM | NH | 33% | 67% | 36% | 38,913 |
| Smiley, Tiffany | REP | WA | 100% | 0% | 100% | 34,086 |
| Masters, Blake | REP | AZ | 100% | 0% | 100% | 29,860 |
| Rubio, Marco | REP | FL | 7% | 82% | 28% | 28,063 |
| Booker, Charles | DEM | KY | 39% | 61% | 50% | 20,596 |
| Johnson, Ron Harold Mr. | REP | WI | 95% | 3% | 96% | 19,910 |
| O'Dea, Joseph Matthew | REP | CO | 46% | 54% | 86% | 18,899 |
| Schatz, Brian | DEM | HI | 100% | 0% | 100% | 18,840 |
| Scott, Timothy E | REP | SC | 63% | 0% | 48% | 16,640 |
| Crapo, Michael D | REP | ID | 83% | 12% | 83% | 15,687 |
| Oz, Mehmet Dr | REP | PA | 0% | 85% | 12% | 14,644 |
| Bolduc, Donald C. | REP | NH | 77% | 0% | 85% | 13,855 |
| Meuser, Mark | REP | CA | 82% | 10% | 96% | 11,980 |
| Young, Todd Christopher | REP | IN | 100% | 0% | 100% | 10,130 |
| Mcdermott, Thomas M. Jr | DEM | IN | 82% | 11% | 93% | 9,065 |
| Moran, Jerry | REP | KS | 80% | 13% | 89% | 8,601 |
| Welch, Peter | DEM | VT | 54% | 41% | 62% | 7,176 |
| Chesbro, Patricia | DEM | AK | 100% | 0% | 100% | 7,080 |
| Laxalt, Adam | REP | NV | 82% | 0% | 98% | 6,325 |
| Bengs, Brian L | DEM | SD | 28% | 72% | 48% | 5,787 |
| See the About the Data section for a description of the methodology used to produce this table. Figures are from October 16, 2022, to October 29, 2022. Table includes candidates heading into the general election with at least $5,000 in total spending during the two week period as reported by Facebook. Candidate status provided by OpenSecrets and the Wesleyan Media Project. CITE SOURCE OF DATA AS: Facebook Ad Libraries (for digital) with analysis by the Wesleyan Media Project. |
||||||
CA-22 Continues to Dominate, with Nearly 45k spots; ME-02, NM-02, and MT-01 have over 20k
The race in California’s 22nd congressional district, which features incumbent Republican David Valadao and Democratic challenger Rudy Salas, has seen the most ad airings—by far—of any House race during the fall general election period (Table 6). Since September 5, over 44,000 ads have aired in that race—almost double the number that aired in the number two race on the list, Maine’s 2nd congressional district contest. The races in New Mexico’s second congressional district and Montana’s 1st congressional district have also seen over 20,000 ads during the fall campaign.
Table 6: House Airings by District (Fall General Election)
| District | Airings | Pro-Dem Airings | Pro-Rep Airings | Pro-Dem Advantage | % Group Airings | % Pro-Dem Group Airings | % Pro-Rep Group Airings |
|---|---|---|---|---|---|---|---|
| CA22 | 44,306 | 22,282 | 22,024 | 258 | 31.9% | 31.6% | 32.2% |
| ME02 | 24,607 | 13,570 | 11,037 | 2,533 | 27.0% | 25.6% | 28.7% |
| NM02 | 20,723 | 9,639 | 11,084 | -1,445 | 34.1% | 27.1% | 40.1% |
| MT01 | 20,141 | 9,562 | 10,579 | -1,017 | 16.5% | 20.8% | 12.6% |
| WA08 | 17,621 | 11,431 | 6,190 | 5,241 | 38.7% | 21.7% | 70.3% |
| IL17 | 17,597 | 10,333 | 7,264 | 3,069 | 38.2% | 29.1% | 51.2% |
| MI07 | 17,300 | 11,150 | 6,150 | 5,000 | 19.9% | 12.4% | 33.5% |
| CA13 | 16,359 | 9,471 | 6,888 | 2,583 | 43.0% | 22.2% | 71.6% |
| VA07 | 16,356 | 10,232 | 6,124 | 4,108 | 23.9% | 20.8% | 29.1% |
| VA02 | 15,567 | 10,913 | 4,654 | 6,259 | 29.2% | 16.2% | 59.8% |
| NY19 | 15,408 | 10,200 | 5,208 | 4,992 | 27.6% | 19.9% | 42.7% |
| TX28 | 15,205 | 8,116 | 7,089 | 1,027 | 46.7% | 27.2% | 69.0% |
| IA03 | 13,918 | 8,484 | 5,434 | 3,050 | 20.2% | 10.5% | 35.4% |
| NE02 | 13,797 | 5,758 | 8,039 | -2,281 | 32.8% | 27.5% | 36.5% |
| CO03 | 13,535 | 0 | 13,535 | -13,535 | 0.0% | 0.0% | |
| NY22 | 13,202 | 8,181 | 5,021 | 3,160 | 41.0% | 22.2% | 71.8% |
| CA49 | 12,652 | 7,405 | 5,247 | 2,158 | 46.1% | 33.0% | 64.5% |
| MN02 | 11,879 | 6,537 | 5,342 | 1,195 | 39.4% | 20.5% | 62.6% |
| KS03 | 11,605 | 7,765 | 3,840 | 3,925 | 31.0% | 21.5% | 50.1% |
| OR05 | 11,275 | 4,363 | 6,912 | -2,549 | 43.0% | 0.0% | 70.2% |
| NH01 | 10,970 | 4,569 | 6,401 | -1,832 | 52.6% | 41.3% | 60.6% |
| CO08 | 10,885 | 5,413 | 5,472 | -59 | 39.2% | 21.1% | 57.2% |
| IA02 | 10,803 | 4,384 | 6,419 | -2,035 | 12.1% | 0.0% | 20.3% |
| PA07 | 10,367 | 5,563 | 4,804 | 759 | 34.6% | 17.1% | 55.0% |
| MI08 | 10,320 | 5,715 | 4,605 | 1,110 | 26.2% | 25.5% | 27.1% |
| OH01 | 9,888 | 6,107 | 3,781 | 2,326 | 29.4% | 21.3% | 42.5% |
| Figures are from September 5, 2022, to October 30, 2022. Numbers include broadcast television for all sponsors. CITE SOURCE OF DATA AS: Kantar Media/CMAG with analysis by the Wesleyan Media Project. |
|||||||
TX Governor Race is Top Statewide Election
The race for governor of Texas has seen more airings than any other race for governor, with almost 89,000 airings during the fall campaign. Though ads favoring incumbent governor Greg Abbott are more numerous than those favoring his challenger, Beto O’Rourke, the gap between the two is relatively small—about 4,000 airings. Florida’s gubernatorial race has seen just under 60,000 airings during the fall, but incumbent Ron DeSantis holds a huge advantage of over 36,000 ad airings. Races in Wisconsin and Georgia have each seen about 49,000 ad airings.
Table 7: Gubernatorial Airings by State (Fall General Election)
| State | Airings | Pro-Dem Airings | Pro-Rep Airings | Pro-Dem Advantage | % Group Airings | % Pro-Dem Group Airings | % Pro-Rep Group Airings |
|---|---|---|---|---|---|---|---|
| TX | 88,854 | 42,414 | 46,440 | -4,026 | 18.1% | 37.9% | 0.0% |
| FL | 59,059 | 11,251 | 47,808 | -36,557 | 0.0% | 0.0% | 0.0% |
| WI | 48,911 | 31,113 | 17,798 | 13,315 | 50.4% | 44.8% | 60.1% |
| GA | 48,585 | 22,673 | 25,912 | -3,239 | 0.0% | 0.0% | 0.0% |
| OR | 41,572 | 20,633 | 12,930 | 7,703 | 0.1% | 0.0% | 0.2% |
| KS | 26,770 | 16,388 | 10,382 | 6,006 | 44.2% | 70.0% | 3.5% |
| MI | 26,297 | 23,950 | 2,347 | 21,603 | 59.8% | 56.6% | 91.9% |
| NY | 25,255 | 15,117 | 10,138 | 4,979 | 20.9% | 1.3% | 50.2% |
| NM | 24,461 | 12,807 | 11,654 | 1,153 | 37.7% | 72.0% | 0.0% |
| NV | 23,292 | 13,369 | 9,923 | 3,446 | 37.4% | 46.0% | 25.9% |
| IL | 21,295 | 13,959 | 7,336 | 6,623 | 27.4% | 0.0% | 79.5% |
| OH | 20,212 | 6,614 | 13,598 | -6,984 | 0.0% | 0.0% | 0.0% |
| AZ | 17,309 | 12,091 | 5,218 | 6,873 | 10.5% | 15.0% | 0.2% |
| PA | 17,024 | 15,971 | 1,053 | 14,918 | 8.2% | 7.7% | 16.6% |
| CO | 16,984 | 16,420 | 260 | 16,160 | 18.1% | 16.8% | 100.0% |
| ME | 15,547 | 9,157 | 6,390 | 2,767 | 33.4% | 49.3% | 10.7% |
| OK | 14,807 | 10,008 | 4,799 | 5,209 | 63.6% | 88.5% | 11.6% |
| MN | 11,698 | 10,194 | 1,487 | 8,707 | 42.2% | 46.4% | 13.2% |
| CT | 11,596 | 7,065 | 4,531 | 2,534 | 12.0% | 0.8% | 29.4% |
| SC | 10,854 | 3,458 | 7,396 | -3,938 | 0.0% | 0.0% | 0.0% |
| RI | 7,340 | 3,967 | 3,373 | 594 | 6.5% | 12.0% | 0.0% |
| TN | 7,267 | 32 | 7,235 | -7,203 | 0.2% | 50.0% | 0.0% |
| SD | 6,927 | 1,505 | 5,422 | -3,917 | 0.0% | 0.0% | 0.0% |
| IA | 6,513 | 973 | 5,540 | -4,567 | 0.0% | 0.0% | 0.0% |
| AR | 6,467 | 1,061 | 5,406 | -4,345 | 0.0% | 0.0% | 0.0% |
| MA | 4,910 | 4,593 | 317 | 4,276 | 0.0% | 0.0% | 0.0% |
| CA | 2,655 | 2,655 | 0 | 2,655 | 0.0% | 0.0% | |
| AK | 1,807 | 355 | 389 | -34 | 0.0% | 0.0% | 0.0% |
| MD | 1,227 | 1,227 | 0 | 1,227 | 0.0% | 0.0% | |
| NH | 1,184 | 837 | 347 | 490 | 0.0% | 0.0% | 0.0% |
| NE | 1,058 | 13 | 1,045 | -1,032 | 0.0% | 0.0% | 0.0% |
| HI | 709 | 484 | 225 | 259 | 1.4% | 2.1% | 0.0% |
| ID | 159 | 0 | 159 | -159 | 0.0% | 0.0% | |
| VT | 123 | 123 | 0 | 123 | 0.0% | 0.0% | |
| AL | 79 | 0 | 79 | -79 | 0.0% | 0.0% | |
| Figures are from September 5, 2022, to October 30, 2022. Numbers include broadcast television for all sponsors. Table does not show 8809 airings promoting independent candidate Betsy Johnson in Oregon. CITE SOURCE OF DATA AS: Kantar Media/CMAG with analysis by the Wesleyan Media Project. |
|||||||
Abortion and Health Care Top Issues for Dems; Economy, Government Spending and Public Safety Top Issues for Reps
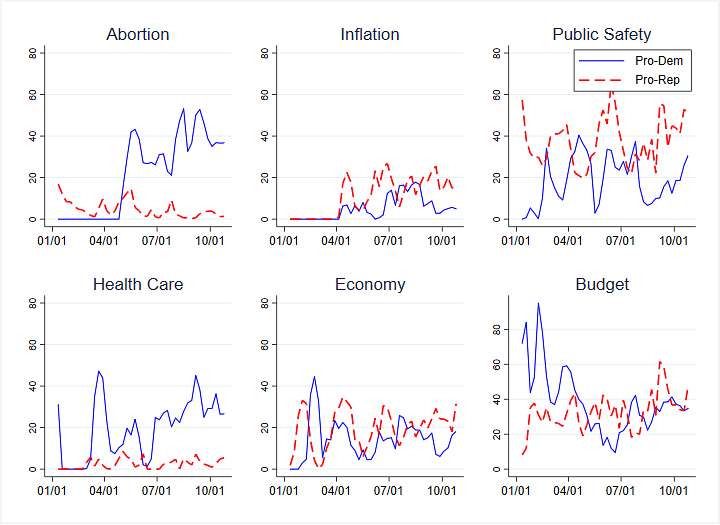
Unlike the 2018 midterms where the issue of health care dominated the discussion on both sides, the 2022 midterms have featured differing issue priorities between the parties. As shown in Figure 3, abortion was a key talking point in federal ads for Republicans during the primary season, but pro-Democratic ads began discussing the issue over the summer, and the issue has remained important in pro-Democratic ads since July. Following a different pattern, pro-Democratic ads have consistently discussed healthcare throughout the year, while pro-Republican ads have largely ignored it. Discussion of the economy, inflation and the budget (typically government spending) have featured in ads from both parties, but pro-Republican airings have placed more emphasis on those issues during the general election. Discussion of public safety, including crime and police, has been consistent in ads favoring both parties, though generally at a higher level in pro-Republican ads.
Figure 3: Discussion of Issues in Federal Races by Party over Time
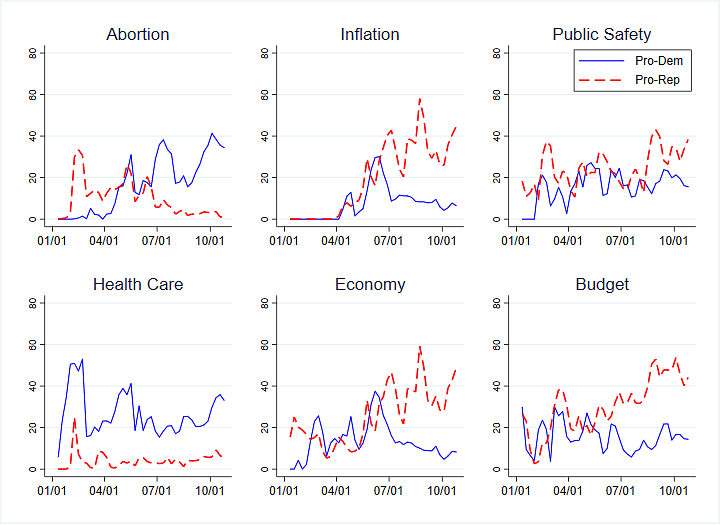
Figures are percentages of each sides’ advertising from January 1, 2022, to October 30, 2022.
Numbers include broadcast television for all sponsors.
CITE SOURCE OF DATA AS: Kantar/CMAG with analysis by the Wesleyan Media Project.
In gubernatorial races, although abortion and health care have been featured overwhelmingly in pro-Democratic advertising, both parties have focused on the economy and government spending (labeled budget). Pro-Republican airings in the general election have featured inflation in roughly one out of every five ads, with ads mentioning the economy and government spending being higher. During the early part of the general election, the economy wasn’t a big focus on the Democratic side, but pro-Democratic ads have come back to the issue in their closing arguments.
Figure 4: Discussion of Issues in Gubernatorial Races by Party over Time
Figures are percentages of each sides’ advertising from January 1, 2022, to October 30, 2022.
Numbers include broadcast television for all sponsors.
CITE SOURCE OF DATA AS: Kantar/CMAG with analysis by the Wesleyan Media Project.
In the last two weeks, nearly a third (30 percent) of ads by or on behalf of Democratic Senate candidates have talked about health care (Table 8). This issue is followed closely by abortion (27 percent). More than four in ten pro-Republican airings meanwhile have focused on public safety, the economy, budget matters, and inflation, followed closely by taxes (39 percent).
Table 8: Top Issues in U.S. Senate Races by Party Lean (October 17-30)
| Issue | pro-Dem % | Issue | pro-Rep % |
|---|---|---|---|
| Health care | 29.9% | Public Safety | 44.8% |
| Abortion | 27.5% | Economy | 44.7% |
| Taxes | 16.9% | Budget | 44.0% |
| Prescription Drugs | 15.9% | Inflation | 43.8% |
| Jobs | 15.7% | Taxes | 38.7% |
| Social Security | 15.3% | Immigration | 28.6% |
| Campaign Finance | 14.3% | Oil | 23.8% |
| Medicare | 12.9% | Drugs | 14.1% |
| Trade with China | 11.8% | Housing | 9.5% |
| Old Age Issues | 10.5% | Education | 8.0% |
| Figures are from October 17, 2022, to October 30, 2022. Numbers include broadcast television for all sponsors. CITE SOURCE OF DATA AS: Kantar Media/CMAG with analysis by the Wesleyan Media Project. |
|||
In races for the U.S. House, four out of ten pro-Democratic ads in the last two weeks have mentioned abortion while a similar number have mentioned health care. Nearly a quarter have mentioned prescription drugs. Unlike the Senate, social security does not appear on the top ten list for pro-Democratic ads in the House, but Medicare made it in as number 10. On the Republican side, nearly half of all airings have discussed the economy, with taxes, budget/government spending and inflation close behind.
Table 9: Top Issues in U.S. House Races by Party Lean (October 17-30)
| Issue | pro-Dem % | Issue | pro-Rep % |
|---|---|---|---|
| Abortion | 41.1% | Economy | 45.4% |
| Health care | 38.3% | Taxes | 42.2% |
| Prescription Drugs | 24.3% | Budget | 40.9% |
| Public Safety | 20.7% | Inflation | 40.7% |
| Budget | 20.1% | Oil | 37.1% |
| Women's Rights | 13.7% | Public Safety | 28.5% |
| Taxes | 13.0% | Jobs | 11.5% |
| Voting | 12.4% | Immigration | 11.1% |
| 2020 Election | 12.0% | Utility Rates | 8.6% |
| Medicare | 11.8% | Corruption | 7.0% |
| Figures are from October 17, 2022, to October 30, 2022. Numbers include broadcast television for all sponsors. CITE SOURCE OF DATA AS: Kantar Media/CMAG with analysis by the Wesleyan Media Project. |
|||
Closing arguments in gubernatorial races have focused heavily on crime and public safety on the Republican side, with over half of all airings featuring the topic. Taxes and government spending were another big talking point, featured in roughly four in every ten ad airings. On the Democratic side, abortion, education and budget/government spending were featured in over one-third of all airings.
Table 10: Top Issues in Gubernatorial Races by Party Lean (October 17-30)
| Issue | pro-Dem % | Issue | pro-Rep % |
|---|---|---|---|
| Abortion | 36.5% | Public Safety | 51.5% |
| Education | 34.8% | Taxes | 42.8% |
| Budget | 34.2% | Budget | 39.6% |
| Public Safety | 27.5% | Jobs | 31.0% |
| Health care | 27.3% | Education | 30.6% |
| Women's Rights | 25.2% | Economy | 23.3% |
| Taxes | 23.1% | Oil | 15.4% |
| Economy | 16.8% | Inflation | 15.2% |
| Jobs | 15.7% | Coronavirus | 12.3% |
| Guns/Gun Control | 10.3% | Immigration | 11.3% |
| Figures are from October 17, 2022, to October 30, 2022. Numbers include broadcast television for all sponsors. CITE SOURCE OF DATA AS: Kantar Media/CMAG with analysis by the Wesleyan Media Project. |
|||
Notably, some issues have been largely absent from the airwaves this year. For example, amid economic concerns and cost of living discussion, climate change has been mentioned in only 1.1 percent of all federal airings during 2022 (1.8 percent of pro-Democratic ads and 0.4 percent of pro-Republican ones), and attention to the issue dropped during the general election period when only 0.5 percent of all ads mentioned the topic (0.6 percent of pro-Democratic ads and 0.5 percent of pro-Republican ones). Ads for governor were even less likely to discuss climate change overall with just 0.6 percent in 2022, predominantly from Democrats (1.2 compared to 0.1 percent), but attention to the issue actually increased slightly in the general election period with 0.9 percent overall (1.6 percent of pro-Democratic ads compared to 0.03 in pro-Republican ones).
Critical race theory, which following Virginia Governor Glenn Youngkin’s election, may have been expected to be more prominent in pro-Republican messaging, has appeared in only one percent of all gubernatorial airings in 2022 (1.7 percent of pro-Republican gubernatorial airings with none on the Democratic side). In federal races, attention is similar at 0.7 percent of all airings and 1.4 percent of all pro-Republican airings in 2022 (with none from Democrats). Attention to the issue decreased as a proportion of all airings in both gubernatorial and federal airings during the general election.
Similarly, references to child tax credits have appeared in only 0.3 percent of gubernatorial and 0.2 percent of federal airings in 2022. Attention to the issue as a proportion of ads on television increased slightly during the general election to 0.5 percent in gubernatorial races and 0.2 percent of federal airings, with the bulk (over two-thirds) of these mentions appearing in pro-Democratic advertising.
Negativity Abounds in U.S. Senate Races
Figure 5 shows both the volume of pro-Democratic and pro-Republican Senate ads by tone—promotional (positive), contrast or attack (negative)—and the percentage of total ads by party that fall into each category.
As the top panels of the figure make clear, the pro-Democratic advantage in airings has grown over the last two weeks, with ads by or on behalf of Democratic candidates making up roughly 60,000 ads on air compared to only 45,000 by or on behalf of Republican candidates.
As shown by the lower panels, the proportion of pure attacks on the Senate side has been pretty consistent (as a percentage of all ads on air) throughout the fall general election period while Republican airings have decreased their use of pure attacks in favor of more contrast advertising; however, there was an uptick in promotional advertising in the last week.
Figure 5: Weekly Volume and Percentage of U.S. Senate Advertising by Tone
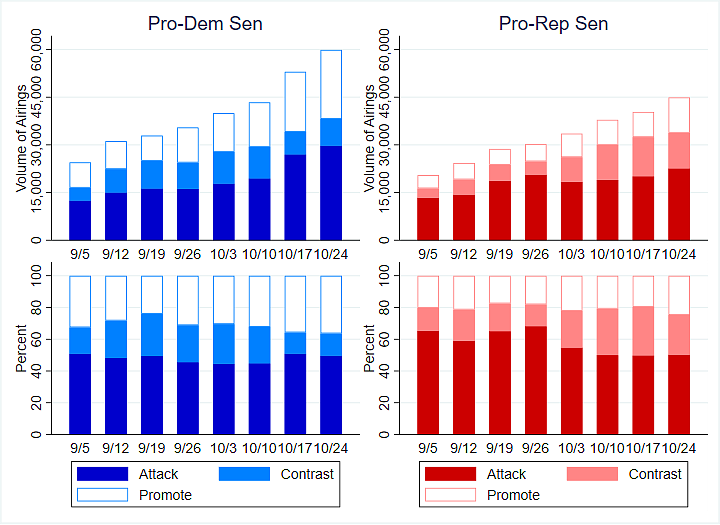
Figures are from September 5, 2022, to October 30, 2022.
Numbers include broadcast television for all sponsors.
CITE SOURCE OF DATA AS: Kantar/CMAG with analysis by the Wesleyan Media Project.
Turning to U.S. House races (Figure 6), we see that the aggregate pro-Democratic advantage in ad airings in House races is even larger than in U.S. Senate races, with ads by or on behalf of Democratic candidates reaching 80,000 in just the last week alone compared to just over 60,000 airings by or on behalf of Republican candidates. As for tone, although the number of pure attacks on air has increased week over week, looking at the bottom panel we see that the proportion of pure attacks in pro-Democratic airings has gone down over the last few weeks. This stands in contrast to the very stable proportion of pure attacks in Republican airings, where six out of every ten ads has been pure attack.
Figure 6: Weekly Volume and Percentage of U.S. House Advertising by Tone
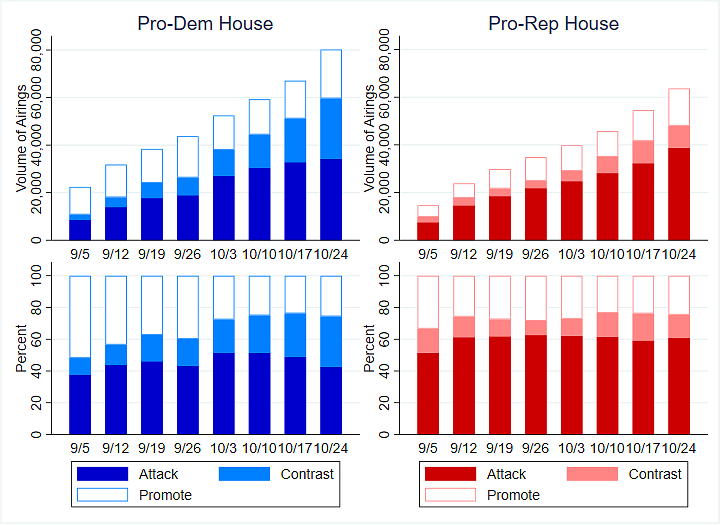
Figures are from September 5, 2022, to October 30, 2022.
Numbers include broadcast television for all sponsors.
CITE SOURCE OF DATA AS: Kantar/CMAG with analysis by the Wesleyan Media Project.
Of course pro-Democratic ad advantages are not very meaningful in the aggregate; therefore, Figure 7 shows the ad advantages in the general election period (September 5 through October 30) by media market and in both the U.S. House and the U.S. Senate (see the drop down menu to change between races; keep in mind that multiple races within chamber may be aggregated within a media market, especially on the U.S. House side).
Looking first at U.S. Senate contests, we see big pro-Democratic ad advantages in Arizona, Nevada, Colorado and some Georgia and Wisconsin media markets. Republicans, by contrast, have advantages in LaCrosse and Wausau, Wisconsin.
In U.S. House races, we see big pro-Democratic advantages across the map, but Republicans have large advantages in Cedar Rapids (Iowa), Spokane (Washington), Tucson (Arizona), Grand Junction (Colorado) and Colorado Springs (Colorado).
Figure 7: Ad Advantage in U.S. House and U.S. Senate Races (General Election)
Numbers include ads aired on broadcast television (excluding national cable airings) between October 17, 2022 and October 30, 2022. Totals include candidate, party, and group-sponsored ads. Figure by Markus Neumann with code from Delta Lab’s Spencer Dean ’21 and Kevin McMorrow ’20.
CITE SOURCE OF DATA AS: Kantar/CMAG with analysis by the Wesleyan Media Project.
Turning to tone and volume in gubernatorial races, Figure 8 shows that although Democrats still have advantages in the aggregate, they do not have the same advantage on air that they do in federal contests. Democratic ads for governor have been more likely to use contrast spots—those that mentioned both the favored candidate and an opponent—in the closing weeks of the campaign compared to pure attacks in the early general election period. The pattern is similar for Republican airings although pure attacks have climbed back slightly from a low of roughly 25 percent of all airings in the week of October 10.
Figure 8: Weekly Volume and Percentage of Gubernatorial Advertising by Tone
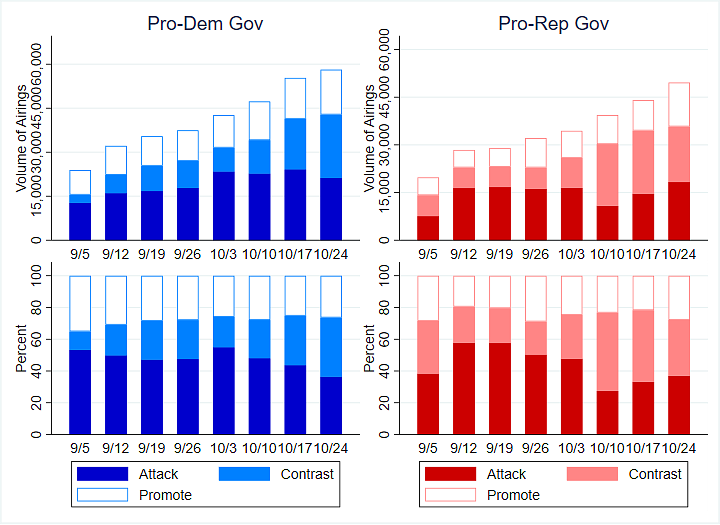
Figures are from September 5, 2022, to October 30, 2022.
Numbers include broadcast television for all sponsors.
CITE SOURCE OF DATA AS: Kantar/CMAG with analysis by the Wesleyan Media Project.
Outside Group Ad Volume High in Fall Campaign; Most Ads from Groups with Limited Donor Disclosure
In partnership with OpenSecrets, the Wesleyan Media Project also tracks outside group ad spending by the type of donor disclosure. We classify groups as full-disclosure groups (meaning they disclose contributor lists to the relevant reporting agency at the federal or state level), non-disclosing dark money groups (which are not required to disclose publicly their donors; these are most often 501c4 non-profits), and partial-disclosure groups (those that disclose donors but also accept contributions from dark money sources).
Figures 9 and 10 show the volume and percentage of outside group ads in U.S. House and U.S. Senate races for each week in 2022 up to October 30. Each week also breaks out ads by disclosure type. In both the House and Senate, ad volume is much higher in more recent weeks, though groups have been on the air more consistently in Senate races throughout 2022.
The type of group sponsoring ads, though, has changed over the course of the election year. Full disclosure and dark money groups—as a percent of group spending each week—was higher earlier in the election year, but partial disclosing groups are much more dominant in the fall general election period. Dark money groups have all but disappeared from the airwaves, in part to avoid the required reporting window for disclosing any election-related spending in the fall general election period.
Figure 9: Weekly Volume and Percentage of Outside Group House Advertising by Disclosure Type
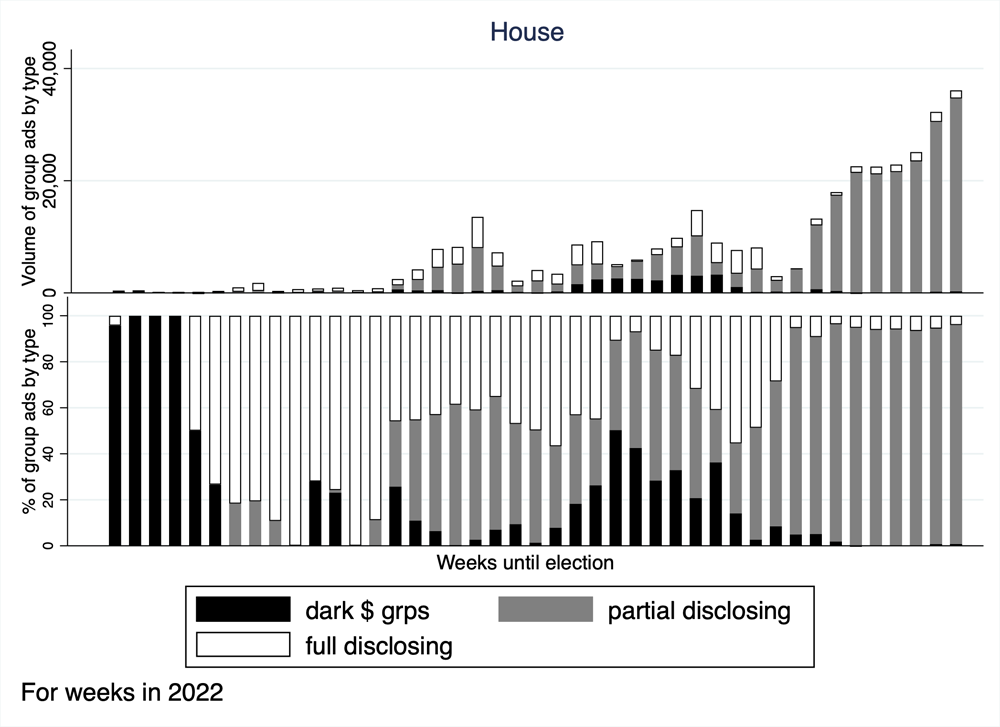
Figures are from January 1, 2022, to October 30, 2022.
CITE SOURCE OF DATA AS: Kantar/CMAG with analysis by the Wesleyan Media Project.
Figure 10: Weekly Volume and Percentage of Outside Group Senate Advertising by Disclosure Type
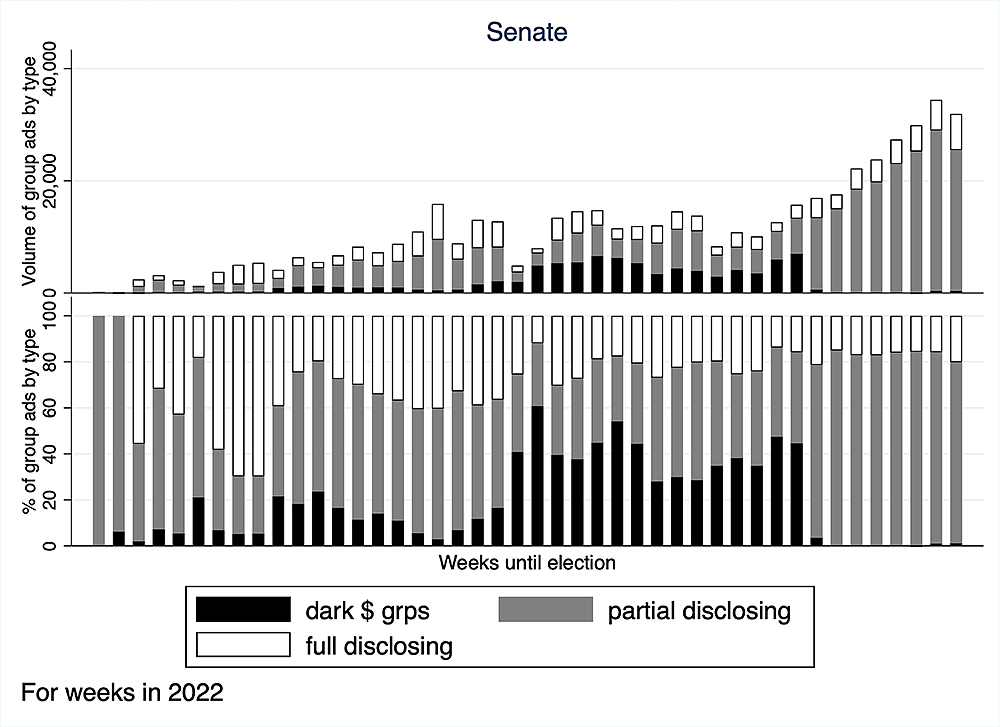
Figures are from January 1, 2022, to October 30, 2022.
CITE SOURCE OF DATA AS: Kantar/CMAG with analysis by the Wesleyan Media Project.
About the Data
Television ad totals reported here are from Kantar/CMAG (unless otherwise specified) and refer to broadcast television. All cost estimates for television are precisely that: estimates.
Facebook spending data come from the aggregate reports, which provide spending information for each page name and disclaimer combination. Totals in this report reflect spending between January 6, 2021, September 5, 2022, October 16, 2022, and October 29, 2022. These totals are calculated by subtracting the reported cumulative spending (as reported by Facebook as the total spent since May 2018) for the October 29, 2022 report and subtracting the cumulative spending reported for January 5, 2021, September 4, 2022, and October 15, 2022.
In Table A (click here to download), we list the page names/disclaimer rows from the Facebook aggregate reports that we identified for this report. It is possible that we missed some spending from a Facebook page affiliated with a candidate or group. This is exacerbated by the absence of EIN or FEC identifiers in the Facebook reports.
For Google ads, we downloaded the weekly reports from the platform’s Transparency Report. The totals reflected in this release are current as of 11/1/22, the day on which we pulled the transparency report. Google only includes spending in federal and state races and only includes weekly totals but lists the sponsor’s EIN or FEC committee ID. Google spending is from the following time periods: January 10, 2021, September 4, 2022, or October 16, 2022 and October 29, 2022.
In Table B (click here to download), we list the advertiser name for all entities used in this report to calculate Google spending totals.
For Table 5 figures in this report, we utilize content information from Facebook ads and machine learning to assess the predicted goal of the ad and to calculate whether the ad was primarily seen by users inside or outside each candidate’s state.
To determine the ad goal, human coders at WMP classify ads into several types of goals, including persuasion, fund-raising, contact, purchase, get out the vote, event, polling, gathering information, and learning more. In this report we focus only on the ad goals of persuasion and fund-raising. Random forest classifiers (one model per goal) were trained and validated on an 80/20 split sample of 3,671 human-coded ads. The F1-score performance for each classifier was 85 percent for persuasion and 99 percent for fund-raising. The models are binary predictions and therefore it is possible that an ad ID could be identified as both persuasion and fund-raising. We apply these classification models to the Facebook data retrieved through Facebook’s API. This includes the following text fields: ad creative body, page name, disclaimer, ad creative link caption, ad creative link title, and ad creative link description. Additionally, we transcribe the audio of the videos through automatic speech recognition and then concatenate the API text fields and the transcribed audio together for classification at the unique ad ID level.
For in-state ads, we identified the state of each senator and used Facebook’s “delivery by region” variable to identify what proportion of an ad’s impressions went to the senator’s state.
Unique ad IDs are best thought of as unique purchases by the advertiser rather than unique creatives because of the way Facebook assigns ad IDs, and each ad ID has an estimated upper and lower bound on spending. We filter out advertising from each page that occurred before October 16, 2022 but keep unique IDs that ran between October 16 and October 29, 2022, even if the ad started before October 16.
We calculated estimated spend by taking the average of the upper and lower spending bounds for each ad ID. In order to calculate the percentage of a candidate’s ads associated with each goal, we created new ad-level variables (goal_persuade_spending, goal_donate_spending). These new variables were assigned the estimated ad spend if the binary predication variable for that goal equaled one (an ad ID can be assigned both goals). For the in-state calculations, Facebook provides the proportion of the ad ID’s impressions by state, so we applied this proportion for the candidate’s state to the estimated ad spend for each ad ID, giving us a variable with the estimated in-state spending per ad ID (instate_spending).
We then sum over all of the ad IDs for each candidate to arrive at an estimated amount of spending devoted to each goal and to in-state impressions. We then calculate the percentage of each candidate’s advertising for each of those variables. Because the ad-level spending is reported in buckets by Facebook (upper bound and lower bound), rather than in actual spending, in Table 5 we report only the actual spending reported in the Facebook ad library report even though we used the bucketed spending to produce the percentages.
About This Report
The Wesleyan Media Project provides real-time tracking and analysis of all political television advertising in an effort to increase transparency in elections. Housed in Wesleyan’s Quantitative Analysis Center – part of the Allbritton Center for the Study of Public Life – the Wesleyan Media Project is the successor to the Wisconsin Advertising Project, which disbanded in 2009. It is directed by Erika Franklin Fowler, professor of government at Wesleyan University, Michael M. Franz, professor of government at Bowdoin College and Travis N. Ridout, professor of political science at Washington State University. WMP personnel include Laura Baum (Associate Director), Breeze Floyd (Research Coordinator), Pavel Oleinikov (Associate Director, QAC), Markus Neumann (Post-Doctoral Fellow), and Jielu Yao (Post-Doctoral Fellow).
Data are provided by Kantar/CMAG with analysis by the Wesleyan Media Project. The Wesleyan Media Project is partnering again this year with OpenSecrets, to provide added information on outside group disclosure and candidate status.
The Wesleyan Media Project’s digital advertising tracking is supported by the contributions of students in Delta Lab, an interdisciplinary research collaborative focusing on computationally-driven and innovative analyses and visualizations of media messaging.
Periodic releases of data will be posted on the project’s website and dispersed via Twitter @wesmediaproject. To be added to our email update list, click here.
For more information contact: media@wesleyan.edu.
About Wesleyan University
Wesleyan University, in Middletown, Conn., is known for the excellence of its academic and co-curricular programs. With more than 2,900 undergraduates and 200 graduate students, Wesleyan is dedicated to providing a liberal arts education characterized by boldness, rigor and practical idealism. For more, visit www.wesleyan.edu.


