Photo: Gage Skidmore/Flickr
Pro-Dem Ad Advantages Up and Down the Ballot;
Republican Airings More Negative
Report Highlights
President
- Biden and Trump spending by medium (Table 1)
- Top TV spenders in the presidential race (Table 2)
- Digital spending by Trump and Biden (Table 3)
- TV Spending by media market (Table 4, Figure 1, and compared to 2016 in Figure 2)
- Facebook spending by geography (Figure 4)
U.S. Senate
- Top TV spenders in U.S. Senate races (Table 6)
- Digital and TV spending in U.S. Senate races (Table 7)
- Tone of U.S. Senate races (Table 8, Figure 8, and Figure 9)
- Top issues in U.S. Senate races (Table 9) and Trump mentions (Table 10)
U.S. House
- Top TV spenders in U.S. House races (Table 11)
- Digital and TV spending in U.S. House races (Table 12)
- Impeachment references in U.S. House ads (see here)
Other Highlights
- Cycle-to-date ad totals (Figure 10 and Figure 12)
- Top outside groups on TV, with digital spending (Table 13)
- Dark money group spending inside and outside the disclosure window (Table 14)
- Interactive tables of Facebook advertisers that are mentioning presidential and Senate candidates in their ads (Tables 15 and 16)
- Weekly spending graphs for President (Figure 12), U.S. Senate (Figure 13), and U.S. House (Figure 14)
(MIDDLETOWN, CT) October 29, 2020 – The Wesleyan Media Project’s final report before Election Day, produced in conjunction with the Center for Responsive Politics, finds over $1.5 billion in estimated ad spending on TV, digital and radio in the presidential general election between April 9 and October 25. $991 million (65 percent) of that spending was from candidates, while outside groups (and to a lesser extent, party committees) account for the rest.
Table 1 shows Biden campaign spending on advertising across TV, digital and radio at nearly $564.7 million versus $426.3 million in Trump campaign spending. The Trump campaign has spent a greater percentage of its resources on digital advertising—47 percent versus 29 percent for the Biden campaign—but the Biden campaign has spent considerably more on local cable advertising—15 percent of its total spending versus 3 percent for the Trump campaign.
“Spending in this cycle is historic for many reasons,” said Michael Franz, co-director of the Wesleyan Media Project. “Donald Trump has spent almost as much on digital advertising as on television advertising. That could reflect smart targeting on his campaign’s part, or it could be seen as a sign of weakness, reflecting the many fundraising appeals that the campaign has made.”
Table 1: Presidential Campaign Spending by Medium
| Est. Trump Spend | Trump % | Est. Biden Spend | Biden % | |
|---|---|---|---|---|
| Broadcast TV | $174,641,694 | 41.00% | $249,866,340 | 44.20% |
| Digital | $201,460,242 | 47.30% | $166,118,753 | 29.40% |
| Local Cable | $12,128,040 | 2.80% | $81,526,877 | 14.40% |
| National Cable | $34,223,485 | 8.00% | $41,245,639 | 7.30% |
| Satellite TV | $1,245,864 | 0.30% | $3,050,659 | 0.50% |
| Radio | $2,563,809 | 0.60% | $22,947,694 | 4.10% |
| Total | $426,263,134 | $564,755,962 | ||
| Data cover the April 9, 2020 to October 25, 2020 time period. CITE SOURCE OF DATA AS: Kantar/CMAG estimates for TV, cable and radio with analysis by the Wesleyan Media Project. Digital spending totals come from Wesleyan Media Project analysis of the Facebook Ad Library, Google Transparency Reports and the Snapchat Political Ads Library. See About the Data section at the end of this report for more information on our methodology on tracking online Facebook and Google advertising along with the specific page names and disclaimers that are counted. For Snapchat, please see this analysis by Spencer Dean ’21 from WMP’s Delta Lab. |
||||
In the past two weeks, Biden has dominated broadcast and national cable television spending, as Table 2 shows. Between October 12 and 25, the Biden campaign has aired over 90,000 ad airings at a cost of $54 million, compared to 23,000 airings at a cost of $35 million for the Trump campaign. Indeed, the Trump campaign was outspent in the past two weeks by FF PAC, a pro-Biden group that aired almost 43,000 ads at a cost of $48 million. The pro-Trump super PAC, America First Action, aired the fourth most ads, while the Michael Bloomberg-backed Independence USA PAC was fifth.
Table 2: Top Spenders in Presidential Race (since Oct 12 and since April 9)
| Sponsor | Lean | Airings (Oct 12-25) | Est. Cost (Oct 12-25) | Airings (Apr 9-Oct 25) | Est. Cost (Apr 9-Oct 25) |
|---|---|---|---|---|---|
| Biden, Joe | D | 90,352 | 54,292,260 | 444,084 | 270,443,730 |
| FF PAC | D | 42,957 | 47,836,960 | 57,813 | 68,863,410 |
| Trump, Donald | R | 23,347 | 34,650,300 | 284,042 | 198,031,620 |
| America First Action | R | 14,549 | 15,509,140 | 73,300 | 55,644,680 |
| Independence USA PAC | D | 10,311 | 12,284,580 | 19,063 | 21,731,980 |
| Trump, Donald & Republican National Committee | R | 6,982 | 6,096,710 | 6,982 | 6,096,710 |
| Preserve America PAC | R | 6,237 | 14,488,180 | 30,963 | 57,830,870 |
| Priorities USA Action | D | 3,172 | 4,662,790 | 44,800 | 35,876,650 |
| AB PAC | D | 2,862 | 5,214,900 | 28,729 | 23,907,090 |
| Republican Voters Against Trump | D | 2,308 | 2,230,040 | 3,964 | 3,682,860 |
| Restoration PAC | R | 1,856 | 2,894,460 | 6,991 | 9,676,470 |
| Unite the Country | D | 1,803 | 2,278,990 | 7,829 | 6,399,910 |
| Biden, Joe & DNC | D | 1,647 | 1,223,710 | 7,525 | 6,007,220 |
| NRA Victory Fund, Inc. | R | 1,307 | 1,544,640 | 8,541 | 5,459,660 |
| Priorities USA Action & Latino Victory Fund | D | 1,265 | 1,571,270 | 2,243 | 2,891,110 |
| Republican Jewish Coalition Victory Fund | R | 632 | 921,960 | 1,736 | 2,846,570 |
| FF PAC | D | 517 | 1,211,870 | 57,813 | 68,863,410 |
| Por Nuestras Familias | D | 488 | 260,660 | 1,130 | 718,520 |
| United for Progress PAC | D | 241 | 146,840 | 290 | 182,230 |
| SEIU | D | 237 | 128,240 | 300 | 158,220 |
| LCV Victory Fund | D | 229 | 655,290 | 246 | 660,970 |
| Club for Growth Action | R | 198 | 542,930 | 6,754 | 4,851,370 |
| Somos PAC | D | 181 | 212,980 | 252 | 318,480 |
| Millions of Michiganians | D | 148 | 31,550 | 148 | 31,550 |
| United Association of Union Plumbers and Pipefitters | D | 108 | 156,470 | 524 | 799,550 |
| Moms for Safe Neighborhoods | R | 97 | 165,620 | 130 | 453,430 |
| Committee to Defend the President | R | 82 | 349,670 | 1,018 | 2,799,350 |
| Nuestro PAC | D | 78 | 308,510 | 949 | 1,049,640 |
| The Lincoln Project | D | 64 | 428,580 | 3,202 | 4,584,030 |
| Future45 | R | 54 | 502,520 | 56 | 520,640 |
| America First Policies, Inc. | R | 35 | 5,940 | 8,595 | 1,619,830 |
| Meidastouch | D | 13 | 3,870 | 333 | 461,200 |
| Take Back the West PAC | R | 7 | 3,310 | 55,383 | 3,310 |
| Everytown for Gun Safety Victory Fund | D | 2 | 2,370 | 2,882 | 3,617,340 |
| Numbers include ads aired on broadcast television and national cable between October 12 and 25, 2020 and between April 9 and October 25, 2020. CITE SOURCE OF DATA AS: Kantar/CMAG with analysis by the Wesleyan Media Project |
|||||
Trump Continues to Spend More Competitively on Digital
Excluding outside group efforts, Biden has out-aired the Trump campaign on TV in the last two weeks at a nearly four-to-one pace. But President Trump has stayed competitive with Joe Biden on digital ads (Table 3). Biden has the edge on Facebook ads since mid-October ($17 million to $14.5 million) and has a large lead on Snapchat, but Trump has spent more on Google by about $7.5 million. Since the start of the general election, Donald Trump has outspent Joe Biden on Facebook and Google combined by about $37 million. Snapchat reports $3,079,515 in Biden spending and $235,222 in Trump spending for the same period.
Table 3: Facebook and Google Ad Spending by Presidential Candidates and Single-Candidate Super PACs
| FB $ (since mid-April) | Google $ (since mid-April) | FB+Google $ (since mid-April) | FB $ (since mid-Oct) | Google $ (since mid-Oct) | FB+Google (since mid-Oct) |
|
|---|---|---|---|---|---|---|
| Biden | 83,658,938 | 79,380,300 | 163,039,238 | 17,040,764 | 21,032,800 | 38,073,564 |
| Trump | 107,766,420 | 93,458,600 | 201,225,020 | 14,581,198 | 29,459,300 | 44,040,498 |
| Unite the Country (pro-Biden) | 1,413,644 | 29,900 | 1,443,544 | 426,610 | 0 | 426,610 |
| Great America PAC (pro-Trump) | 44,150 | 0 | 44,150 | 0 | 0 | 0 |
| Digital spending figures come from the Facebook ad library reports and the Google Transparency Report. Spending covers April 9 or October 11 to October 25, 2020 (for Facebook); April 12 or October 11 to October 25, 2020 (for Google). Candidate spending numbers include spending by official campaign committees, leadership PACs, and joint fundraising committees. See About the Data section at the end of this report for more information on our methodology along with the specific page names and disclaimers that are counted. |
||||||
A Wave of Blue: Phoenix, Miami Top Media Markets for Presidential Ads
Phoenix, Arizona, continues to be the top media market for presidential ad airings (Table 4 and Figure 1). Pro-Biden ads outnumber pro-Trump ads two to one in Phoenix. Pro-Biden advertising in Miami is actually higher than in Phoenix, but Trump advertising is less than in Phoenix, resulting in a 2.7 to 1 Biden ad advantage in Miami. The ratio of pro-Biden to pro-Trump ads is even greater in media markets in Wisconsin and Michigan. In Milwaukee, for instance, there were 5900 pro-Biden ads in the past two weeks compared to just 1400 pro-Trump ads.
One market that stands out is Tallahassee, Florida, where there have been only 97 pro-Trump ads in the past couple of weeks compared to over 3000 for Biden.
“Paid advertising across the country continues to favor Biden,” said Travis Ridout, co-director of the Wesleyan Media Project. “Having an ad advantage does not guarantee a candidate victory in a state, but it can earn a percentage or two in a presidential race, which is all that divides these candidates in several battleground states.”
Table 4: Volume and Spending on Presidential Ads by Media Market (Since October 12)
| Market | Airings | Est. Cost | Pro-Dem | Pro-Rep | Biden Adv |
|---|---|---|---|---|---|
| Phoenix | 9,009 | $12,785,610 | 6,033 | 2,976 | 3,057 |
| Miami | 8,801 | $11,931,120 | 6,462 | 2,339 | 4,123 |
| Tampa | 8,618 | $10,034,510 | 6,511 | 2,107 | 4,404 |
| Philadelphia | 8,280 | $9,861,420 | 6,515 | 1,700 | 4,815 |
| Orlando | 7,408 | $8,881,120 | 5,135 | 2,273 | 2,862 |
| Milwaukee | 7,331 | $4,149,070 | 5,909 | 1,422 | 4,487 |
| Detroit | 7,125 | $10,813,180 | 6,073 | 1,052 | 5,021 |
| Pittsburgh | 6,896 | $8,108,910 | 5,167 | 1,729 | 3,438 |
| Green Bay | 6,762 | $4,020,200 | 4,923 | 1,839 | 3,084 |
| Tucson | 6,569 | $2,733,210 | 4,724 | 1,845 | 2,879 |
| Harrisburg | 6,206 | $4,262,930 | 4,502 | 1,704 | 2,798 |
| Johnstown | 5,759 | $2,697,420 | 3,621 | 2,138 | 1,483 |
| West Palm Beach | 5,647 | $4,175,490 | 3,610 | 2,037 | 1,573 |
| National Cable | 5,528 | $25,749,140 | 4,189 | 887 | 3,302 |
| Grand Rapids | 5,225 | $3,527,030 | 3,871 | 1,354 | 2,517 |
| Jacksonville | 5,091 | $2,649,580 | 3,875 | 1,216 | 2,659 |
| Wilkes Barre | 4,947 | $4,365,180 | 3,347 | 1,600 | 1,747 |
| Minneapolis | 4,146 | $3,753,290 | 3,942 | 204 | 3,738 |
| Las Vegas | 4,080 | $4,171,330 | 3,505 | 575 | 2,930 |
| Ft. Myers | 4,003 | $1,796,040 | 3,149 | 854 | 2,295 |
| Charlotte | 3,788 | $5,838,090 | 2,468 | 1,320 | 1,148 |
| Flint | 3,601 | $1,336,460 | 2,776 | 825 | 1,951 |
| Erie | 3,341 | $2,060,670 | 2,569 | 772 | 1,797 |
| Madison | 3,288 | $1,147,370 | 2,777 | 511 | 2,266 |
| La Crosse | 3,258 | $1,429,100 | 2,147 | 1,111 | 1,036 |
| Atlanta | 3,242 | $5,360,500 | 1,711 | 1,531 | 180 |
| Tallahassee | 3,161 | $642,610 | 3,064 | 97 | 2,967 |
| Lansing | 3,124 | $1,639,940 | 2,121 | 1,003 | 1,118 |
| Raleigh | 3,090 | $2,956,950 | 1,910 | 1,180 | 730 |
| Traverse City | 2,964 | $867,650 | 2,153 | 811 | 1,342 |
| Numbers include ads aired on broadcast television (national cable appears as its own row) between October 12-25, 2020. Numbers include candidate, party, and group-sponsored ads. Click here to download data for all media markets. CITE SOURCE OF DATA AS: Kantar/CMAG with analysis by the Wesleyan Media Project. |
|||||
Figure 1 has two time filters. The default time period of Figure 1 shows whether pro-Biden ads or pro-Trump ads were more numerous during the entire general election period. In general, pro-Biden ads outnumbered pro-Trump ads in Wisconsin, Michigan, Pennsylvania, Florida and Arizona, while Trump had advantages in Georgia, parts of Iowa, parts of Ohio and parts of North Carolina. The second time option in the dropdown of Figure 1 shows the ad advantage for only the past two weeks, which tells a different story. Almost every media market—the exceptions are two in Iowa and three in Georgia—are blue, indicating that Biden had a big lead in terms of the number of ads aired. Not only are the dark blue areas places where pro-Biden airings are dominating, they are also the ones that have seen the most airings overall.
Figure 1: Advertising Advantage in the Presidential Race on Television
Numbers include ads aired on broadcast television (excluding national cable airings) between April 9, 2020 and October 25, 2020,
and between October 12, 2020 and October 25, 2020. Totals include candidate, party, and group-sponsored ads.
Figure by Delta Lab’s Spencer Dean ’21 and Kevin McMorrow ’20
Download the data from Figure 1.
CITE SOURCE OF DATA AS: Kantar/CMAG with analysis by the Wesleyan Media Project.
[To view our new interactive tool where you can compare geographic spend on TV for different weeks during the general election, please click here.]
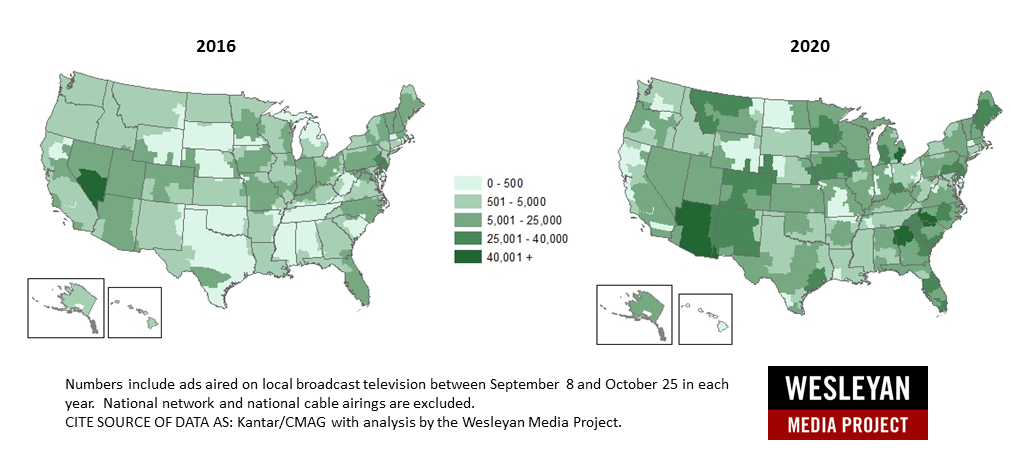
Figure 2 shows the number of broadcast television ads aired by media market in federal races in both 2016 and 2020 for the post-Labor Day period, which represents the traditional general election campaign. In many parts of the country, the shading is darker in 2020, suggesting that most Americans are seeing more ads than they did four years ago. Indeed, federal advertising cycle-to-date is up 160 percent over the 2016 cycle.
Figure 2: TV Ad Volume in Federal Races (2016 vs. 2020)
Download the data from Figure 2.
Digital Spending Much Closer Between Biden and Trump
Figures 3 and 4 shows ad spending by state for presidential campaigns on Facebook over time. Florida spending is fairly close, with Biden taking a slight lead this past week after trailing Trump there for several weeks prior, but Biden has spent more in in Pennsylvania, Michigan and Wisconsin.
Figure 3: Facebook Advertising by Presidential Candidates in Battlegrounds over Time
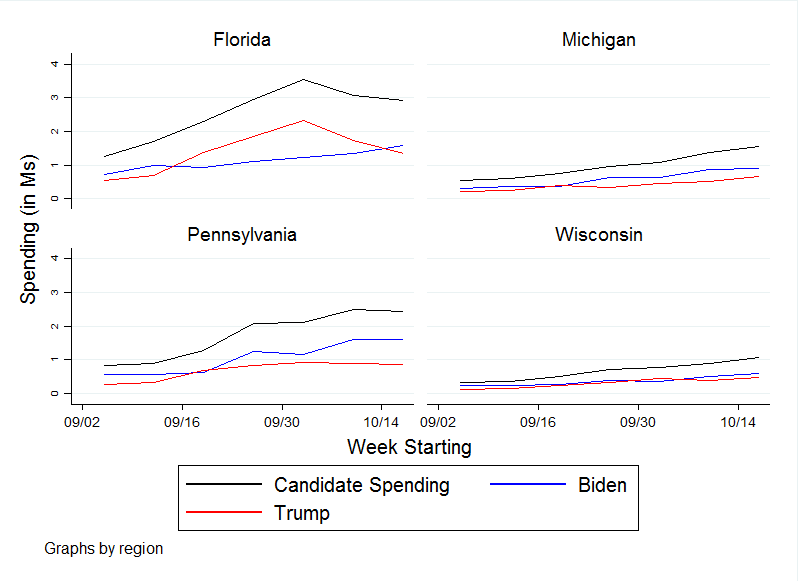
Digital spending figures come from the Facebook ad library reports. Spending covers September 4 to October 24, 2020. Candidate spending numbers include spending by official campaign committees, leadership PACs, and joint fundraising committees. See About the Data section at the end of this report for more information on our methodology along with the specific page names and disclaimers that are counted.
By and large, the Biden and Trump campaigns are targeting their Facebook ads in similar states (Figure 4), though it does appear that Biden is emphasizing Pennsylvania and Michigan more than the Trump campaign.
Figure 4: Regional Focus of Facebook Advertising by Top Sponsors Over Time
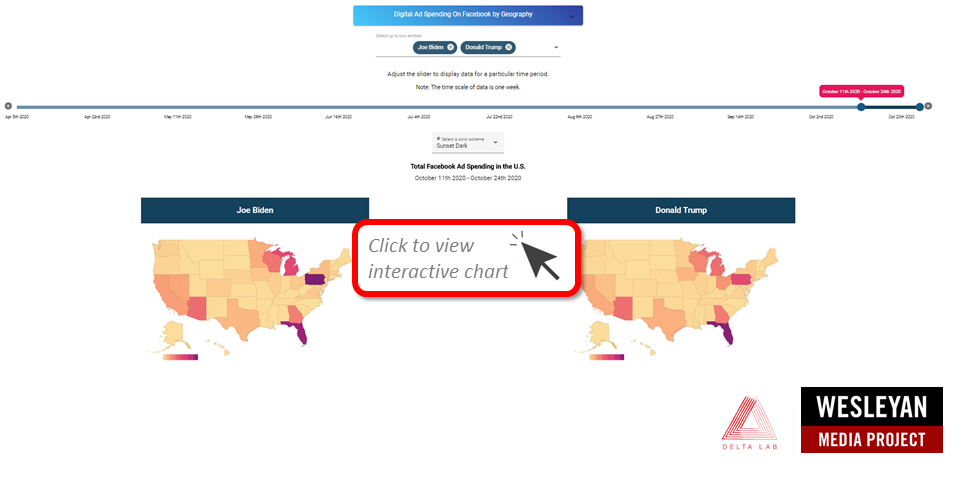
Digital spending comes from the Facebook ad library reports. Data visualization application by Delta Lab’s Roshaan Siddiqui ’22. Classifications from the Wesleyan Media Project with help from the Center for Responsive Politics.
Presidential campaign spending on Google has overtaken spending on Facebook the last few weeks (Figure 5). In the past week, spending on Facebook and Google is quite similar between the two campaigns, with Biden spending slightly more on Facebook and Trump spending slightly more on Google. Consistent with prior research showing that online ads are less likely to reference political opponents, Trump has mentioned Biden in roughly 22 percent of his spending on Facebook advertising, while Biden has mentioned Trump in nearly 36 percent of his Facebook spending.
Figure 5: Weekly Ad Advantage in the Presidential Race on Facebook and Google

Digital spending figures come from the Facebook ad library reports and the Google Transparency Report. Spending covers April 4 to October 24, 2020 for Facebook and Google. Candidate spending numbers include spending by official campaign committees, leadership PACs, and joint fundraising committees. See About the Data section at the end of this report for more information on our methodology along with the specific page names and disclaimers that are counted.
Pro-Trump Ads Attack While Pro-Biden Ads Contrast
Figure 6 looks at the tone of both pro-Biden and pro-Trump ads week-to-week, with the top panel showing the volume of promotional, contrast and attack ads and the bottom panel showing the percentages of each. By and large, pro-Biden ads are positive or contrast, with only about 10 percent being pure attacks. Pro-Trump ads, on the other hand, have seen a rising percentage of attacks since mid-September. In the past week, over 60 percent of pro-Trump ads were pure attacks, and fewer than 10 percent were positive.
Figure 6: Weekly Volume and Percentage of Presidential Airings by Tone
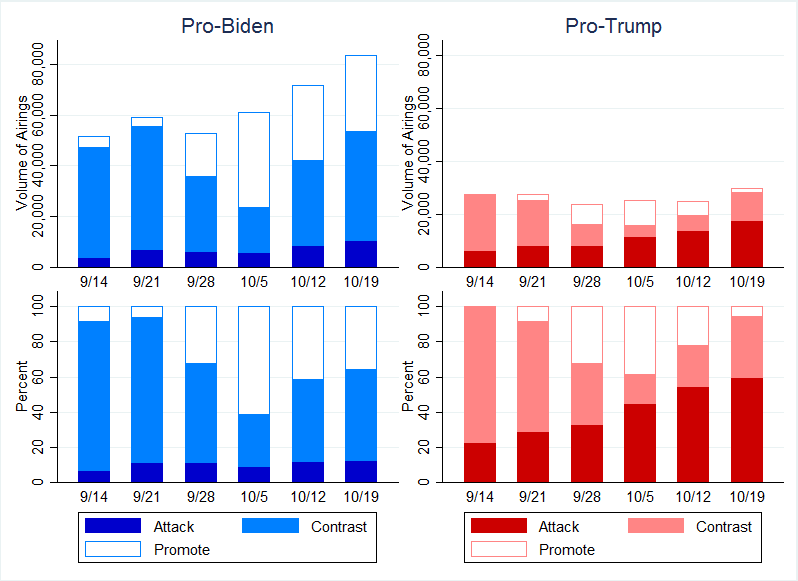
Numbers include ads aired on broadcast television and national cable between the week beginning September 14 and the week beginning October 19 (which ends October 25, 2020) for pro-Biden airings (left panel) and pro-Trump airings (right panel). Numbers include candidate, party, and group-sponsored ads.
CITE SOURCE OF DATA AS: Based on ongoing Wesleyan Media Project coding of Kantar/CMAG data, which is subject to change.
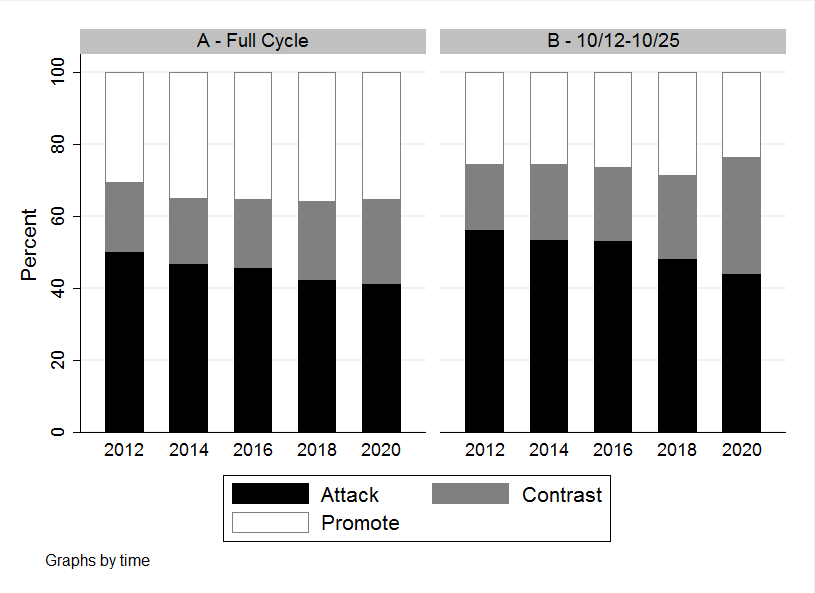
In spite of the rising number of attacks from pro-Trump ads, the campaign in 2020 is ending on a more positive note than the two previous presidential campaigns. A little over 20 percent of ads in the past two weeks were attacks, compared to over 60 percent in 2012 (Figure 7). And the percentage of positive ads in the past two weeks was a little over 30 percent, compared to less than 20 percent in the past two election cycles. Still contrast ads—those that both promote a favored candidate and attack an unfavored candidate—have been the most common in the past two weeks.
Figure 7: Tone of Advertising in Presidential Race (2012, 2016 and 2020)

Numbers include ads aired on broadcast television and national cable between April 9 and October 25 in each year (left panel) and between September 28 and October 11 in each year (right panel). Numbers include candidate, party, and group-sponsored ads.
CITE SOURCE OF DATA AS: Based on ongoing Wesleyan Media Project coding of Kantar/CMAG data, which is subject to change.
Trump Campaigns on Taxes, Biden on Health Care
As the campaign comes to a close, the candidates are making their final appeals to voters. Table 5 shows the top issue mentions of the candidates between October 12 and October 25. COVID-19 is not the top issue for either candidate, even with the recent surge in cases across parts of the country. The issue appears in 1 in every 3 Biden ads, and in 1 in every 5 Trump ads.
Biden has mentioned health care, jobs, and Social Security at a slightly higher rate in the last two weeks, while Trump has focused on taxes (in just under half of his airings), the economy, jobs, prescription drugs and health care.
Table 5: Issue Focus of Biden and Trump Ads
| Biden Issues | % Biden Airings | Trump Issues | % Trump Airings |
|---|---|---|---|
| Health Care | 39.70% | Taxes | 45.90% |
| Jobs | 37.60% | Economy | 37.00% |
| Social Security | 36.70% | Jobs | 36.30% |
| Infectious Diseases | 33.00% | Prescription Drugs | 32.80% |
| Taxes | 27.30% | Health Care | 31.90% |
| Economy | 26.20% | Business | 25.80% |
| Business | 25.50% | Energy Policy | 25.10% |
| Medicare | 24.10% | Infectious Diseases | 22.60% |
| Seniors (Not Medicare) | 23.30% | Seniors (Not Medicare) | 21.80% |
| Medical Bills | 19.60% | Social Security | 16.50% |
| Minimum Wage | 19.10% | Medicare | 16.50% |
| Prescription Drugs | 17.60% | Immigration | 15.90% |
| Tax Reform Bill/Tax Overhaul | 10.90% | Other | 11.70% |
| Education | 10.70% | Medical Bills | 11.70% |
| Poverty | 10.10% | Crime | 11.60% |
| Cost Of Living | 8.70% | China | 6.70% |
| Budget/Debt | 7.70% | Protests/Riots | 6.60% |
| Civil Rights/Racial Discrimination | 5.50% | Police Brutality/Racial Violence | 6.50% |
| Veterans | 5.00% | Poverty | 5.30% |
| Military | 3.90% | Veterans | 3.70% |
| Numbers include ads aired on broadcast television between October 12 and October 25, 2020. Totals refer only to candidate-sponsored ads. CITE SOURCE OF DATA AS: Based on ongoing Wesleyan Media Project coding of Kantar/CMAG data, which is subject to change. |
|||
South Carolina Top U.S. Senate Contests; Maine Bombarded by Outside Group Airings
The barnburner in South Carolina, in which Democrat Jaime Harrison is challenging incumbent Lindsey Graham, has seen the most ads of any Senate race over the past two weeks, with over 40,000 ad airings. Harrison holds a small lead in total ad airings over that same time period, 21,685 to 18,679 (Table 6).
The Senate race in Iowa between incumbent Republican Joni Ernst and Democratic challenger Theresa Greenfield actually saw more spending than the South Carolina race, with $34.6 million in ad spending. Independent groups have helped to boost that total, sponsoring 36 percent of the ad airings in the Iowa race. Georgia’s two Senate races have seen over 37,000 ad airings in the past two weeks, while the Montana and Texas Senate contests have each seen over 30,000 airings.
Outside groups have been particularly active in North Carolina and Maine, making up 44 and nearly 49 percent of airings respectively. In North Carolina, Senate Majority PAC and AFSCME have been on air supporting Democrat Cal Cunningham (with 2,170 and 2,932 airings compared to Cunningham’s 6,088) while American Crossroads and Senate Leadership Fund have each put up more airings than Republican Senator Thom Tillis himself over the last few weeks (3,248 and 3,457 airings compared to Tillis’ 3,190). Senate Majority PAC, the most active outside group in Maine, has aired 3,706 airings on behalf of Democratic challenger Sara Gideon (who aired 4,301 ads during the past few weeks). Meanwhile Senate Leadership Fund (1,867 airings) and 1820 PAC (645 airings) have led the list of pro-Republican organizations in addition to party sponsored advertising bolstering incumbent Republican Susan Collins whose campaign has aired 3,206 ads over the last few weeks.
Democrats led in ad airings over the past two weeks in all of the competitive races, though the Democratic lead was small in Arizona.
Table 6: Senate Ad Airings and Spending
| State | Airings | Spend ($) | Pro-Dem Airings | Pro-GOP Airings | % group |
|---|---|---|---|---|---|
| SC | 40,364 | $31,178,110 | 21,685 | 18,679 | 19.8% |
| GA | 37,670 | $22,448,020 | 21,890 | 15,779 | 27.2% |
| IA | 35,783 | $34,555,460 | 21,388 | 14,395 | 36.2% |
| MT | 32,439 | $18,536,980 | 18,997 | 13,442 | 29.1% |
| TX | 31,424 | $20,131,240 | 22,820 | 8,604 | 36.6% |
| NC | 27,090 | $22,033,470 | 15,632 | 11,458 | 43.8% |
| KY | 23,542 | $11,574,770 | 14,596 | 8,814 | 25.6% |
| AZ | 20,905 | $27,380,140 | 10,565 | 10,340 | 35.6% |
| MI | 19,225 | $27,029,240 | 10,601 | 8,624 | 39.2% |
| ME | 16,650 | $16,284,670 | 9,314 | 7,331 | 48.5% |
| KS | 16,150 | $10,894,720 | 9,661 | 6,489 | 32.5% |
| AL | 13,146 | $3,137,060 | 9,677 | 3,469 | 0.0% |
| CO | 11,108 | $6,798,880 | 5,664 | 5,444 | 27.2% |
| AK* | 10,081 | $3,977,610 | 5,357 | 4,724 | 45.9% |
| MS | 8,349 | $1,276,560 | 7,209 | 1,140 | 0.0% |
| NM | 4,757 | $3,444,080 | 2,980 | 1,777 | 3.5% |
| VA | 4,476 | $1,305,830 | 3,903 | 573 | 0.0% |
| LA | 3,903 | $801,170 | 1,441 | 2,462 | 4.3% |
| MN | 3,422 | $1,334,470 | 3,396 | 26 | 0.1% |
| OK | 2,810 | $661,550 | 593 | 2,217 | 0.0% |
| NH | 2,296 | $1,190,260 | 2,113 | 183 | 0.0% |
| IL | 1,876 | $1,516,800 | 1,656 | 0 | 0.0% |
| ID | 1,756 | $129,550 | 537 | 1,219 | 0.0% |
| WV | 1,665 | $243,570 | 0 | 1,665 | 0.0% |
| AR | 1,001 | $189,450 | 0 | 1,001 | 0.0% |
| SD | 846 | $102,120 | 165 | 681 | 0.0% |
| RI | 684 | $194,540 | 684 | 0 | 0.0% |
| TN | 298 | $69,050 | 0 | 298 | 0.0% |
| DE | 94 | $91,260 | 94 | 0 | 0.0% |
| Numbers include ads aired on broadcast television between October 12 and October 25, 2020. Numbers include candidate, party, and group-sponsored ads. *Numbers in the Democratic columns for the Alaska Senate race show airings and spending by and on behalf of Al Gross, the independent candidate in that race. CITE SOURCE OF DATA AS: Kantar/CMAG with analysis by the Wesleyan Media Project. |
|||||
Table 7 lists Senate candidates by their volume of spending on broadcast TV, Google, and Facebook, sorting by combined spending over the past two weeks. TV spending continues to dominate the landscape. Lindsey Graham, for example, has spent three-quarters of his money on television advertising ($12.6 million) and has spent another $4.5 million on Facebook and Google. Jaime Harrison ranks second in recent spending and has allocated his activity similarly with nearly $11 million on TV (73 percent) compared to $4.1 million on Facebook and Google. Among the top 25 spenders, the candidates with the highest proportion of digital spending in the past few weeks were Maine Democratic challenger Sara Gideon who is still spending 60 percent on TV and Republican Senate Majority Leader Mitch McConnell who is spending 63 percent on TV.
The cycle-to-date figures tell a similar story. Lindsey Graham has spent over $11 million on Facebook and Google in the full election cycle, along with about $25 million on television ads (70 percent). Cory Gardner in Colorado has devoted nearly all of his media spending to television (92 percent) compared to 61 percent for Democrat Amy McGrath in Kentucky.
Table 7: Digital and TV Ad Spending by U.S. Senate Candidates
| State | Party | Candidate | FB+Google $ (since Jan 2019) | TV $ (since Jan 2019) | % TV (since Jan 2019) | FB+Google $ (since Oct 11) | TV $ (since Oct 12) | % TV (since mid Oct) | ** |
|---|---|---|---|---|---|---|---|---|---|
| SC | REP | Graham, Lindsey O. | 11,131,533 | 24,660,740 | 69% | 4,465,071 | 12,639,600 | 74% | 1 |
| SC | DEM | Harrison, Jaime | 17,023,688 | 40,243,450 | 70% | 4,114,621 | 10,982,300 | 73% | 2 |
| AZ | DEM | Kelly, Mark | 9,305,946 | 32,681,630 | 78% | 1,684,322 | 9,554,410 | 85% | 3 |
| GA | DEM | Ossoff, T. Jonathan | 4,640,830 | 16,312,720 | 78% | 1,860,980 | 5,724,350 | 75% | 4 |
| AZ | REP | McSally, Martha | 3,735,649 | 17,409,600 | 82% | 1,036,424 | 5,385,280 | 84% | 5 |
| IA | DEM | Greenfield, Theresa | 4,321,109 | 15,953,160 | 79% | 1,735,383 | 3,848,240 | 69% | 6 |
| KY | DEM | McGrath, Amy | 11,742,532 | 18,598,140 | 61% | 1,792,509 | 3,604,730 | 67% | 7 |
| MI | DEM | Peters, Gary | 3,560,052 | 14,231,600 | 80% | 1,389,839 | 3,885,200 | 74% | 8 |
| MI | REP | James, John | 639,528 | 15,022,710 | 96% | 146,069 | 4,437,430 | 97% | 9 |
| GA | DEM | Warnock, Raphael | 3,067,309 | 8,604,940 | 74% | 1,035,592 | 3,333,180 | 76% | 10 |
| TX | DEM | Hegar, Mary Jennings MJ | 879,716 | 10,346,190 | 92% | 280,930 | 3,775,130 | 93% | 11 |
| TX | REP | Cornyn, John Sen | 2,634,134 | 8,360,950 | 76% | 595,188 | 2,914,760 | 83% | 12 |
| KY | REP | McConnell, Mitch | 7,213,462 | 11,127,800 | 61% | 1,234,387 | 2,124,700 | 63% | 13 |
| KS | DEM | Bollier, Barbara | 1,762,899 | 7,118,390 | 80% | 590,441 | 2,552,690 | 81% | 14 |
| CO | DEM | Hickenlooper, John W. | 3,752,434 | 12,102,890 | 76% | 752,143 | 2,378,930 | 76% | 15 |
| ME | DEM | Gideon, Sara | 7,125,839 | 11,441,080 | 62% | 1,231,018 | 1,875,740 | 60% | 16 |
| MT | REP | Daines, Steven | 4,576,251 | 9,305,680 | 67% | 714,023 | 2,059,740 | 74% | 17 |
| AL | DEM | Jones, Doug | 1,262,631 | 9,587,280 | 88% | 250,257 | 2,435,540 | 91% | 18 |
| CO | REP | Gardner, Cory | 882,230 | 10,600,720 | 92% | 155,109 | 2,412,130 | 94% | 19 |
| IA | REP | Ernst, Joni K | 1,771,255 | 6,228,540 | 78% | 223,757 | 2,163,170 | 91% | 20 |
| NC | REP | Tillis, Thom R. Sen. | 853,152 | 6,404,850 | 88% | 301,079 | 2,016,120 | 87% | 21 |
| NC | DEM | Cunningham, Cal | 2,172,746 | 14,125,720 | 87% | 140,816 | 2,108,970 | 94% | 22 |
| GA | REP | Perdue, David | 349,871 | 6,805,280 | 95% | 57,696 | 2,129,560 | 97% | 23 |
| ME | REP | Collins, Susan M. | 1,771,927 | 8,780,740 | 83% | 578,699 | 1,561,360 | 73% | 24 |
| NM | REP | Ronchetti, Mark V. | 77,278 | 3,333,690 | 98% | 22,691 | 2,094,870 | 99% | 25 |
| **Use final column to return to original table sort (by combined TV + Digital since mid October). Digital spending figures come from the Facebook ad library reports and the Google Transparency Report. Spending covers January 6, 2019 or October 11, 2020 to October 24, 2020 (for Facebook); January 6, 2019 or October 11, 2020 to October 24, 2020 (for Google); January 1, 2019 or October 12, 2020 to October 25, 2020 (for TV). Candidate spending numbers include spending by official campaign committees, leadership PACs, and joint fundraising committees. See About the Data section at the end of this report for more information on our methodology along with the specific page names and disclaimers that are counted. Click here to download a spreadsheet showing all candidates. | |||||||||
Fewer Attack Ads in Senate Races Than Past Years
Figure 8 shows the tone of advertising in Senate races, both the full cycle to October 25 in the last five election cycles and in the October 12 to October 25 period. In Senate races cycle-to-date, political ads are more positive and less negative than most of the previous four elections (the 2018 cycle was only a fraction more positive than 2020). Negative ads account for about 40 percent of all ads (slightly higher in the recent two-week period), which is down from about 50 percent in 2012. Looking at the past two weeks, however, the proportion of purely promotional ads is the lowest that it has been in the past five cycles.
Figure 8: Tone of Advertising in U.S. Senate Races (2012 to 2020)
Numbers include ads aired on broadcast television and national cable between January 1 of the off year and October 25 of the election year in each cycle (left panel) and between October 12 and October 25 of the election year in each year (right panel). Numbers include candidate, party, and group-sponsored ads.
CITE SOURCE OF DATA AS: Based on ongoing Wesleyan Media Project coding of Kantar/CMAG data, which is subject to change.
“Even though the proportion of pure attacks is lower than prior cycles, the vast increase in volume of activity means it is more likely that citizens all over the country are seeing campaign ads on TV and more ads containing attacks,” said Erika Franklin Fowler, co-director of the Wesleyan Media Project. “More than any other year in the decade that we’ve been tracking, citizens will have a hard time escaping election ads on television and online.”
Republican Senate ads are more negative than Democratic Senate ads, as seen in Figure 9, which looks at week-to-week spending this cycle back to mid-September. Democrats have clear and heavy ad volume advantages in every week but have generally focused disproportionately more on positive and contrast ads than Republicans, who have focused more on pure attacks in most weeks.
Figure 9: Percentage of Negative (Attack or Contrast) Ad Airings in U.S. Senate Races by Week
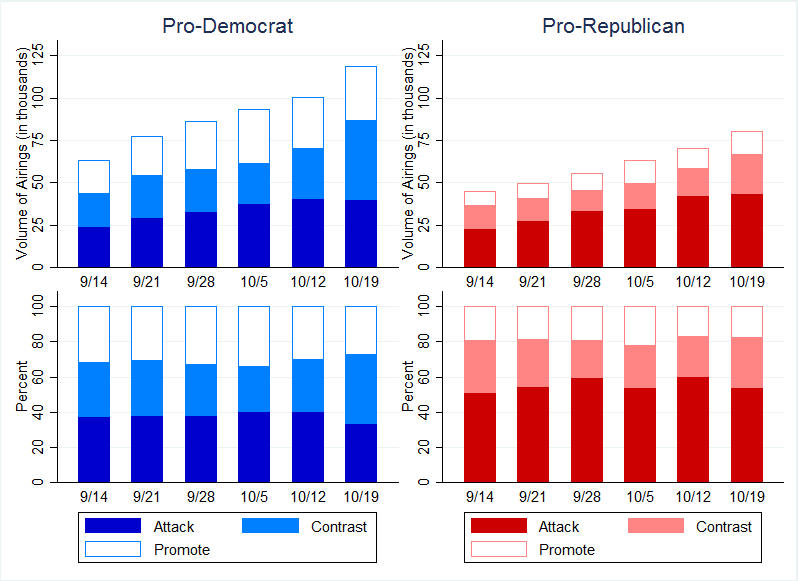
Numbers include weekly proportion of ads aired on broadcast television and national cable between the week beginning September 14 and the week beginning October 19 (which ends October 25, 2020). Numbers include candidate, party, and group-sponsored ads.
CITE SOURCE OF DATA AS: Based on ongoing Wesleyan Media Project coding of Kantar/CMAG data, which is subject to change.
The most negative Senate race in recent weeks has been in North Carolina, where 77 percent of ads were pure attacks (Table 8). Indeed, all of the ads aired by incumbent Thom Tillis were negative. Kansas’s Senate race has also been extremely negative, with two in three ads being attacks. Montana’s Senate race has been particularly negative as well.
Table 8: Most Negative U.S. Senate Races (Pure Attack Only)
| State | Airings | % Negative | % Positive | Dem Cand % Neg | Rep Cand % neg |
|---|---|---|---|---|---|
| NC | 27,090 | 76.9% | 4.7% | 0.0% | 100.0% |
| KS | 16,150 | 66.7% | 14.8% | 26.0% | 92.6% |
| MT | 32,439 | 61.7% | 18.4% | 28.9% | 43.1% |
| ME | 16,650 | 58.4% | 19.9% | 24.2% | 12.5% |
| AK* | 10,081 | 58.2% | 4.5% | 0.0% | 21.0% |
| CO | 11,108 | 54.6% | 32.1% | 30.8% | 55.4% |
| AZ | 20,905 | 50.3% | 21.0% | 0.0% | 35.3% |
| NM | 4757 | 48.3% | 28.9% | 47.8% | 43.9% |
| IA | 35,783 | 46.7% | 19.0% | 0.0% | 7.5% |
| OK | 2810 | 45.3% | 11.5% | 0.0% | 57.4% |
| MI | 19,225 | 43.0% | 43.0% | 0.0% | 0.0% |
| KY | 23,542 | 41.7% | 24.6% | 8.2% | 84.1% |
| SC | 40,364 | 40.2% | 17.7% | 27.5% | 31.9% |
| GA | 37,670 | 30.2% | 35.5% | 16.2% | 25.8% |
| TX | 31,424 | 29.9% | 9.0% | 0.0% | 71.1% |
| MS | 8349 | 24.9% | 30.2% | 28.9% | 0.0% |
| AL | 13,146 | 23.0% | 24.7% | 21.9% | 26.0% |
| VA | 4476 | 4.4% | 62.7% | 0.0% | 34.6% |
| LA | 3903 | 2.8% | 77.3% | 7.5% | 0.0% |
| MN | 3422 | 0.1% | 99.2% | 0.0% | 0.0% |
| NH | 2296 | 0.0% | 36.7% | 0.0% | 0.0% |
| IL | 1876 | 0.0% | 92.7% | 0.0% | |
| ID | 1756 | 0.0% | 69.4% | 0.0% | 0.0% |
| WV | 1665 | 0.0% | 100.0% | 0.0% | |
| AR | 1001 | 0.0% | 100.0% | 0.0% | |
| SD | 846 | 0.0% | 100.0% | 0.0% | 0.0% |
| RI | 684 | 0.0% | 100.0% | 0.0% | |
| TN | 298 | 0.0% | 100.0% | 0.0% | |
| DE | 94 | 0.0% | 100.0% | 0.0% | |
| Numbers include ads aired on broadcast television between October 12 and October 25, 2020. Totals in last two columns refer only to candidate-sponsored ads. *Numbers in the Democratic candidate column for the Alaska Senate race show airings by Al Gross, the independent candidate in that race. CITE SOURCE OF DATA AS: Based on ongoing Wesleyan Media Project coding of Kantar/CMAG data, which is subject to change. |
|||||
Health Care Top Issue for Both Parties’ Senate Ads
Both Democratic and Republican Senate campaigns have focused their advertising on health care, a sign of just how important the issue is this cycle (Table 9). The issue appears in 44 percent of pro-Democratic Senate ads and in 33 percent of Republican Senate ads. Other top issues for Democrats are business and infectious disease (COVID-19), while Republicans have focused on taxes and jobs followed by police and the Supreme Court. COVID-19 has appeared in only 10 percent of pro-Republican ads in the last two weeks.
Table 9: Issue Focus of U.S. Senate Contests by Party
| Pro-Dem Issues | % of Airings | Pro-Rep Issues | % of Airings |
|---|---|---|---|
| Health Care | 44.00% | Health Care | 33.40% |
| Business | 33.40% | Taxes | 30.70% |
| Infectious Diseases | 24.60% | Jobs | 17.00% |
| Camp Finance Reform | 20.30% | Police Brutality/Racial Violence | 12.80% |
| Other | 18.40% | Supreme Court/Judiciary | 12.60% |
| Prescription Drugs | 15.10% | Business | 12.20% |
| Jobs | 13.80% | Military | 11.30% |
| Veterans | 11.70% | Immigration | 10.90% |
| Military | 10.90% | Infectious Diseases | 10.60% |
| Taxes | 10.10% | Veterans | 9.50% |
| Medicare | 9.80% | Government Ethics/Scandal | 9.30% |
| Social Security | 9.20% | Energy Policy | 9.10% |
| Emergency Prep/Response | 6.70% | Gun Control/Guns | 8.90% |
| Medical Bills | 6.30% | Camp Fin Reform | 8.90% |
| Supreme Court/Judiciary | 5.40% | Abortion | 7.90% |
| Afghanistan | 5.30% | Economy (Generic) | 7.10% |
| Police Brutality/Racial Violence | 4.90% | Domestic Violence/Sexual Assault/ Harassment | 6.10% |
| Moral/Family/Religious Values | 4.70% | Medicare | 5.50% |
| Government Spending | 4.60% | Emergency Prep/Response | 4.90% |
| Numbers include ads aired on broadcast television between October 12 and October 25, 2020. Numbers include candidate, party, and group-sponsored ads. CITE SOURCE OF DATA AS: Based on ongoing Wesleyan Media Project coding of Kantar/CMAG data, which is subject to change. |
|||
Trump Mentioned Positively in WV, AL Senate Races
President Trump has been featured in Senate ads in several states during the past two weeks, sometimes positively and sometimes negatively (Table 10). Trump has been mentioned in 73 percent of Senate ads in West Virginia—all positive mentions from the Republican candidate. Trump has been mentioned positively in 38 percent of Senate ads in Alabama, and again, all mentions were positive. Both Democrat Doug Jones and Republican Tommy Tuberville have touted their support for Trump. In Illinois and New Mexico, by contrast, all mentions of Trump in the past two weeks (in both races from Democratic candidates) were negative.
Table 10: Trump Mentions in Senate Races
| State | % Trump Mention | Pos Trump Mention | Neg Trump Mention |
|---|---|---|---|
| WV | 73.1% | 73.1% | 0.0% |
| AL | 43.0% | 43.0% | 0.0% |
| IL | 38.2% | 0.0% | 38.2% |
| NM | 29.9% | 0.0% | 29.9% |
| MS | 13.7% | 13.7% | 0.0% |
| GA | 12.2% | 12.2% | 0.0% |
| ME | 11.9% | 0.0% | 11.9% |
| MI | 11.3% | 0.0% | 11.3% |
| SC | 5.1% | 0.2% | 4.9% |
| CO | 4.4% | 1.5% | 2.9% |
| TX | 2.8% | 0.0% | 2.8% |
| AZ | 2.7% | 0.0% | 2.7% |
| KY | 0.7% | 0.2% | 0.5% |
| MT | 0.0% | 0.0% | 0.0% |
| NC | 0.0% | 0.0% | 0.0% |
| AK | 0.0% | 0.0% | 0.0% |
| AR | 0.0% | 0.0% | 0.0% |
| DE | 0.0% | 0.0% | 0.0% |
| IA | 0.0% | 0.0% | 0.0% |
| ID | 0.0% | 0.0% | 0.0% |
| KS | 0.0% | 0.0% | 0.0% |
| LA | 0.0% | 0.0% | 0.0% |
| MN | 0.0% | 0.0% | 0.0% |
| NH | 0.0% | 0.0% | 0.0% |
| OK | 0.0% | 0.0% | 0.0% |
| RI | 0.0% | 0.0% | 0.0% |
| SD | 0.0% | 0.0% | 0.0% |
| TN | 0.0% | 0.0% | 0.0% |
| VA | 0.0% | 0.0% | 0.0% |
| Numbers include ads aired on broadcast television between October 12 and October 25, 2020. Numbers include candidate, party, and group-sponsored ads. CITE SOURCE OF DATA AS: Based on ongoing Wesleyan Media Project coding of Kantar/CMAG data, which is subject to change. |
|||
CA-22 and NM-2 Top House Races on TV
Several U.S. House races are seeing a barrage of advertising as Election Day approaches, as Table 11 shows. The race for California’s 21st congressional district between Democrat TJ Cox and Republican David Valadao has seen 13,825 ads in the past two weeks, costing $4.9 million. New Mexico’s 2nd congressional district race, a rematch between Democrat Xochitl Torres Small and Republican Yvette Herrell, has seen 13,686 airings in the past two weeks at a cost of $5.7 million.
Table 11: House TV Ad Airings and Spending (Since October 12)
| Race | Airings | Spend ($) | Pro-Dem Airings | Pro-GOP Airings | % Group |
|---|---|---|---|---|---|
| CA21 | 13,825 | $4,896,260 | 7564 | 6261 | 20.3% |
| NM02 | 13,686 | $5,703,750 | 9090 | 4596 | 39.8% |
| NY22 | 9,777 | $4,508,550 | 6179 | 3598 | 43.2% |
| VA05 | 9,187 | $2,300,860 | 7063 | 2124 | 41.7% |
| UT04 | 8,130 | $3,376,290 | 4974 | 3156 | 38.9% |
| MT01 | 7,734 | $2,491,530 | 4949 | 2785 | 14.7% |
| TX23 | 7,142 | $3,720,920 | 4889 | 2253 | 19.0% |
| CO03 | 7,103 | $2,735,750 | 3717 | 3386 | 26.1% |
| IN05 | 7,026 | $3,312,140 | 4167 | 2859 | 42.9% |
| IL13 | 7,025 | $4,448,640 | 3969 | 3056 | 36.9% |
| OR04 | 6,997 | $1,770,390 | 5256 | 1741 | 18.3% |
| OK05 | 6,475 | $4,092,140 | 3872 | 2603 | 33.6% |
| MN07 | 6,421 | $4,346,200 | 4156 | 2265 | 38.8% |
| TX21 | 6,377 | $4,258,900 | 4242 | 2135 | 38.7% |
| NY24 | 5,430 | $2,796,830 | 3438 | 1992 | 18.9% |
| VA07 | 5,343 | $2,461,110 | 3629 | 1714 | 26.4% |
| IA02 | 5,193 | $3,985,870 | 2899 | 2294 | 48.7% |
| AR02 | 4,707 | $2,023,470 | 2986 | 1721 | 43.5% |
| MO02 | 4,568 | $5,109,930 | 2892 | 1676 | 40.1% |
| SC01 | 4,561 | $2,038,470 | 2723 | 1838 | 40.3% |
| NY01 | 4,403 | $3,884,690 | 3743 | 660 | 16.4% |
| AK01* | 4,203 | $1,389,830 | 2736 | 1467 | 15.7% |
| NE02 | 3,982 | $3,032,720 | 1966 | 2016 | 30.1% |
| FL26 | 3,894 | $6,335,650 | 2024 | 1870 | 39.9% |
| WA03 | 3,854 | $2,854,540 | 1552 | 2302 | 10.7% |
| Numbers include ads aired on broadcast television between October 12 and October 25, 2020. Numbers include candidate, party, and group-sponsored ads. CITE SOURCE OF DATA AS: Kantar/CMAG with analysis by the Wesleyan Media Project. *Numbers in the Democratic columns for the Alaska House race show airings and spending by Alyse Galvin, the independent candidate in that race. Click here to download a spreadsheet showing all candidates. |
|||||
Top Spending House Candidates in NY and TX
New York’s 21st district U.S. House contest between Republican Elise Stefanik and Democrat Tedra Cobb has seen the most ad spending by candidates (combining TV, Facebook and Google) over the past few weeks ($1.7 million has been spent by Stefanik, who ranks first among all House candidates, compared to $1.4 million for Cobb, who ranks fourth). Democrat Wendy Davis (TX-21) and Republican Daniel Crenshaw (TX-2) rank second and third in spending (at $1.6 million and $1.5 million respectively). Television spending dominates ad activity in all of these top races.
Table 12: Digital and TV Ad Spending by U.S. House Candidates
| State | Dist. | Party | Candidate | FB+Google (Since Jan 2019) | TV (since Jan 2019) | % TV cycle | FB+Google (since Oct 11) | TV (since Oct 12) | % TV since early Oct. | ** |
|---|---|---|---|---|---|---|---|---|---|---|
| NY | 21 | REP | Stefanik, Elise M. | 744,592 | 3,493,070 | 82% | 78,593 | 1,662,660 | 95% | 1 |
| TX | 21 | DEM | Davis, Wendy | 894,569 | 3,805,930 | 81% | 287,048 | 1,329,180 | 82% | 2 |
| TX | 2 | REP | Crenshaw, Daniel | 227,823 | 2,797,540 | 92% | 67,628 | 1,478,650 | 96% | 3 |
| NY | 21 | DEM | Cobb, Tedra | 228,544 | 3,766,570 | 94% | 34,958 | 1,437,160 | 98% | 4 |
| CA | 50 | REP | Issa, Darrell | 165,731 | 3,235,500 | 95% | 19,259 | 1,338,730 | 99% | 5 |
| NJ | 7 | DEM | Malinowski, Tom | 195,249 | 1,125,180 | 85% | 35,735 | 1,125,180 | 97% | 6 |
| TX | 32 | DEM | Allred, Colin | 169,773 | 2,662,950 | 94% | 82,597 | 1,063,470 | 93% | 7 |
| NY | 19 | DEM | Delgado, Antonio | 33,177 | 1,651,970 | 98% | 7,199 | 1,060,230 | 99% | 8 |
| MI | 11 | DEM | Stevens, Haley | 238,768 | 2,454,020 | 91% | 71,282 | 985,820 | 93% | 9 |
| OR | 4 | DEM | Defazio, Peter A | 186,044 | 1,429,530 | 88% | 78,555 | 923,940 | 92% | 10 |
| MI | 8 | DEM | Slotkin, Elissa | 177,709 | 3,353,250 | 95% | 23,342 | 971,750 | 98% | 11 |
| MI | 3 | DEM | Scholten, Hillary | 231,500 | 1,670,510 | 88% | 86,261 | 899,420 | 91% | 12 |
| VA | 7 | DEM | Spanberger, Abigail | 412,168 | 2,608,140 | 86% | 150,094 | 817,060 | 84% | 13 |
| NM | 2 | DEM | Torres Small, Xochitl | 224,091 | 3,147,790 | 93% | 73,779 | 891,130 | 92% | 14 |
| GA | 6 | DEM | McBath, Lucia Kay Ms. | 81,000 | 3,977,150 | 98% | 52,000 | 899,310 | 95% | 15 |
| MN | 2 | DEM | Craig, Angela Dawn | 185,317 | 1,908,950 | 91% | 59,635 | 880,630 | 94% | 16 |
| CA | 48 | DEM | Rouda, Harley E Jr | 360,828 | 1,585,390 | 81% | 117,035 | 751,690 | 87% | 17 |
| AZ | 1 | DEM | O'Halleran, Tom | 15,089 | 860,720 | 98% | 1,862 | 860,720 | 100% | 18 |
| NY | 11 | DEM | Rose, Max | 542,795 | 1,011,200 | 65% | 153,081 | 672,370 | 81% | 19 |
| IL | 6 | DEM | Casten, Sean | 268,956 | 1,606,700 | 86% | 101,742 | 687,430 | 87% | 20 |
| IA | 3 | DEM | Axne, Cindy | 226,746 | 2,178,710 | 91% | 90,500 | 698,370 | 89% | 21 |
| NV | 3 | DEM | Lee, Susie | 153,032 | 1,584,480 | 91% | 46,152 | 740,290 | 94% | 22 |
| IL | 17 | DEM | Bustos, Cheri | 99,633 | 1,260,830 | 93% | 78,169 | 700,640 | 90% | 23 |
| MO | 2 | DEM | Schupp, Jill Darlyne | 220,852 | 2,099,810 | 90% | 53,025 | 718,870 | 93% | 24 |
| TX | 7 | REP | Hunt, Wesley | 89,900 | 2,568,970 | 97% | 26,600 | 712,200 | 96% | 25 |
| **Use final column to return to original table sort (by combined TV + Digital since mid October. Digital spending figures come from the Facebook ad library reports and the Google Transparency Report. Spending covers January 6, 2019 or October 11, 2020 to October 24, 2020 (for Facebook); January 6, 2019 or October 11, 2020 to October 24, 2020 (for Google); January 1, 2019 or October 12, 2020 to October 25, 2020 (for TV). Candidate spending numbers include spending by official campaign committees, leadership PACs, and joint fundraising committees. See About the Data section at the end of this report for more information on our methodology along with the specific page names and disclaimers that are counted. Click here to download a spreadsheet showing all candidates. |
||||||||||
Impeachment References Relatively Rare
References to the impeachment of President Trump in U.S. House races have not featured prominently in advertising this cycle. When they do occur, they are more likely to be mentioned in pro-Republican advertising. Prior to Labor Day, 11 percent of pro-Republican ads referenced impeachment in some way overall, but that proportion dropped precipitously to fewer than 2 percent of pro-Republican ads in the post-Labor Day period.
Looking at specific races in the post-Labor Day period, the vast majority of impeachment mentions have come from New York’s district 22 where 44 percent of the airings (4,379) have mentioned the topic. All of the airings attack Democratic incumbent Anthony Brindisi for voting in favor of impeachment and are sponsored by Congressional Leadership Fund, the NRCC and the Republican challenger Claudia Tenney herself.
Two Oklahoma districts – the second and the fifth – referenced impeachment. All of the pro-Republican airings in Oklahoma’s second district referenced impeachment, but there were only 158 airings, which came from incumbent Republican Markwayne Mullin touting his defense of Trump against Pelosi. Seventy-four airings (only one percent of pro-Republican airings) sponsored by Congressional Leadership Fund in the fifth district attacked Democratic incumbent Kendra Horn for wasting critical months on impeachment.
Pro-Republican airings in New Mexico’s 2nd district had 604 airings (5 percent) on the topic. Forty five percent came from Congressional Leadership Fund and the remainder from Republican challenger Yvette Herrell.
Republican challenger Jim Bognet in Pennsylvania’s 8th also attacked Democratic incumbent Matt Cartwright’s impeachment vote, but the airings constituted a very small number of the pro-Republican total (3 percent).
The only pro-Democratic airings to mention impeachment in U.S. House ads came from Minnesota’s district 7 (696 airings, making up 7.7 percent) where incumbent Collin Peterson touted his sole Democratic vote against impeachment.
Top Two Outside Groups Combine for Over $260 million
Table 13 lists outside group spending, both on television and on digital. Senate Majority PAC, the Democratic group, has spent almost $128 million television and digital advertising this election cycle, with $40.7 million of that coming in the past two weeks. The Republican group, Senate Leadership Fund, has spent a similar amount on advertising this cycle, about $127 million, with $47 million of that in the past two weeks. The largest spender in the past two weeks, however, was FF PAC, a pro-Biden hybrid PAC that has spent over $52 million on ads in just the past two weeks.
Most groups on this list have spent the vast majority of their money on TV ads, though notably Priorities USA Action committed over one-third of their $61 million on ads to digital. The Lincoln Project has spent over $18 million this cycle on ads, with over half the total devoted to Facebook and Google ads.
One group that used to be active on television, Americans for Prosperity and its related arms (Americans for Prosperity Action and Americans for Prosperity Foundation), have collectively spent $5.4 million on Facebook and another $2.8 million on Google cycle-to-date, but notably has been absent from television.
Table 13: Top Outside Group Spenders Since October 12 and Full Cycle
| Group | FB+Google (Since Jan 2019) | TV (Since Jan 2019) | % TV Cycle | FB+Google (Since Oct 11) | TV (Since Oct 12) | % TV (Since Early Oct) | ** |
|---|---|---|---|---|---|---|---|
| Senate Majority PAC | 7,695,740 | 121,148,460 | 94% | 3,308,431 | 40,743,350 | 92% | 1 |
| Senate Leadership Fund | 6,965,856 | 120,956,810 | 95% | 3,418,143 | 47,076,680 | 93% | 2 |
| FF PAC | 287,700 | 73,396,630 | 100% | 287,700 | 52,370,180 | 99% | 3 |
| Congressional Leadership Fund | 4,141,374 | 66,922,730 | 94% | 1,753,103 | 35,247,590 | 95% | 4 |
| Preserve America PAC | 5,866,002 | 57,830,870 | 91% | 2,035,828 | 14,488,180 | 88% | 5 |
| America First Action | 10,099,386 | 55,644,680 | 85% | 3,710,731 | 15,509,140 | 81% | 6 |
| House Majority PAC | 5,010,632 | 54,826,420 | 92% | 1,794,724 | 35,152,560 | 95% | 7 |
| Priorities USA Action | 23,746,222 | 40,574,630 | 63% | 3,088,249 | 4,662,790 | 60% | 8 |
| One Nation | 3,110,024 | 36,839,650 | 92% | 529,272 | 0 | 0% | 9 |
| AB PAC | 1,499,152 | 26,937,370 | 95% | 227,580 | 5,214,900 | 96% | 10 |
| Club For Growth Action | 2,505,776 | 23,206,660 | 90% | 489,743 | 2,769,420 | 85% | 11 |
| Independence Usa PAC | 1,708,141 | 21,981,170 | 93% | 1,325,440 | 12,533,770 | 90% | 12 |
| Majority Forward | 2,204,138 | 21,908,730 | 91% | 943,029 | 0 | 0% | 13 |
| Doctor Patient Unity | 803,226 | 21,524,640 | 96% | 0 | 0 | - | 14 |
| Duty And Honor | 606,343 | 19,671,470 | 97% | 0 | 0 | - | 15 |
| American Crossroads | 0 | 13,496,540 | 100% | 0 | 2,833,850 | 100% | 16 |
| Women Vote | 3,091,105 | 12,752,360 | 80% | 1,551,268 | 1,894,180 | 55% | 17 |
| Unite the Country | 2,625,086 | 12,625,950 | 83% | 426,610 | 2,278,990 | 84% | 18 |
| Plains PAC | 32,670 | 11,287,910 | 100% | 0 | 4,376,200 | 100% | 19 |
| Restoration PAC | 1,114,943 | 11,149,790 | 91% | 99,003 | 2,894,460 | 97% | 20 |
| Votevets | 669,876 | 10,497,820 | 94% | 77,868 | 419,700 | 84% | 21 |
| Persist PAC | 347,718 | 9,622,250 | 97% | 0 | 0 | - | 22 |
| Defend AZ | 208,696 | 9,425,410 | 98% | 46,932 | 3,050,700 | 98% | 23 |
| House Majority Forward | 301,650 | 8,608,830 | 97% | 0 | 72,890 | 100% | 24 |
| Everytown For Gun Safety Victory Fund | 1,556,255 | 8,574,430 | 85% | 665,212 | 735,720 | 53% | 25 |
| The Lincoln Project | 9,098,488 | 8,411,750 | 48% | 2,873,528 | 717,970 | 20% | 26 |
| American Action Network | 1,831,158 | 7,699,440 | 81% | 0 | 0 | - | 27 |
| 1820 PAC | 151,030 | 7,196,740 | 98% | 0 | 1,374,480 | 100% | 28 |
| Keep Kentucky Great | 575,486 | 6,832,160 | 92% | 309,291 | 2,173,690 | 88% | 29 |
| LCV Victory Fund | 2,440,733 | 6,243,620 | 72% | 315,983 | 1,174,490 | 79% | 30 |
| **Use final column to return to original table sort (by combined TV + digital since mid October). Table shows television, Facebook and Google spending for the top group spenders on television. For TV, numbers include ads aired on broadcast television and national cable between October 12 and October 25, 2020. Facebook and Google ads are between October 11 and October 24, 2020. See About the Data section at the end of this report for more information on our methodology along with the specific page names and disclaimers (Facebook) and advertiser IDs (Google) that are counted. CITE SOURCE OF DATA AS: Kantar/CMAG, Facebook Ad Library and Google Transparency Report with analysis by the Wesleyan Media Project. |
|||||||
Dark Money Activity Before and After the FEC Reporting Window
Table 14 shows the top dark money groups (those that do not publicly disclose their donors) in federal elections this cycle. The table includes both television and digital spending both before and after the 60-day “window,” which is when outside groups that mention a candidate must report all television ad spending to the Federal Election Commission. In many instances, the groups that spent heavily before the window, such as One Nation and Majority Forward, ceased their spending on TV when the 60-day window arrived but did continue to spend on digital.
Table 14: Top Dark Money Groups
| Group | TV before 60-day cutoff (Sept 4) | TV within 60-days | FB +Google before 60-day cutoff (Sept 4) | FB + Google within 60-days | Group Type | Party Lean | TV % before 60-days | FB + Google % before 60-days | ** |
|---|---|---|---|---|---|---|---|---|---|
| One Nation | $36,800,000 | $0 | $2,301,661 | $808,363 | 501c4 | Rep | 100.0% | 74.0% | 1 |
| Majority Forward | $21,900,000 | $0 | $1,009,903 | $1,194,235 | 501c4 | Dem | 100.0% | 45.8% | 2 |
| Doctor Patient Unity | $21,500,000 | $0 | $803,226 | $0 | 501c4 | Rep | 100.0% | 100.0% | 3 |
| Duty and Honor | $19,700,000 | $0 | $606,343 | $0 | 501c4 | Dem | 100.0% | 100.0% | 4 |
| House Majority Forward | $8,535,940 | $72,890 | $301,650 | $0 | 501c4 | Dem | 99.2% | 100.0% | 5 |
| American Action Network | $7,699,440 | $0 | $1,831,158 | $0 | 501c4 | Rep | 100.0% | 100.0% | 6 |
| U.S. Chamber Of Commerce | $4,632,880 | $891,180 | $1,516,504 | $78,886 | 501c4 | Rep | 83.9% | 95.1% | 7 |
| NRA Victory Fund, Inc. | $2,756,820 | $2,702,840 | $48,853 | $3,068,124 | superPAC | Rep | 50.5% | 1.6% | 8 |
| VoteVets Action Fund | $4,808,060 | $0 | $836,686 | $19,279 | 501c4 | Dem | 100.0% | 97.7% | 9 |
| America First Policies, Inc. | $3,130,090 | $5,940 | $1,663,415 | $933,487 | 501c4 | Rep | 99.8% | 64.1% | 10 |
| Advancing AZ | $2,962,270 | $0 | $699,458 | $0 | 501c4 | Dem | 100.0% | 100.0% | 11 |
| Unite for Colorado | $2,810,030 | $0 | $534,497 | $378,858 | 501c4 | Rep | 100.0% | 58.5% | 12 |
| Americans for Limited Government | $2,722,470 | $0 | $13,425 | $3,265 | 501c4 | Dem | 100.0% | 80.4% | 13 |
| AARP | $2,544,800 | $0 | $6,415,679 | $1,159,777 | 501c4 | Dem | 100.0% | 84.7% | 14 |
| Iowa Forward | $2,071,190 | $0 | $277,157 | $0 | 501c4 | Dem | 100.0% | 100.0% | 15 |
| American Chemistry Council | $1,982,710 | $71,140 | $871,251 | $336,511 | 501c4 | Rep/Dem | 96.5% | 72.1% | 16 |
| Protect Our Care | $1,688,080 | $0 | $6,553 | $0 | 501c4 | Dem | 100.0% | 100.0% | 17 |
| Rocky Mountain Values | $1,297,050 | $371,840 | $331,415 | $169,310 | 501c4 | Dem | 77.7% | 66.2% | 18 |
| Maine Momentum | $1,660,740 | $0 | $363,216 | $1,300 | 501c4 | Dem | 100.0% | 99.6% | 10 |
| Patients for Affordable Drugs Now | $1,141,170 | $0 | $1,735,577 | $84,349 | 501c4 | Rep | 100.0% | 95.4% | 20 |
| Judicial Crisis Network | $1,059,990 | $0 | $29,312 | $127,838 | 501c4 | Rep | 100.0% | 18.7% | 21 |
| Patients for Affordable Drugs Action | $0 | $989,010 | $0 | $50,200 | superPAC | Dem | 0.0% | 0.0% | 23 |
| Package Coalition | $946,910 | $0 | $0 | $0 | coalition | Other | 100.0% | 24 | |
| EDF Action | $878,830 | $60,890 | $98,708 | $0 | 501c4 | Dem | 93.5% | 100.0% | 25 |
| Healthcare Education Project | $862,660 | $0 | $304,307 | $45,712 | coalition | Dem | 100.0% | 86.9% | 26 |
| House Majority Forward & League of Conservation Voters | $849,700 | $0 | $0 | $0 | 501c4s | Dem | 100.0% | 27 | |
| Taxpayers Protection Alliance | $781,330 | $0 | $5,936 | $0 | 501c4 | Rep | 100.0% | 100.0% | 28 |
| AB Foundation | $753,320 | $0 | $0 | $0 | 501c4 | Dem | 100.0% | 29 | |
| Better Future Michigan | $687,280 | $0 | $107,868 | $106,729 | 501c4 | Rep | 100.0% | 50.3% | 30 |
| Everytown For Gun Safety Action Fund | $62,110 | $612,410 | $2,827,712 | $1,283,427 | 501c4 | Dem | 9.2% | 68.8% | 31 |
| NRDC Action Fund | $618,650 | $0 | $1,418,774 | $215,515 | 501c4 | Dem | 100.0% | 86.8% | 32 |
| American Bankers Association | $248,140 | $346,390 | $60,475 | $75,794 | 501c6 | Rep | 41.7% | 44.4% | 33 |
| Demand Justice | $100,760 | $480,250 | $505,758 | $166,651 | 501c4 | Dem | 17.3% | 75.2% | 34 |
| Defend American Democracy | $540,130 | $0 | $0 | $128,977 | 501c4 | Dem | 100.0% | 0.0% | 35 |
| Giffords | $506,690 | $0 | $331,021 | $0 | 501c4 | Dem | 100.0% | 100.0% | 36 |
| Conservation Colorado & Rocky Mountain Values | $444,420 | $0 | $0 | $0 | 501c4 | Dem | 100.0% | 37 | |
| Future Majority, Inc | $383,940 | $0 | $330,270 | $955,833 | 501c4 | Dem | 100.0% | 25.7% | 38 |
| CLA Inc | $362,290 | $0 | $0 | $0 | 501c4 | Rep | 100.0% | 39 | |
| Western Values Project | $351,400 | $0 | $12,483 | $0 | 501c4 | Dem | 100.0% | 100.0% | 40 |
| Perise Practical | $332,740 | $0 | $409,467 | $0 | 501c4 | Dem | 100.0% | 100.0% | 41 |
| American Policy Fund | $284,490 | $0 | $0 | $0 | superPAC | Rep | 100.0% | 42 | |
| Planned Parenthood Action Fund | $277,330 | $0 | $4,187,419 | $250,990 | 501c4 | Dem | 100.0% | 94.3% | 43 |
| Tax March | $257,380 | $0 | $394,588 | $0 | 501c4 | Dem | 100.0% | 100.0% | 44 |
| American Workers For Progress | $255,360 | $0 | $0 | $0 | 501c4 | Dem | 100.0% | 45 | |
| Montana Conservation Voters | $225,630 | $0 | $15,461 | $19,217 | 501c4 | Dem | 100.0% | 44.6% | 46 |
| Fight Corporate Monopolies | $216,020 | $0 | $0 | $0 | 501c4 | Dem | 100.0% | 47 | |
| Restore Public Trust | $162,500 | $0 | $45,837 | $0 | 501c4 | Other | 100.0% | 100.0% | 48 |
| Avacy Initiatives | $160,510 | $0 | $0 | $0 | 501c4 | Dem | 100.0% | 49 | |
| Colorado Sierra Club | $150,290 | $0 | $51,027 | $8,740 | 501c4 | Dem | 100.0% | 85.4% | 50 |
| Independent Women's Voice & Patients For Real Prices | $128,850 | $0 | $0 | $0 | 501c4s | Rep | 100.0% | 51 | |
| Republicans for the Rule of Law | $118,390 | $0 | $0 | $0 | 501c4 | Dem | 100.0% | 52 | |
| Table shows television, Facebook and Google spending for non-disclosing (Dark Money) groups that spent over $100,000 on TV ads since Jan 1, 2019. For TV, numbers include ads aired on broadcast television and national cable between October 12 and October 25, 2020. Facebook and Google ads are between October 11 and October 24, 2020. See About the Data section at the end of this report for more information on our methodology along with the specific page names and disclaimers (Facebook) and advertiser IDs (Google) that are counted. CITE SOURCE OF DATA AS: Kantar/CMAG, Facebook Ad Library and Google Transparency Report with analysis by the Wesleyan Media Project and group classifications by the Center for Responsive Politics. |
|||||||||
Candidate Mentions in Facebook Ads
Additional page names (including other outside groups and parties, in addition to candidates) mentioning senatorial and presidential candidates on Facebook can be investigated through the help of the Wesleyan Media Project’s student-driven Delta Lab via our interactive tables. Table 15 shows all entities that have spent approximately $25,000 or more on Facebook advertising that mentions 2020 presidential or senatorial candidates (removing candidate self-references) since early April—or $5,000 or more in the past few weeks.
Nine out of the top 10 most active non-candidate Facebook pages mentioning presidential and senatorial candidates online (sorting in descending order by # of candidates mentioned and filtering to candidate page=0 on the right most column) in the general election period (since April 9) are pro-Democratic organizations. Progressive Turnout Project has spent $10.3 million on flipping the Senate, ending McConnell’s career and saving Obamacare. The DSCC has spent another $7.6 million, much of which asked for donations. Priorities USA Action is responsible for advertising on two of the top ten pages (Cost of Chaos and Vote by Mail, the latter of which has advertising jointly sponsored by Senate Majority PAC). Republican Voters Against Trump and the Lincoln Project rank sixth and seventh in estimated spending on advertising referencing candidates. The only pro-Republican page in the top ten is America First Action, which we estimate has spent the vast majority of its nearly $4 million dollars of Facebook advertising attacking Biden.
Turning to the past few weeks, seven of the top 10 most active non-candidate pages, which have collectively spent $7.8 million, are pro-Democratic: Progressive Turnout Project, America Votes for Biden (sponsored by Tech for Campaigns), The Lincoln Project, Progressive Takeover, and three pages funded by Priorities USA (Cost of Chaos, We the People 2020 and One North Carolina – the latter two of which are jointly sponsored with Senate Majority PAC). Three pro-Republican pages are in the top 10 pages mentioning candidates: American First Action (which has spent $1.3 million), NRA Institute for Legislative Action (which has spent nearly $789,000) and AFP Action (which has spent $802,000; a separate Americans for Prosperity page also associated with the Koch brothers has spent an additional $195,000).
Table 15: Facebook Pages Mentioning Candidates for President and Senate in 2020
Click here to view the table in a new tab (with larger text)
Table includes Facebook page names spending approximately $25,000 or more on advertising that mentions 2020 presidential or senatorial candidates (excluding candidate self-references) between April 9 and October 24, 2020 or approximately $5,000 or more on advertising between October 11 and October 24, 2020. This interactive table is part of an ongoing, work-in-progress project from WMP’s student-driven Delta Lab. Data table by Delta Lab’s Kevin McMorrow ’20, Sam Feuer ’23 and Jielu Yao. False positive mentions are unavoidable at this stage as candidates are identified through search term queries while we develop methods to improve their accuracy.
Table 16 presents the same set of pages as Table 15 but aggregates the proportion of spending on ads mentioning candidates by the major party affiliation of the candidate mention. The columns “Democrats” and “Republicans” contain the proportion of ads mentioning candidates from the respective parties out of the total number of ads mentioning a candidate at all.
Table 16: Facebook Pages Mentioning Candidates for President and Senate in 2020 by Party
Click here to view the table in a new tab (with larger text)
Table includes Facebook page names spending approximately $25,000 or more on advertising that mentions 2020 presidential or senatorial candidates (excluding candidate self-references) between April 9 and October 24, 2020 or approximately $5,000 or more on advertising between October 11 and October 24, 2020. This interactive table is part of an ongoing, work-in-progress project from WMP’s student-driven Delta Lab. Data table by Delta Lab’s Kevin McMorrow ’20, Sam Feuer ’23 and Jielu Yao. False positive mentions are unavoidable at this stage as candidates are identified through search term queries while we develop methods to improve their accuracy.
TV Ad Volumes Reach Historic Highs
Figure 10 shows that the volume of ads airing in federal races this year is higher than any recent election. About 5.2 million ads have aired this cycle, which is about double the volume of ads in 2012.
Figure 10: Volume of Federal Advertising by Cycle (2012-2020)
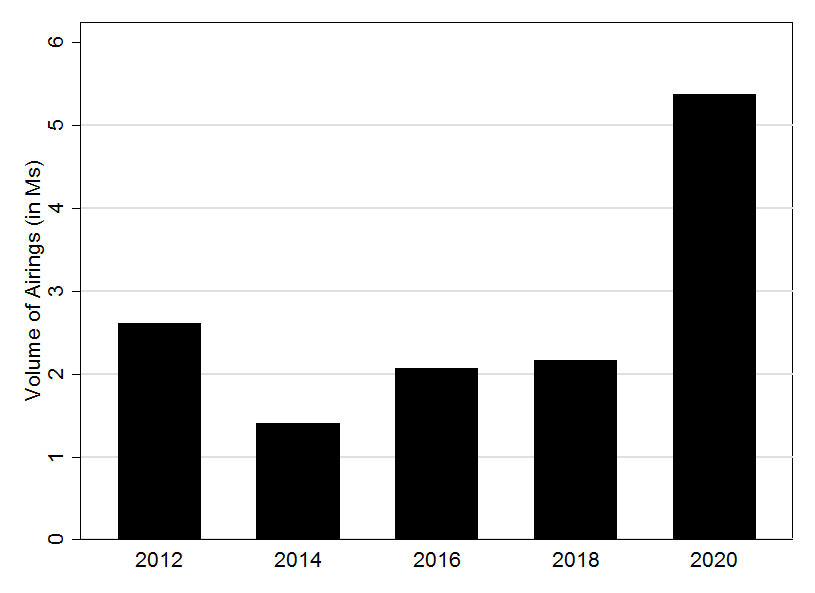
Numbers include all federal ads aired on broadcast television and national cable between January 1 of the off-cycle year and October 25 of the election year.
CITE SOURCE OF DATA AS: Kantar/CMAG with analysis by the Wesleyan Media Project.
The number of presidential ad airings continues to climb week-over-week (Figure 11) and is well above the number seen in both 2012 and 2016 (75 and 149 percent increases respectively).
Figure 11: Number of Presidential Ad Airings by Week (2012, 2016 and 2020)

Numbers include ads aired on broadcast television and national cable between July 1, 2019 and October 25, 2020.
CITE SOURCE OF DATA AS: Kantar/CMAG with analysis by the Wesleyan Media Project.
The volume of U.S. House and U.S. Senate ads is also higher than in past year, especially in the Senate (Figure 12). Over 2 million ads have aired in Senate races since January 1, 2019. That’s almost twice the volume of Senate ads that aired in the previous election cycle, an increase of 81 percent. House ads are also up slightly over the 2017-2018 election cycle (9 percent).
Figure 12: Volume of Congressional Ad Airings by Cycle (2012-2020)
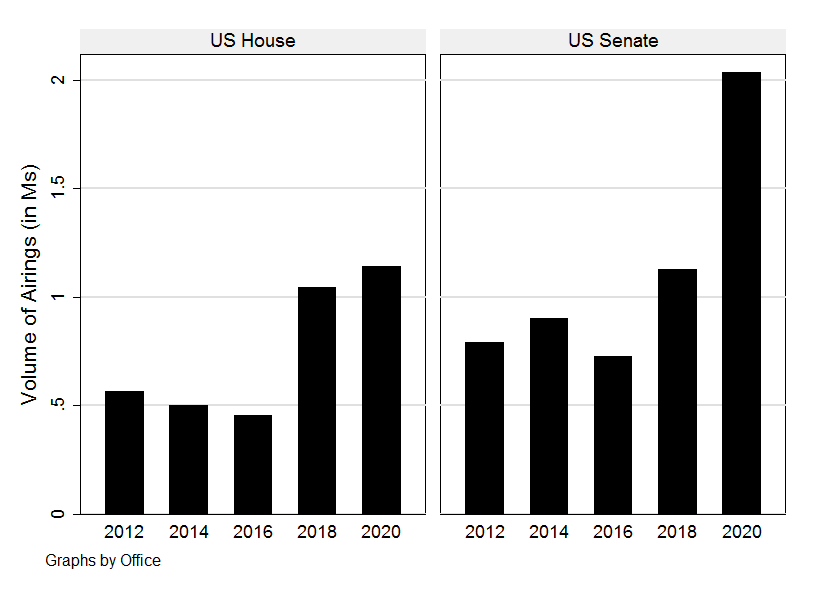
Numbers include ads aired on broadcast television and national cable between January 1 of the off-cycle year and October 25 of the election year.
CITE SOURCE OF DATA AS: Kantar/CMAG with analysis by the Wesleyan Media Project.
Senate ad airings showed no sign of slowing, hitting 200,000 in the past week (Figure 13). At this point in 2012 and 2016, there were only about 80,000 ads airing.
“Ad numbers in 2020 are off the charts, especially in the presidential and Senate races,” said Michael Franz, co-director of the Wesleyan Media Project. “Not only are there a lot of very competitive Senate races, but there’s a lot of money out there trying to influence voters.”
Figure 13: Number of U.S. Senate Ad Airings by Week (2012, 2016 and 2020)

Numbers include ads aired on broadcast television between January 1 and October 25, 2020.
CITE SOURCE OF DATA AS: Kantar/CMAG with analysis by the Wesleyan Media Project.
The volume of ads in House races also continues to rise sharply, reaching over 150,000 in the past week (Figure 14). Again, ad volumes are much higher than in 2012 and 2016.
Figure 14: Number of U.S. House Ad Airings by Week (2012, 2016 and 2020)
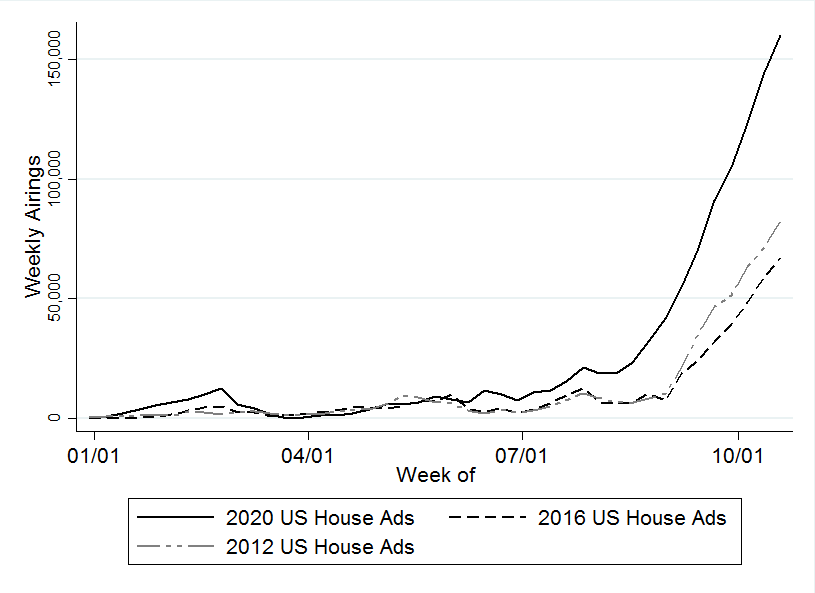
Numbers include ads aired on broadcast television between January 1 and October 25, 2020.
CITE SOURCE OF DATA AS: Kantar/CMAG with analysis by the Wesleyan Media Project.
About the Data
For the television ad totals, data reported here are from Kantar/CMAG and do not cover local cable buys, only broadcast television, national network and national cable advertising.
For Facebook ads, data come from the aggregate reports, but our figures are more comprehensive than what Facebook reports on their campaign page because we include spending on ads that are funded by the campaigns even when they run on different pages in our totals (e.g., Trump funded ads on Mike Pence or Brad Parscale’s pages are included in the Trump totals). We looked for pages attached to each candidate, including possible leadership PACs, joint-fund-raising committees, and, in the case of presidential candidates, affiliated Senate/House pages. Aggregate report entries are provided for each page name and disclaimer combination. Totals for most of this report reflect spending between January 6, 2019; April 9, 2020; September 5, 2020, or October 11, 2020 and October 24, 2020. These totals are calculated by subtracting the reported cumulative spending (as reported by Facebook as the total spent since May 2018) for the October 24, 2020 report and subtracting off the cumulative spending reported for December 31, 2019; April 8, 2020; September 4, 2020; or October 10, 2020.
Calculating cycle-to-date Facebook totals is more challenging than looking at totals from the last couple of months. In early January 2019, Facebook did not include page IDs (a unique identifier) for each entry in the aggregate report. Because pages can have the same name, a unique identifier for each page would be required to definitively identify an aggregate report entry, which Facebook does not provide going backward. Therefore, we did our best to associate each entry in the January 5, 2019, report with a page ID, which we had access to through the library API. There may be some slippage if two pages associated with candidates had identical names and disclaimers, but we believe these instances are rare for the set of ads covered in this report. For cycle-to-date spending, we subtracted the January 5, 2019 total from the October 24, 2020 total to get the spending by page and disclaimer for January 6, 2019 through October 24, 2020. As noted above, we also report spending from April 9, 2020 through October 24, 2020 and September 5, 2020 through October 24, 2020. We rely on a Delta Lab monitoring tool to identify and avoid using days on which Facebook has a problem with the aggregated spending report.
In Table A (click here to download), we list the page names/disclaimer rows from the Facebook aggregate reports that we identified for this report. It is possible that we missed some spending from a Facebook page affiliated with a candidate running for office. This is exacerbated by the absence of EIN or FEC identifiers in the Facebook reports.
For Google ads, we downloaded the weekly reports from the platform’s Transparency Report. As a matter of practice with all of the platform data, we try to replicate our prior spending figures when we are calculating numbers for a new release. In that process, we discovered discrepancies between the data we downloaded in November and the information available in the December download for the same dates, which persists in October. Based on conversations with Google, we believe the discrepancies are partially but not exclusively due to the addition of advertisers targeting state-level races. We are working on a process to report these discrepancies, but the totals reflected in this release are current as of 10/27/20, the day on which we pulled the transparency report. Google only includes spending in federal and state races and only includes weekly totals but lists the sponsor’s EIN or FEC committee ID. We searched the list of advertisers for presidential candidates and affiliated leadership PACs and joint-fund-raising committees, and candidates for U.S Senate and affiliated single-candidate super PACs. We made the same assumption as with the Facebook data about any spending from House and Senate campaign committees by declared presidential candidates. Google spending is from the following time periods: January 5, 2019; April 12, 2020; September 6, 2020; or October 11, 2020 through October 24, 2020.
In Table B (click here to download), we list the advertiser name for all entities used in this report to calculate Google spending totals.
About This Report
The Wesleyan Media Project (WMP) provides real-time tracking and analysis of political advertising in an effort to increase transparency in elections. Housed in Wesleyan’s Quantitative Analysis Center (QAC) – part of the Allbritton Center for the Study of Public Life – the Wesleyan Media Project is the successor to the Wisconsin Advertising Project, which disbanded in 2009. It is directed by Erika Franklin Fowler, associate professor of government at Wesleyan University, Michael M. Franz, professor of government at Bowdoin College and Travis N. Ridout, professor of political science at Washington State University. WMP personnel include Laura Baum (Project Manager), Colleen Bogucki (Project Coordinator), Pavel Oleinikov (Associate Director, QAC), Markus Neumann (Post-Doctoral Fellow), and Jielu Yao (Post-Doctoral Fellow).
The Wesleyan Media Project’s digital advertising tracking is supported by the contributions of students in Delta Lab, an interdisciplinary research collaborative focusing on computationally-driven and innovative analyses and visualizations of media messaging. We especially thank Spencer Dean ’21, Kevin McMorrow ‘20, Sam Feuer ’23 and Roshaan Siddiqui ‘22 for their contributions to this report.
The Wesleyan Media Project is supported by Wesleyan University, the John S. and James L. Knight Foundation, and the Democracy Fund. WMP is partnering again this year with the Center for Responsive Politics, to provide added information on outside group disclosure.
Periodic releases of data will be posted on the project’s website and dispersed via Twitter @wesmediaproject. To be added to our email update list, click here.
For more information contact: Lauren Rubenstein, lrubenstein@wesleyan.edu, (203) 644-7144
About Wesleyan University Wesleyan University, in Middletown, Conn., is known for the excellence of its academic and co-curricular programs. With more than 2,900 undergraduates and 200 graduate students, Wesleyan is dedicated to providing a liberal arts education characterized by boldness, rigor and practical idealism. For more, visit wesleyan.edu.
About the John S. and James L. Knight Foundation Knight Foundation is a national foundation with strong local roots. We invest in journalism, in the arts, and in the success of cities where brothers John S. and James L. Knight once published newspapers. Our goal is to foster informed and engaged communities, which we believe are essential for a healthy democracy.
About Democracy Fund Created by eBay founder and philanthropist Pierre Omidyar, Democracy Fund is a foundation helping to ensure that our political system can withstand new challenges and deliver on its promise to the American people. Democracy Fund has invested more than $125 million in support of a healthy, resilient, and diverse democracy with a particular focus on modern elections, effective governance, and a vibrant public square.


