Photo: Thru_the_Glass/Flickr
Jobs, Business, Taxes Top Trump Issues in TV Ads;
Biden Focuses on Virus
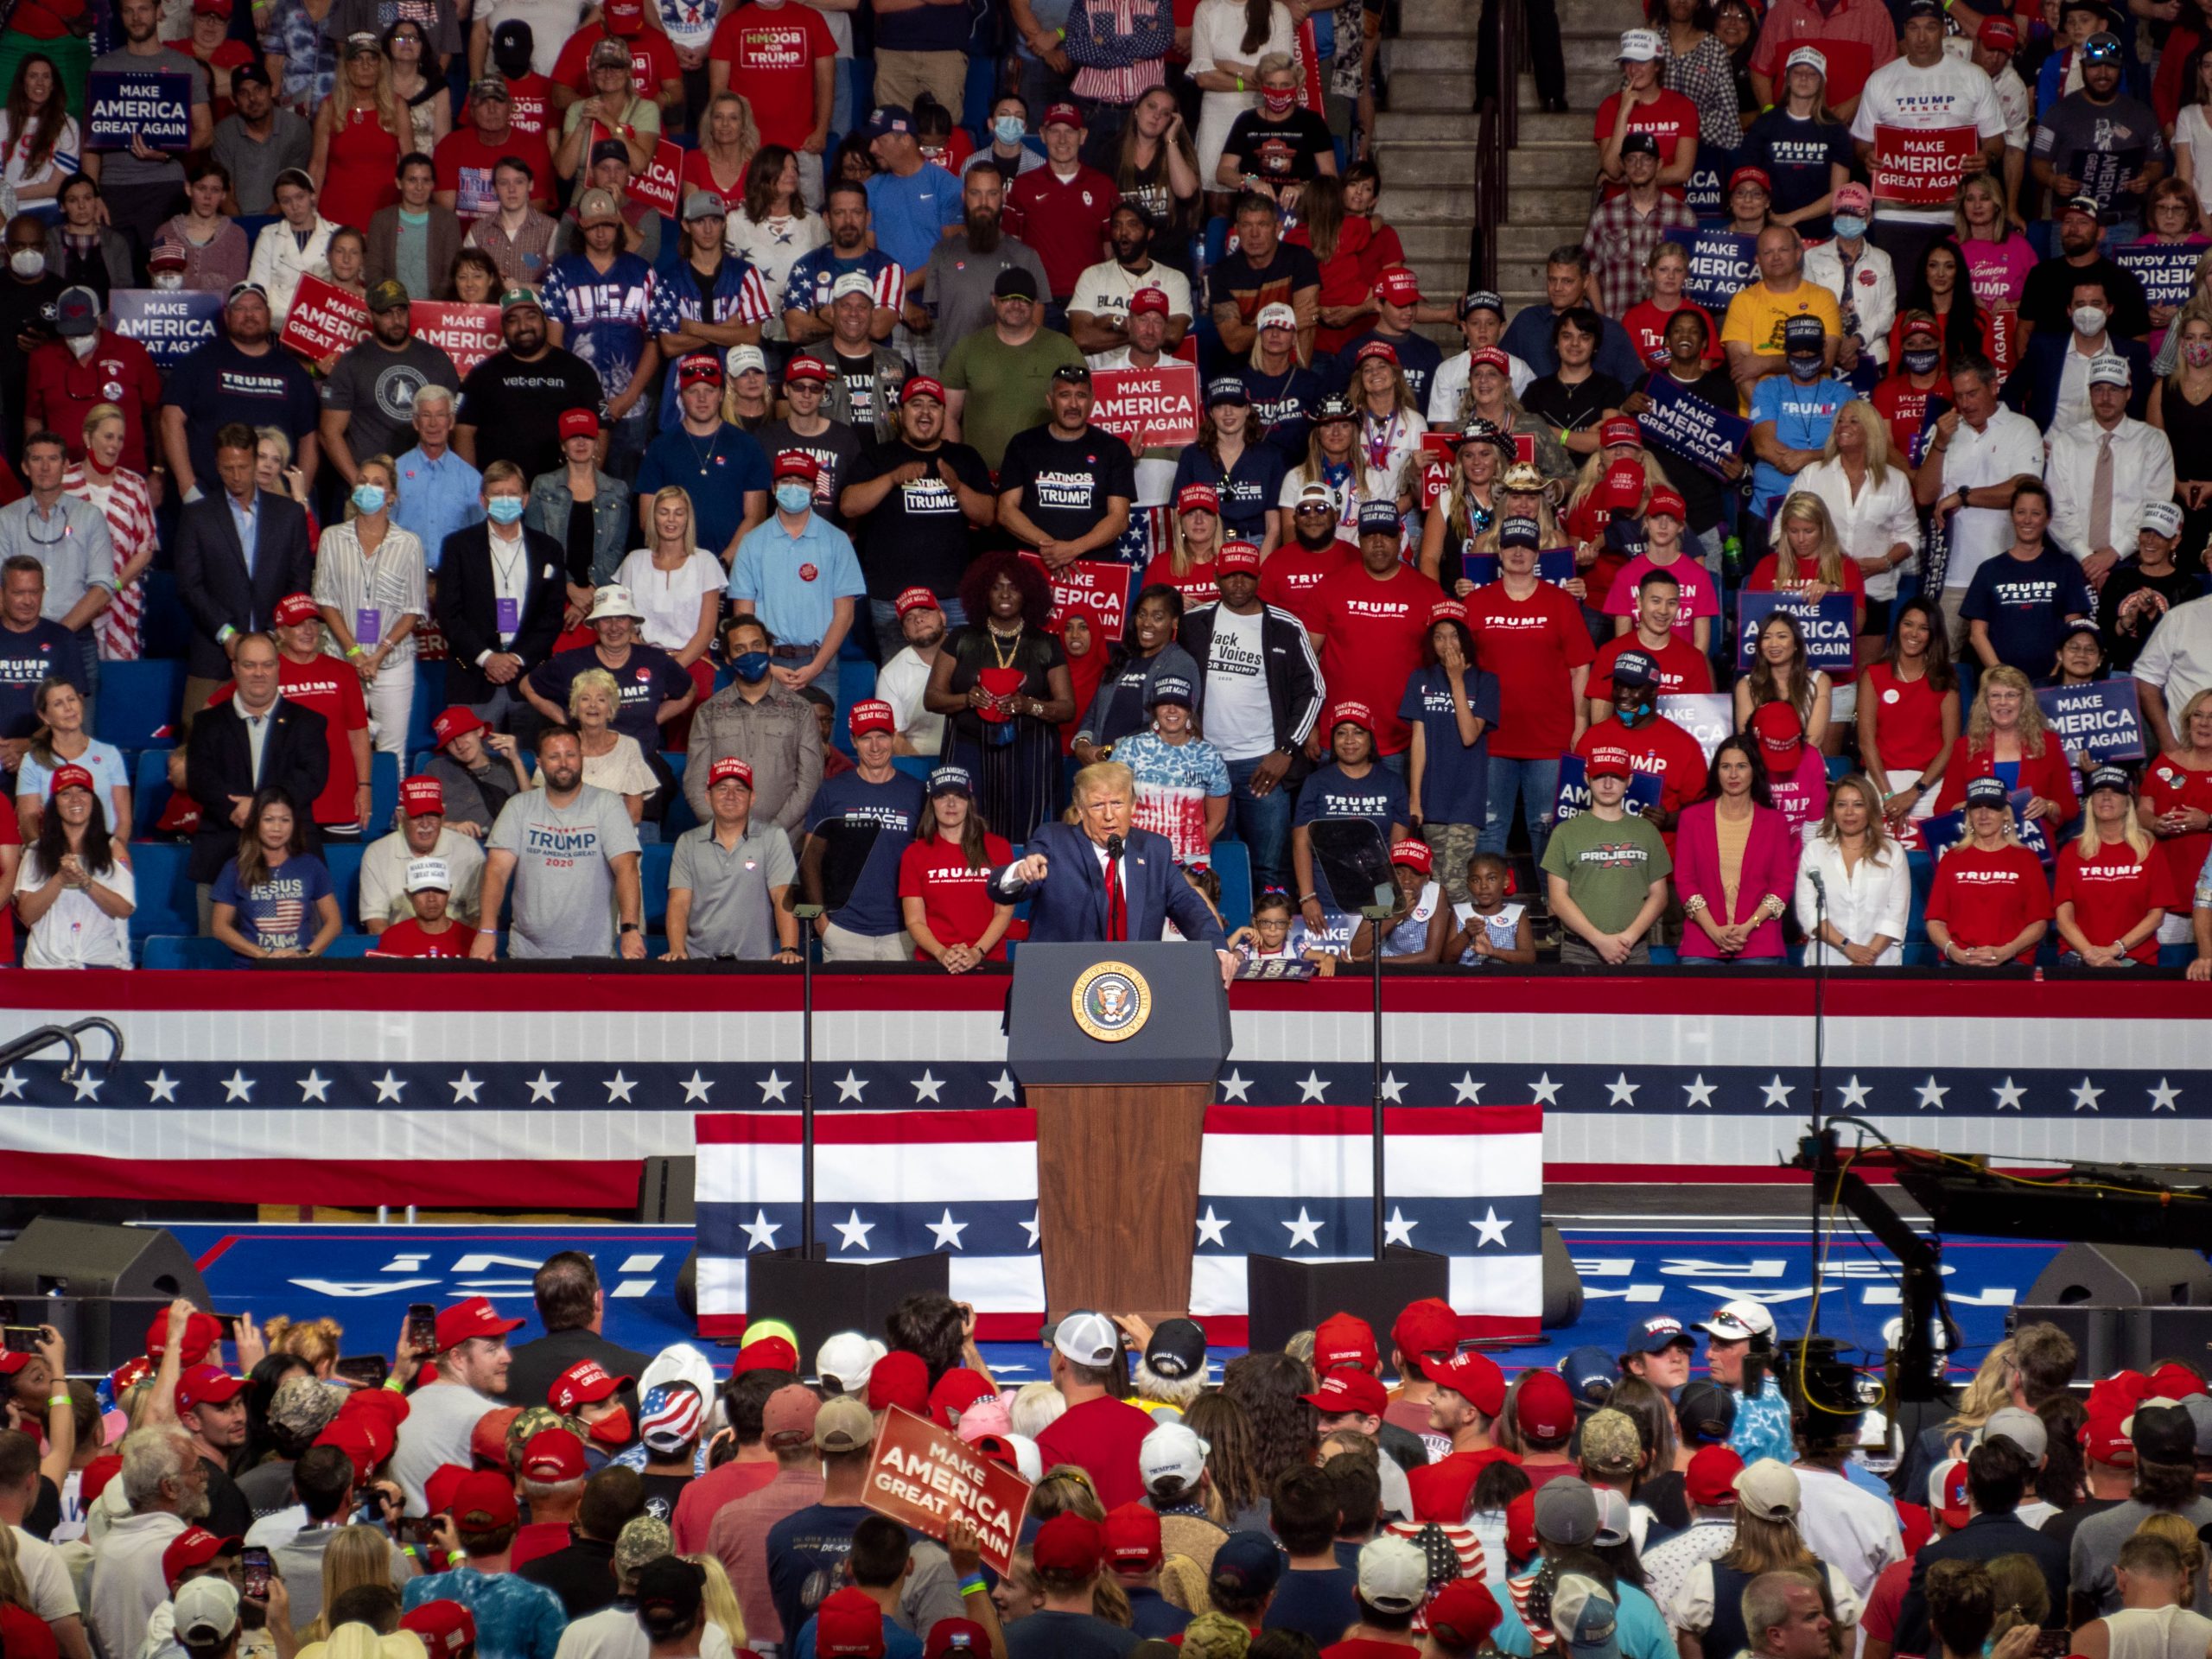
(MIDDLETOWN, CT) September 17, 2020 – A new analysis from the Wesleyan Media Project finds that, at least on television, Donald Trump’s advertising has shifted away from his almost exclusive focus on crime and protests (as highlighted in our August 12 report) to more “bread and butter” Republican issues. Over the past five weeks, Trump’s ads have focused on jobs, business and taxes, with each issue appearing in over half of his ads (Table 1). Immigration has also been highlighted by the Trump campaign, with the issue being mentioned in 54 percent of Trump ad airings. While this report focuses primarily on the content of TV ads, the Wesleyan Media Project will be publishing an update on the volume of TV and digital advertising in the next two weeks.
“Trump needs voters in the middle if he’s going to win reelection,” said Travis Ridout, co-director of the Wesleyan Media Project. “His issue focus in his television advertising has definitely turned away from the potentially divisive issues of race, policing and protests, which didn’t seem to move the needle much earlier this summer.”The issue of police brutality/racial violence has been mentioned in 10 percent of Trump ad airings since August 10, while protests/riots appeared in 8.5 percent of airings and crime was mentioned in just 4 percent. Notably, Trump has mentioned COVID-19 in 28 percent of his airings. These are from one ad that aired over 12,000 times in the last month and asserted that the “In the race for the vaccine, the finish line is approaching.” The ad also criticizes Biden for saying that he would shut the country down again if necessary. By contrast, the top issue of Joe Biden’s campaign has been infectious disease (COVID-19), which has been mentioned in 54 percent of his ad airings. Emergency preparedness and response (which, in this case, refers most often to the handling of public health crises) has been mentioned in 42 percent of his ad airings. The economy and business were mentioned in about 30 percent of Biden’s ads. Biden’s other top issues include health care (mentioned in 32 percent of his airings) and the economy in general terms.
Table 1: Top Issue Mentions by Trump and Biden Campaigns
| Mentions | Percent (%) | Mentions | Percent (%) | ||
| Jobs | 29,607 | 65.2 | COVID-19 | 69,169 | 53.6 |
| Business | 26,562 | 58.5 | Emergency prep/response | 53,942 | 41.8 |
| Taxes | 25,674 | 56.6 | Health care | 40,903 | 31.7 |
| Immigration | 24,577 | 54.1 | Economy (generic) | 39,214 | 30.4 |
| Medicare | 13,271 | 29.2 | Business | 38,970 | 30.2 |
| Economy (generic) | 12,648 | 27.9 | Jobs | 29,211 | 22.6 |
| COVID-19 | 12,648 | 27.9 | Seniors (not Medicare) | 28,433 | 22.0 |
| Health care | 11,847 | 26.1 | Health care expansion/access | 18,116 | 14.0 |
| Seniors (not Medicare) | 11,847 | 26.1 | Recession/econ stimulus | 15,179 | 11.8 |
| Social security | 11,847 | 26.1 | Education | 13,547 | 10.5 |
| Gov't spending | 10,757 | 23.7 | Social security | 12,397 | 9.6 |
| Police brutality/racial violence | 4,522 | 10.0 | Universal health care | 11,402 | 8.8 |
| Protests/riots | 3,879 | 8.5 | Child care/family leave | 9,681 | 7.5 |
| Trade | 2,207 | 4.9 | Taxes | 9,644 | 7.5 |
| Crime | 1,754 | 3.9 | Medical bills | 9,477 | 7.3 |
| Medical bills | 1,424 | 3.1 | Protests/riots | 7,914 | 6.1 |
| Prescription drugs | 1,424 | 3.1 | Gov't spending | 7,523 | 5.8 |
| Minimum wage | 1,097 | 2.4 | Obamacare | 6,712 | 5.2 |
| Poverty | 1,097 | 2.4 | Climate change/global warming | 6,123 | 4.7 |
| Campaign finance reform | 832 | 1.8 | Foreign policy | 5,425 | 4.2 |
| Education | 643 | 1.4 | China | 5,423 | 4.2 |
| Socialism | 643 | 1.4 | Energy policy | 5,423 | 4.2 |
| Energy policy | 136 | 0.3 | Medicare | 4,514 | 3.5 |
| Numbers include candidate-sponsored ad airings only on broadcast television and national cable between August 10 and September 13, 2020. CITE SOURCE OF DATA AS: Wesleyan Media Project coding of Kantar/CMAG data. |
|||||
Pandemic Top Issue for Both Parties in Senate Races
While Biden and Trump have diverged in their issue discussion, Republican and Democratic advertisers are emphasizing many of the same issues in U.S. Senate races. For both parties, infectious disease, that is, the COVID-19 pandemic, is the top issue, as Table 2 shows. It has been mentioned in 36 percent of pro-Democratic ads and 33 percent of pro-Republican ads since August 10.“The pandemic is too big of an issue to ignore,” said Michael Franz, co-director of the Wesleyan Media Project. “Regardless of whether you are a Republican or Democrat, you must be responsive to an issue that is affecting everyone’s life right now.”As in 2018, Democratic ads are also focusing on health care more generally, with 32 percent of ads featuring the issues. Republicans are not ignoring health care, however, as just under 20 percent of their ads mention the issue. Business is a top issue for both parties as well, appearing in 30 percent of pro-Democratic ads and 32 percent of pro-Republican ads. Republican ads are placing more emphasis on jobs than are Democratic ads. The issue of protests and riots have not been a big focus of Republican ads in recent weeks, totaling just 6 percent of mentions in pro-GOP spots.
Table 2: Top Issues in U.S. Senate Races by Party
| Issue | Airings | Percent (%) | Issue | Airings | Percent (%) |
| COVID-19 | 90,208 | 36.2 | COVID-19 | 57,756 | 32.7 |
| Health care | 79,067 | 31.7 | Business | 55,738 | 31.6 |
| Business | 73,463 | 29.5 | Jobs | 55,397 | 31.4 |
| Campaign finance reform | 49,912 | 20.0 | Taxes | 49,653 | 28.1 |
| Jobs | 38,695 | 15.5 | Health care | 34,662 | 19.6 |
| Prescription drugs | 31,610 | 12.7 | Emergency prep/response | 24,496 | 13.9 |
| Taxes | 27,425 | 11.0 | Recession/econ stimulus | 23,753 | 13.4 |
| Medical bills | 22,093 | 8.9 | China | 19,363 | 11 |
| Emergency prep/response | 20,080 | 8.1 | Government ethics/scandal | 16,930 | 9.6 |
| Government ethics/scandal | 19,160 | 7.7 | Economy (generic) | 14,203 | 8 |
| Military | 16,666 | 6.7 | Education | 11,395 | 6.5 |
| Trade | 16,537 | 6.6 | Gov't spending | 11,338 | 6.4 |
| Education | 15,379 | 6.2 | Campaign finance reform | 10,778 | 6.1 |
| Medicare | 13,647 | 5.5 | Trade | 10,652 | 6 |
| Veterans | 13,477 | 5.4 | Protests/riots | 10,499 | 5.9 |
| Numbers include ads aired on broadcast television and national cable between August 10 and September 13, 2020. Numbers include both candidate, party, and group-sponsored ads. CITE SOURCE OF DATA AS: Wesleyan Media Project coding of Kantar/CMAG data. |
|||||
Republican Senate Candidates Run Against Pelosi
Table 3 shows how various national politicians are featured (in either explicit mentions or pictures) in ads for U.S. Senate. Senate Majority Leader Mitch McConnell was the most featured politician, in part because he is on the ballot himself in Kentucky. All of the positive McConnell references were from his own campaign, and many of the negative ones were his opponent (over 12,000 references were from Democrat Amy McGrath), though Democratic candidates in Maine and Iowa featured McConnell in a negative fashion.
Speaker of the House Nancy Pelosi was featured in over 19,000 ad airings in Senate races (nearly 5 percent of all airings), almost all of them negative. All of the disapproving references to the Speaker are in ads for Republicans, where references to the Pelosi make up nearly 11 percent of pro-Republican airings.
“Clearly, Republicans have turned Nancy Pelosi into their key target this election,” said Erika Franklin Fowler, co-director of the Wesleyan Media Project. “Pelosi, in spite of serving in the House, was mentioned almost twice as often as Joe Biden was in Senate advertising.”She was most frequently featured by Republican Steve Daines in Montana, who featured a critique of Pelosi in more than half of his 17,000 airings in the last month. These included attacks on his opponent, Steve Bullock, who Daines accuses of wanting to work with Pelosi to pass gun control legislation.
President Trump was featured positively or negatively in over 14,000 ad airings, the majority of them positive. (He was mentioned more generally in about 5,000 additional ad airings, one from the Democratic candidate and one from the Republican in the Michigan Senate race. These are not included in the Table because they simply mention Trump and do not praise or attack him.). Republicans referencing Trump positively were Tommy Tuberville in Alabama, Kelly Loeffler in Georgia, Mitch McConnell in Kentucky, Steve Daines in Montana, and Corky Messner in New Hampshire. Topping the pro-Trump mentions, as a share of advertising in these states, was Kelly Loeffler in Georgia, who referenced Trump in 2,900 of her 4,300 airings in the last month, touting Trump’s endorsement of her. In Kentucky, Mitch McConnell featured Trump in 2,700 of his 6,500 total airings. Tommy Tuberville only sponsored 455 spots in this time period, but all them featured Trump. This was true also of Messner, who only aired 519 spots. In contrast, Steve Daines featured Trump in only 1,500 airings of his 17,000.
Joe Biden has been featured negatively in almost 11,000 Senate ad airings. The 2016 Democratic presidential nominee, Hillary Clinton, has also been featured in over 3,000—all in ads from Republican incumbent Lindsey Graham of South Carolina. As a point of comparison, in 2016, Hillary Clinton was featured negatively in 6,740 ad airings during this same August 10 to September 13 time period, though the volume of Senate ads in 2016 was smaller than in 2020.
Table 3: Positive or Negative References to National Politicians in Senate Race Ads
| Politician | References | Positive References | Negative References |
|---|---|---|---|
| Mitch McConnell | 22,101 | 5,060 | 17,041 |
| Nancy Pelosi | 19,469 | 559 | 18,910 |
| Donald Trump | 14,271 | 8,148 | 6,123 |
| Joe Biden | 10,788 | 0 | 10,788 |
| Hillary Clinton | 3,073 | 0 | 3,073 |
| Chuck Schumer | 2,024 | 0 | 2,024 |
| Barack Obama | 1,038 | 0 | 1,038 |
| Ronald Reagan | 290 | 290 | 0 |
| George Bush | 0 | 0 | 0 |
| Bill Clinton | 0 | 0 | 0 |
| Numbers include ads aired on broadcast television and national cable between August 10 and September 13, 2020. Numbers include candidate, party, and group-sponsored ads, and excludes national politician references that do not include a clear approving or disapproving tone. CITE SOURCE OF DATA AS: Wesleyan Media Project coding of Kantar/CMAG data. |
|||
Presidential Ads More Negative than 2016 But Fewer Pure Attacks in Past Weeks
Figure 1 shows the tone of presidential advertising in 2012, 2016 and 2020. Black indicates purely negative ads (solely attacks), the grey indicates contrast ads (which both promote the favored candidate and attack the opponent) and white indicates positive ads (which solely promote a favored candidate). The left panel shows the tone of presidential advertising during the entire general election campaign, revealing that negativity in 2020 is above 2016 levels, though slightly below levels of negativity in 2012.
Figure 1: Tone of Advertising in Presidential Race (2012-2020)
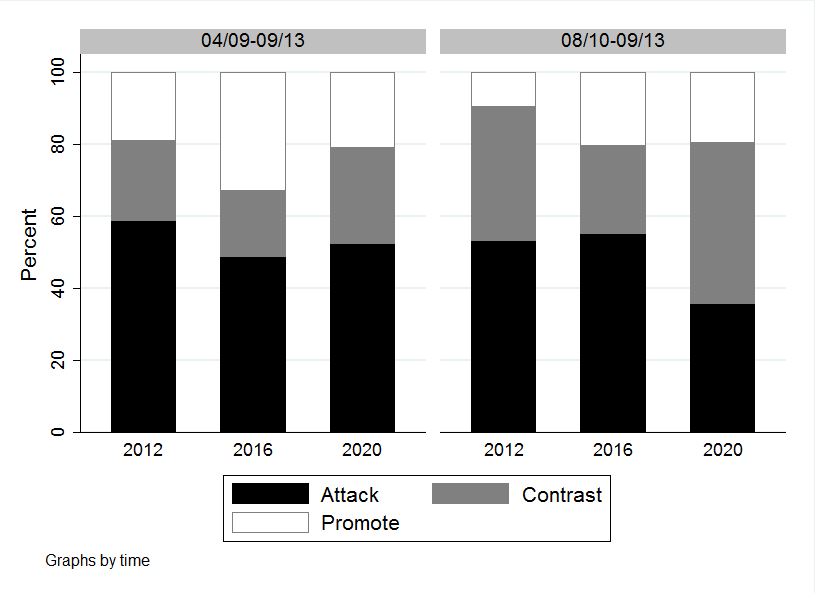
Numbers include ads aired on broadcast television and national cable between April 9 and September 13 in each year (left panel) and between August 10 and September 13 in each year (right panel). Numbers include candidate, party, and group-sponsored ads.
CITE SOURCE OF DATA AS: Wesleyan Media Project coding of Kantar/CMAG data
The right panel in Figure 1 shows, however, that the presidential race has seen fewer pure attacks since August 10, with under 40 percent of ads being purely negative.
Figure 2 shows the percentage of ad airings in each week of the general election campaigns that contain attacks (combining negative and contrast ads), broken down by pro-Trump advertising (in red) and pro-Biden advertising (in blue). The black line shows the tone of advertising overall.
During August, pro-Trump advertising was almost completely negative. Pro-Biden advertising has overall been much more positive than pro-Trump advertising, and yet in several weeks in early July and recent weeks, negativity was over 60 percent.
Figure 2: Percentage of Negative (Attack or Contrast) Ad Airings in Presidential Race by Week
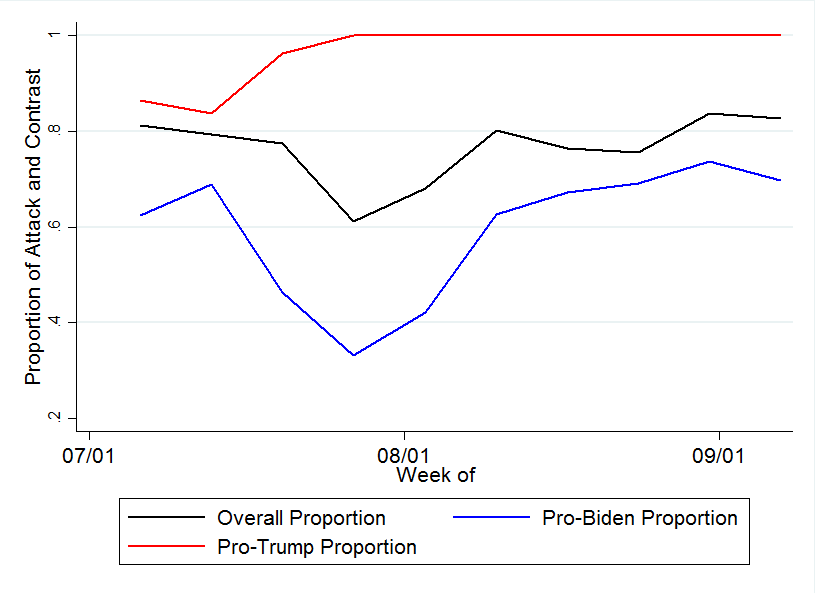
Numbers include weekly proportion of ads aired on broadcast television and national cable between July 6 and September 13, 2020. Numbers include candidate, party, and group-sponsored ads.
CITE SOURCE OF DATA AS: Wesleyan Media Project coding of Kantar/CMAG data.
Tone of Senate Advertising Similar to 2012, 2016
Just under 40 percent of ads airing in U.S. Senate races this election cycle have been negative, a percentage just slightly below the same time period in 2012 and 2016. Since August 10, 48 percent of ad airings in U.S. Senate races have been negative—again, just slightly below the 50 percent figure for 2012 and the 51 percent figure for 2016.
Figure 3: Tone of Advertising in U.S. Senate Races (2012-2020)
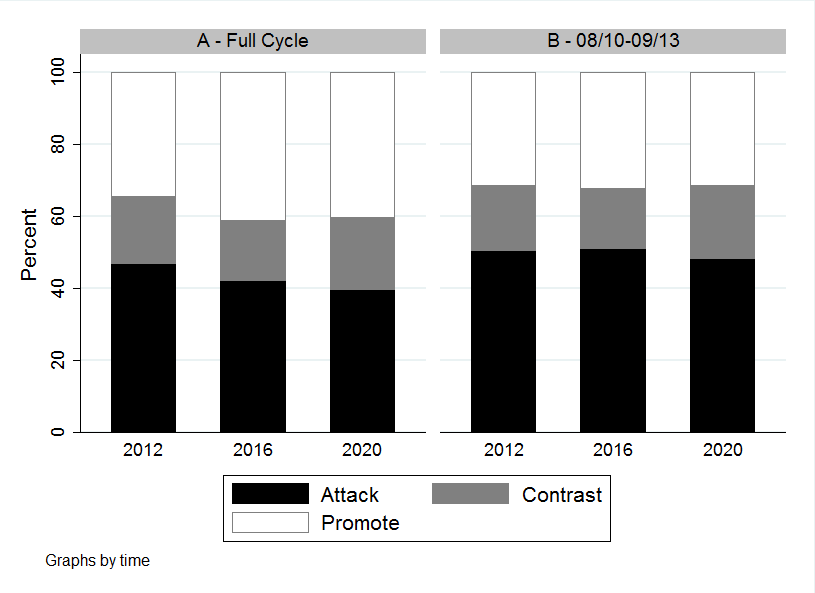
Numbers include ads aired on broadcast television and national cable between January 1 of the off year and September 13 of the election year in each cycle (left panel) and between August 10 and September 13 of the election year in each year (right panel). Numbers include candidate, party, and group-sponsored ads.
CITE SOURCE OF DATA AS: Wesleyan Media Project coding of Kantar/CMAG data.
But negativity (defined here as the proportion of both attack and contrast ads) in Senate races has been increasing over the past two months (Figure 4). As the black line shows, it rose from just over half in early July to well over 70 percent in the past week. While pro-Democratic advertising (in blue) was more positive than pro-Republican advertising (in red) in the early summer, negativity in pro-Democratic advertising rose above levels in pro-Republican advertising in August.
Figure 4: Percentage of Negative (Attack or Contrast) Ad Airings in U.S. Senate Races by Week
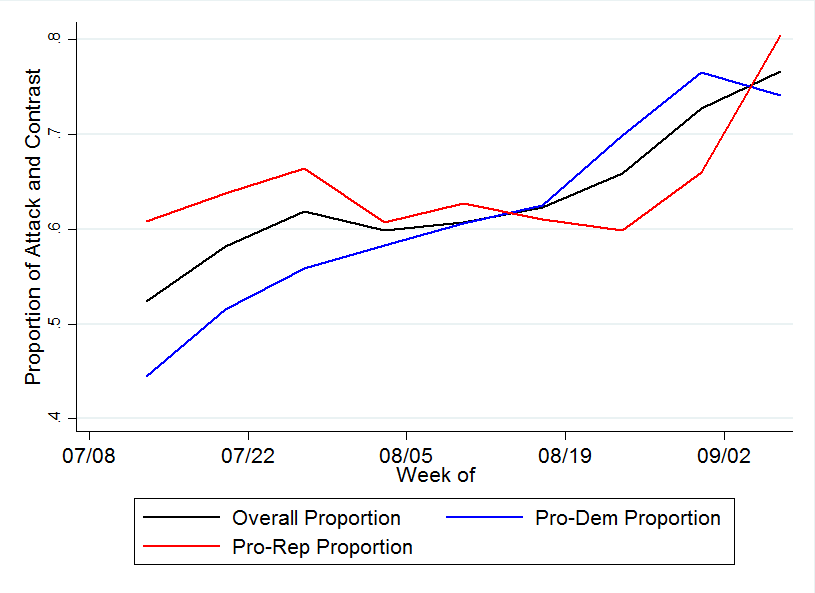
Numbers include weekly proportion of ads aired on broadcast television and national cable between July 6 and September 13, 2020.
CITE SOURCE OF DATA AS: Wesleyan Media Project coding of Kantar/CMAG data.
CORRECTION: A prior version of this report incorrectly classified a few creatives in the presidential and senatorial races, which once corrected resulted in changes to some of the tone figures. Most were very mild references to opponents, which shifted the classification from promotional to contrast spots. Notably, we have now removed references to the presidential air war becoming more positive in the time period covered in the report. Contact the WMP team at mediaproject@wesleyan.edu if you have additional questions about this report or the correction.
About This Report
The Wesleyan Media Project (WMP) provides real-time tracking and analysis of political advertising in an effort to increase transparency in elections. Housed in Wesleyan’s Quantitative Analysis Center (QAC) – part of the Allbritton Center for the Study of Public Life – the Wesleyan Media Project is the successor to the Wisconsin Advertising Project, which disbanded in 2009. It is directed by Erika Franklin Fowler, professor of government at Wesleyan University, Michael M. Franz, professor of government at Bowdoin College and Travis N. Ridout, professor of political science at Washington State University. WMP personnel include Laura Baum (Project Manager), Colleen Bogucki (Project Coordinator), Pavel Oleinikov (Associate Director, QAC), Markus Neumann (Post-Doctoral Fellow), and Jielu Yao (Post-Doctoral Fellow).
The Wesleyan Media Project’s digital advertising tracking is supported by the contributions of students in Delta Lab, an interdisciplinary research collaborative focusing on computationally-driven and innovative analyses and visualizations of media messaging.
The Wesleyan Media Project’s real-time tracking is supported by Wesleyan University, the John S. and James L. Knight Foundation, and Democracy Fund. WMP is partnering again this year with the Center for Responsive Politics, to provide added information on outside group disclosure.
Periodic releases of data will be posted on the project’s website and dispersed via Twitter @wesmediaproject. To be added to our email update list, click here.
For more information contact: Lauren Rubenstein, lrubenstein@wesleyan.edu
About Wesleyan University Wesleyan University, in Middletown, Conn., is known for the excellence of its academic and co-curricular programs. With more than 2,900 undergraduates and 200 graduate students, Wesleyan is dedicated to providing a liberal arts education characterized by boldness, rigor and practical idealism. For more, visit wesleyan.edu.
About the John S. and James L. Knight Foundation Knight Foundation is a national foundation with strong local roots. We invest in journalism, in the arts, and in the success of cities where brothers John S. and James L. Knight once published newspapers. Our goal is to foster informed and engaged communities, which we believe are essential for a healthy democracy.
About Democracy Fund Created by eBay founder and philanthropist Pierre Omidyar, Democracy Fund is a foundation helping to ensure that our political system can withstand new challenges and deliver on its promise to the American people. Democracy Fund has invested more than $125 million in support of a healthy, resilient, and diverse democracy with a particular focus on modern elections, effective governance, and a vibrant public square.
