Photo Moussa81/iStock
Digital spending significant in Senate races;
Abortion is still a top issue for Democrats in House and Gubernatorial races
(MIDDLETOWN, CT) – September 8, 2022 – Democratic candidates are spending heavily on broadcast television advertising in U.S. Senate races, according to a new report from the Wesleyan Media Project. In fact, as Table 1 shows, the top five advertisers on broadcast television over the past month have been Democrats. Val Demings in Florida, Mark Kelly in Arizona, and Raphael Warnock in Georgia have each aired over 7,000 spots on broadcast television, while Mandela Barnes in Wisconsin and Tim Ryan in Ohio have each aired well over 5,000 spots.
“Democratic candidates for Senate seats appear to have plenty of cash, judging by the number of ads they have been able to purchase over the past month,” said Travis Ridout, co-director of the Wesleyan Media Project. “Republican candidates, by contrast, have been relying on the National Republican Senatorial Committee and One Nation—a group organized as a 501c—to support their campaigns on the air.”
Table 1: Top Senate Race Advertisers on Television by Volume and Spending (August 8 to September 4)
| Sponsor | State | Airings | Est. Cost (in $Ms) |
|---|---|---|---|
| Demings, Val | FL | 7,485 | 4.50 |
| Kelly, Mark | AZ | 7,308 | 5.13 |
| Warnock, Raphael | GA | 7,273 | 4.00 |
| Barnes, Mandela | WI | 6,982 | 3.76 |
| Ryan, Tim | OH | 5,503 | 3.11 |
| Oz, Mehmet & NRSC | PA | 4,590 | 3.31 |
| Fetterman, John | PA | 4,211 | 2.79 |
| Democratic Senatorial Campaign Committee (DSCC) | WI | 4,068 | 2.66 |
| Beasley, Cheri | NC | 4,030 | 1.45 |
| One Nation | GA | 3,912 | 5.53 |
| Masto, Catherine Cortez | NV | 3,867 | 3.66 |
| One Nation | WI | 3,803 | 2.99 |
| Rubio, Marco & NRSC | FL | 3,317 | 1.26 |
| Duty And Honor | WI | 3,291 | 2.81 |
| Georgia Honor | GA | 2,983 | 3.68 |
| Senate Majority PAC | PA | 2,780 | 3.79 |
| Wisconsin Truth PAC | WI | 2,779 | 2.87 |
| Senate Majority PAC | AZ | 2,528 | 1.63 |
| One Nation | NV | 2,462 | 2.42 |
| Democratic Senatorial Campaign Committee (DSCC) | AZ | 2,339 | 3.37 |
| Figures are from August 8, 2022, to September 4, 2022. Numbers include broadcast television for all sponsors. CITE SOURCE OF DATA AS: Kantar/CMAG with analysis by the Wesleyan Media Project. |
|||
Warnock Top Senate Ad Spender This Cycle with Over $9M on Facebook and Google
The Wesleyan Media Project is also tracking ad spending in Senate races for a wider set of venues beyond broadcast television. This includes satellite and local cable TV along with digital advertising on Facebook and Google. Table 2 reports those totals for the entire cycle to date for candidates entering the general election, focusing on candidate spending only. The results tell a similar story as in Table 1. Democratic candidates hold 8 of the top 10 spots as far as total ad spending. Senator Raphael Warnock of Georgia tops the list, with over $35 million in ad spending in the full cycle, which includes more than $9M on Facebook and Google. He is followed by Val Demings, the Democratic nominee in Florida, with over $23 million in spending, and Democratic Senator Mark Kelly in Arizona, with over $21 million in spending. Mehmet Oz in Pennsylvania and Ron Johnson in Wisconsin are the only Republicans to make the top ten.
The amount of digital spending varies considerably across these candidates, with Warnock, Demings and Kelly spending over a quarter of their ad spending on Facebook and Google ads. By contrast, less than 5 percent of Oz’s advertising has been on digital. A few candidates, such as John Kennedy in Louisiana and Michael Franken in Iowa, have spent most of their ad dollars on digital platforms.
“We’ve seen in recent cycles digital advertising grow to become a critical component of many campaigns,” said Michael Franz, co-director of the Wesleyan Media Project. “In competitive Senate races especially, heavy Facebook and Google spending seems increasingly common.”
Table 2: Top Candidate Advertisers in Senate Races (2021-2022)
| State | Party | Sponsor | Broadcast TV Cost (in $Ms) | Other TV & Radio Cost (in $Ms) | Facebook Cost (in $Ms) | Google Cost (in $Ms) | Total Cost (in $Ms) | Digital % |
|---|---|---|---|---|---|---|---|---|
| GA | DEM | Warnock, Raphael | 20.14 | 6.14 | 4.48 | 4.53 | 35.29 | 25.5% |
| FL | DEM | Demings, Val | 12.69 | 1.87 | 6.67 | 2.14 | 23.36 | 37.7% |
| AZ | DEM | Kelly, Mark | 12.22 | 3.9 | 3.49 | 2.08 | 21.69 | 25.7% |
| OH | DEM | Ryan, Tim | 11.33 | 1.53 | 1.9 | 1.26 | 16.02 | 19.7% |
| PA | REP | Oz, Mehmet | 11.54 | 2.97 | 0.35 | 0.37 | 15.23 | 4.7% |
| PA | DEM | Fetterman, John | 8.57 | 2.81 | 2.26 | 0.99 | 14.62 | 22.2% |
| NV | DEM | Masto, Catherine Cortez | 10.64 | 2.58 | 0.66 | 0.59 | 14.46 | 8.6% |
| NC | DEM | Beasley, Cheri | 6.77 | 1.95 | 0.62 | 0.82 | 10.16 | 14.2% |
| NH | DEM | Hassan, Maggie | 4.88 | 2.69 | 0.75 | 0.55 | 8.87 | 14.7% |
| WI | REP | Johnson, Ron | 4.52 | 2.31 | 0.38 | 0.44 | 7.64 | 10.7% |
| WI | DEM | Barnes, Mandela | 5.95 | 0.33 | 0.62 | 0.72 | 7.61 | 17.6% |
| GA | REP | Walker, Herschel | 2.37 | 2.48 | 1.26 | 0.53 | 6.64 | 27.0% |
| AL | REP | Britt, Katie | 2.11 | 2.4 | 0.08 | 0.09 | 4.68 | 3.6% |
| WA | DEM | Murray, Patty | 2.32 | 1.14 | 0.14 | 0.5 | 4.1 | 15.8% |
| MO | DEM | Valentine, Trudy Busch | 2.99 | 0.83 | 0.12 | 0.03 | 3.97 | 3.8% |
| AZ | REP | Masters, Blake | 2.55 | 0.55 | 0.01 | 0.02 | 3.13 | 0.8% |
| CO | DEM | Bennet, Michael | 1.74 | 0.53 | 0.67 | 0.18 | 3.12 | 27.2% |
| FL | REP | Rubio, Marco | 1.3 | 0.29 | 0.89 | 0.25 | 2.73 | 41.7% |
| LA | REP | Kennedy, John | 0.07 | 0 | 2.15 | 0.39 | 2.61 | 97.3% |
| OK | REP | Mullin, Markwayne | 1.46 | 0.95 | 0 | 0.02 | 2.44 | 0.1% |
| AR | REP | Boozman, John | 1.45 | 0.76 | 0.2 | 0 | 2.4 | 8.2% |
| IA | DEM | Franken, Michael | 0.74 | 0.18 | 1.35 | 0.07 | 2.35 | 60.8% |
| NC | REP | Budd, Ted | 1.21 | 0.81 | 0.15 | 0.13 | 2.3 | 12.0% |
| CO | REP | O'Dea, Joe | 1.06 | 0.71 | 0.19 | 0.1 | 2.06 | 14.0% |
| OH | REP | Vance, JD | 1.51 | 0.25 | 0.02 | 0.23 | 2.01 | 12.5% |
| CT | DEM | Blumenthal, Dick | 0.85 | 0.68 | 0 | 0.03 | 1.56 | 2.0% |
| WA | REP | Smiley, Tiffany | 0.86 | 0.5 | 0.11 | 0.05 | 1.52 | 7.5% |
| MD | DEM | Van Hollen, Chris | 0.84 | 0.39 | 0.05 | 0 | 1.28 | 4.1% |
| NV | REP | Laxalt, Adam | 0.32 | 0.48 | 0.15 | 0.31 | 1.27 | 36.9% |
| AK | REP | Murkowski, Lisa | 0.42 | 0.42 | 0.12 | 0.19 | 1.15 | 27.0% |
| NY | DEM | Schumer, Chuck | 0 | 0 | 0.77 | 0.27 | 1.04 | 100.0% |
| KY | REP | Paul, Rand | 0 | 0.01 | 0.63 | 0.34 | 0.98 | 98.9% |
| UT | REP | Lee, Mike | 0.63 | 0.14 | 0.14 | 0.06 | 0.96 | 20.1% |
| IL | DEM | Duckworth, Tammy | 0 | 0 | 0.74 | 0.01 | 0.75 | 100.0% |
| KY | DEM | Booker, Charles | 0.06 | 0.09 | 0.53 | 0.02 | 0.70 | 78.6% |
| UT | UN | Mcmullin, Evan | 0.44 | 0.13 | 0.11 | 0 | 0.68 | 16.0% |
| VT | DEM | Welch, Peter | 0.32 | 0.14 | 0.17 | 0.07 | 0.70 | 34.3% |
| SC | REP | Scott, Tim | 0 | 0 | 0.45 | 0.18 | 0.63 | 100.0% |
| MO | REP | Schmitt, Eric | 0.4 | 0.07 | 0.11 | 0.02 | 0.6 | 21.4% |
| IN | REP | Young, Todd | 0 | 0.27 | 0.3 | 0.02 | 0.59 | 54.2% |
| IA | REP | Grassley, Chuck | 0.18 | 0.16 | 0.21 | 0.03 | 0.58 | 41.4% |
| OK | REP | Lankford, James | 0.5 | 0.06 | 0.01 | 0.01 | 0.58 | 3.6% |
| CA | DEM | Padilla, Alex | 0 | 0 | 0.13 | 0.44 | 0.57 | 100.0% |
| HI | DEM | Schatz, Brian | 0.25 | 0.25 | 0.03 | 0.04 | 0.57 | 11.1% |
| ID | REP | Crapo, Mike | 0.12 | 0.08 | 0.11 | 0.13 | 0.44 | 54.6% |
| NH | REP | Morse, Chuck | 0.22 | 0.13 | 0.03 | 0 | 0.39 | 9.1% |
| CT | REP | Levy, Leora | 0.24 | 0.12 | 0 | 0.01 | 0.37 | 3.0% |
| SD | REP | Thune, John | 0.12 | 0.11 | 0.01 | 0.01 | 0.25 | 9.0% |
| NH | REP | Mansharamani, Vikram | 0.14 | 0.07 | 0.02 | 0 | 0.23 | 9.6% |
| AK | REP | Tshibaka, Kelly | 0.06 | 0.14 | 0 | 0.01 | 0.22 | 0.0% |
| OR | DEM | Wyden, Ron | 0.04 | 0.05 | 0.02 | 0 | 0.1 | 15.4% |
| NH | REP | Smith, Kevin H. | 0 | 0 | 0.04 | 0.01 | 0.05 | 100.0% |
| NH | REP | Bolduc, Don | 0 | 0.01 | 0.03 | 0 | 0.04 | 79.9% |
| OK | DEM | Horn, Kendra | 0 | 0.01 | 0.02 | 0.01 | 0.04 | 75.5% |
| KS | REP | Moran, Jerry | 0.02 | 0 | 0.02 | 0 | 0.04 | 47.5% |
| LA | DEM | Chambers, Gary Jr. | 0 | 0 | 0.04 | 0 | 0.04 | 100.0% |
| IN | DEM | Mcdermott, Thomas M. Jr | 0 | 0 | 0.03 | 0 | 0.03 | 100.0% |
| NH | REP | Fenton, Bruce | 0 | 0 | 0.03 | 0 | 0.03 | 100.0% |
| VT | REP | Malloy, Gerald | 0 | 0.03 | 0 | 0 | 0.03 | 6.0% |
| CA | REP | Meuser, Mark | 0 | 0 | 0.02 | 0 | 0.03 | 100.0% |
| IL | REP | Salvi, Kathy Raye | 0 | 0 | 0.02 | 0.01 | 0.03 | 100.0% |
| LA | DEM | Mixon, Luke | 0 | 0 | 0.01 | 0 | 0.01 | 100.0% |
| NY | REP | Pinion, Joseph III | 0 | 0 | 0.01 | 0 | 0.01 | 100.0% |
| SD | DEM | Bengs, Brian L | 0 | 0 | 0.01 | 0 | 0.01 | 100.0% |
| KS | DEM | Holland, Mark R. Rev. | 0 | 0 | 0.01 | 0 | 0.01 | 100.0% |
| AR | DEM | James, Natalie | 0 | 0 | 0.01 | 0 | 0.01 | 100.0% |
| FL | NPA | Nguyen, Quoc Tuan Mr. | 0 | 0 | 0 | 0 | 0 | 100.0% |
| OK | DEM | Horn, Madison | 0 | 0 | 0 | 0 | 0 | 100.0% |
| NC | GRE | Hoh, Matthew Patrick Mr | 0 | 0 | 0 | 0 | 0 | 100.0% |
| MO | REP | Smith, Jason T | 0 | 0 | 0 | 0 | 0 | 100.0% |
| NV | NPA | Destin, Joseph J | 0 | 0 | 0 | 0 | 0 | 100.0% |
| ID | UN | Cleveland, Scott Oh | 0 | 0 | 0 | 0 | 0 | 100.0% |
| MO | IND | Wood, John Frederick | 0 | 0 | 0 | 0 | 0 | 100.0% |
| IN | LIB | Sceniak, James | 0 | 0 | 0 | 0 | 0 | 100.0% |
| AL | DEM | Boyd, Willie Eugene Dr. Jr. | 0 | 0 | 0 | 0 | 0 | 100.0% |
| HI | REP | McDermott, Robert C | 0 | 0 | 0 | 0 | 0 | 100.0% |
| ID | DEM | Roth, David Jordan | 0 | 0 | 0 | 0 | 0 | 100.0% |
| FL | NNE | Quiles, Moses J | 0 | 0 | 0 | 0 | 0 | 100.0% |
| LA | DEM | Steib, Syrita | 0 | 0 | 0 | 0 | 0 | 100.0% |
| AK | DEM | Chesbro, Patricia | 0 | 0 | 0 | 0 | 0 | 100.0% |
| IN | DEM | Khaaliq, Haneefah | 0 | 0 | 0 | 0 | 0 | 100.0% |
| ND | DEM | Christiansen, Katrina | 0 | 0 | 0 | 0 | 0 | 100.0% |
| OR | UN | Verde, Thomas X Txv | 0 | 0 | 0 | 0 | 0 | 100.0% |
| OR | REP | Perkins, Jo Rae | 0 | 0 | 0 | 0 | 0 | 100.0% |
| TV and radio figures are from January 6, 2021, to September 4, 2022. Numbers include broadcast television, local and national cable, radio, and satellite television. Facebook figures are from January 6, 2021, to September 3, 2022. Google figures are from January 10, 2021, to September 3, 2022. Spending figures smaller than $5,000 will show as $0 in this table. Table includes candidates heading into the general election. Candidate status provided by OpenSecrets and the Wesleyan Media Project. CITE SOURCE OF DATA AS: Kantar/CMAG (for TV and radio) and the Google and Facebook Ad Libraries (for digital) with analysis by the Wesleyan Media Project. |
||||||||
Advertisers in FL, TX, WI, PA, OR, and GA Top the List for Gov Sponsors by Volume
Table 3 looks at broadcast TV totals in gubernatorial campaigns over the last month. The results show that almost 13,000 spots backing Florida Governor Ron DeSantis in his reelection campaign have aired in the past month, making the Florida Republican Party the top advertiser in a gubernatorial race. DeSantis’s Democratic opponent, Charlie Crist, has aired 7,760 spots.
Texas governor Greg Abbott is second on the list of top advertisers in governor races, having aired almost 11,000 spots in the last four weeks. By contrast, our tracking reveals only 6 spots from his Democratic opponent, Beto O’Rourke, during the same time period.
The three-way race for governor in Oregon is also turning into a barnburner, with about 6,000 airings from Democrat Tina Kotek, about 4,000 from independent (and former Democrat) Betsy Johnson and about 3,000 spots from Republican Christine Drazan.
Table 3: Top Governor Race Advertisers on Television by Volume and Spending (August 8 to September 4)
| Sponsor | State | Airings | Est. Cost (in $Ms) |
|---|---|---|---|
| Florida Republican Party* | FL | 12,912 | 7.89 |
| Abbott, Greg | TX | 10,976 | 3.80 |
| Crist, Charlie | FL | 7,760 | 1.63 |
| Kotek, Tina | OR | 5,967 | 1.58 |
| Evers, Tony | WI | 5,505 | 1.48 |
| Shapiro, Josh | PA | 5,353 | 2.93 |
| Abrams, Stacey & One Georgia Inc | GA | 4,996 | 2.18 |
| Fried, Nikki | FL | 4,653 | 1.87 |
| Whaley, Nan | OH | 4,503 | 0.88 |
| Alliance for Common Sense | WI | 4,155 | 2.30 |
| Michels, Tim | WI | 4,094 | 1.81 |
| Kemp, Brian & Georgians First Leadership Committee | GA | 4,047 | 1.93 |
| Johnson, Betsy | OR | 4,022 | 1.30 |
| Pritzker, JB | IL | 3,962 | 2.36 |
| Put Michigan First | MI | 3,742 | 3.74 |
| Drazan, Christine | OR | 3,094 | 1.00 |
| Abrams, Stacey | GA | 2,965 | 2.03 |
| RGA Right Direction PAC | OH | 2,818 | 1.71 |
| Alliance for a Better Minnesota Action Fund | MN | 2,386 | 2.33 |
| Figures are from August 8, 2022, to September 4, 2022. Numbers include broadcast television for all sponsors. *The FL GOP ads note in their “paid for by” tagline that Ron DeSantis approved the content in advance. As such, these ads might be considered coordinated ads with the DeSantis campaign. CITE SOURCE OF DATA AS: Kantar/CMAG with analysis by the Wesleyan Media Project. |
|||
2022 Senate Advertising More Positive than Past Decade
In what may be a surprise, the tone of advertising in Senate races in 2022 is more positive than in past election cycles (Figure 1). About a third (32 percent) of ads airing in Senate races this year have been negative, down from 46 percent of ads in 2012. More than half of ads (52 percent) have been positive this year, with the remainder contrast ads—those that both support a favored candidate and attack an opponent. (In these calculations, because many ads in the cycle-to-date are from primary campaigns, negative ads often involve attacks on primary opponents within a party, not just attacks on an opponent across the aisle.)
“Senate races in 2022 have had more positive advertising so far as a proportion of all ads on air and fewer pure attack ads on opponents than any prior cycle going back to 2012,” said Erika Franklin Fowler, co-director of the Wesleyan Media Project. “This may not necessarily mean that advertising feels more positive – since attacks on an opposing party are not counted in this traditional measure – but it does mean that candidates are seeking to define themselves and giving viewers reasons to vote for them.”
Figure 1: Tone of Advertising in U.S. Senate Races (2012-2022)
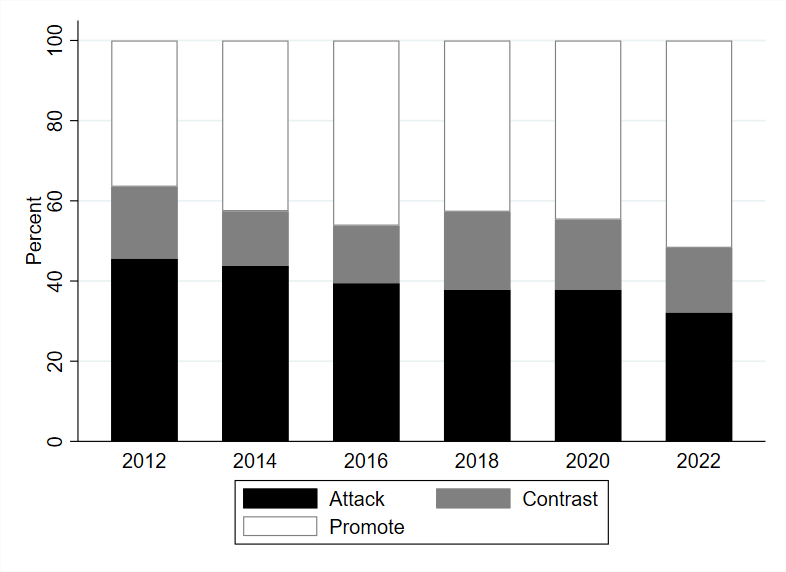
Numbers include ads aired on broadcast television between January 6 of the off-year through September 4 of the election year for each cycle.
CITE SOURCE OF DATA AS: Kantar/CMAG with analysis by the Wesleyan Media Project.
The trend toward more positive campaigns is not evident in U.S. House races, where the percentage of positive ads cycle-to-date is 60 percent, which is very similar to past years, with the notable exception of the 2016 cycle that featured even more positive ads by this point (Figure 2). Pure attack ads comprise roughly a quarter of all U.S. House ads so far, which is slightly higher than the prior record of 23 percent set in the 2014 midterms.
Figure 2: Tone of Advertising in U.S. House Races (2012-2022)
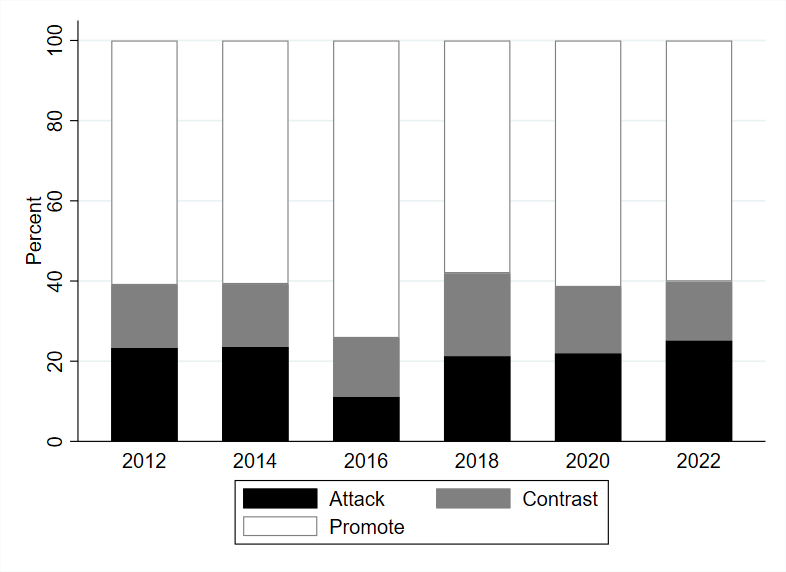
Numbers include ads aired on broadcast television between January 6 of the off-year through September 4 of the election year for each cycle.
CITE SOURCE OF DATA AS: Kantar/CMAG with analysis by the Wesleyan Media Project.
Advertising in gubernatorial races this cycle (Figure 3) has been less positive than in the 2018 midterms, but roughly equal to the 2014 midterms (45 percent). The percentage of attack ads (26 percent) is higher than in 2018 (21 percent) but lower than the 2014 midterms (36 percent). Including contrast advertising, however, the 2022 midterms edge out the 2014 midterms with a slightly higher proportion of advertising containing an attack (55 percent compared to 54 percent).
Figure 3: Tone of Advertising in Gubernatorial Races (2014, 2018, 2022)
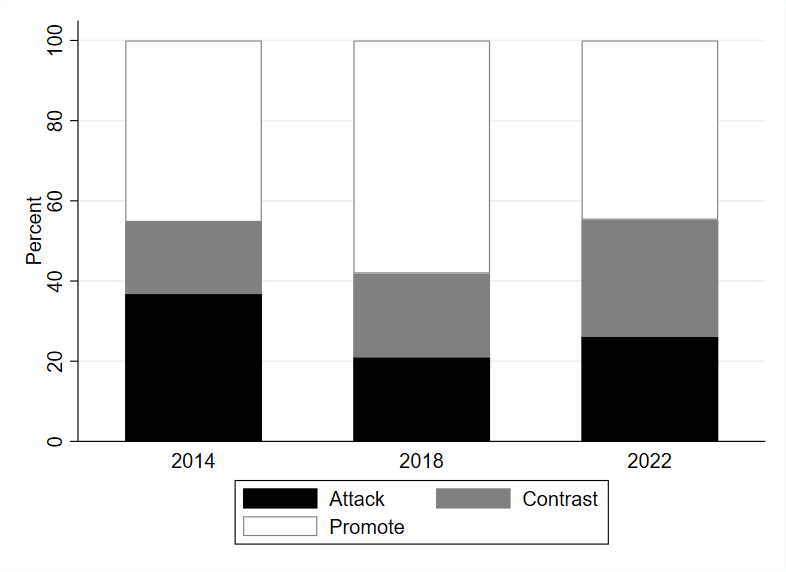
Numbers include ads aired on broadcast television between January 6 of the off-year through September 4 of the election year for each cycle.
CITE SOURCE OF DATA AS: Kantar/CMAG with analysis by the Wesleyan Media Project.
One Nation, Senate Majority PAC Leading Group Advertisers
In partnership with OpenSecrets, the Wesleyan Media Project also tracks outside group ad spending by the type of donor disclosure. We classify groups as full-disclosure groups (meaning they disclose contributor lists to the relevant reporting agency at the federal or state level), non-disclosing dark money groups (which are not required to disclose publicly their donors; these are most often 501c4 non-profits), and partial-disclosure groups (those that disclose donors but also accept contributions from dark money sources).
The Republican-leaning group, One Nation, has led all other groups in the volume of election advertising over the past four weeks, airing close to 14,000 spots in support of GOP Senate candidates in six highly competitive Senate races (Table 4). The group is a 501c4 non-profit and does not disclose its donors publicly. On the Democratic side, Senate Majority PAC (a partial disclosing super PAC) has aired over 7,700 spots during the same time period. Both groups are investing in Arizona, New Hampshire, Nevada and Wisconsin, but One Nation has been on the air in Georgia and Ohio, while Senate Majority PAC has advertised in North Carolina and Pennsylvania.
Notably, One Nation is aligned with the Senate Leadership Fund, and Majority Forward is aligned with Senate Majority PAC. More specifically, One Nation and Majority Forward are the top donors (and as such, dark money contributors) to their related super PACs. This is what makes a super PAC a partial disclosing one.
The Congressional Leadership Fund, also a partial disclosing super PAC, has also been advertising heavily during the past month, airing over 4,500 spots on behalf of Republican candidates in eleven different U.S. House races.
Many groups have been active in only one race over the last month. For example, the Alliance for Common Sense—a partial disclosing 527 organization—has only been active in the Wisconsin governor’s race. Put Michigan First, a fully disclosing independent expenditure group, has only aired ads in the Michigan governor’s race.
Table 4: Top Group Advertisers on Television by Volume (August 8 to September 4)
| Sponsor | Airings | Races | Affiliation | Group type |
|---|---|---|---|---|
| One Nation | 13,826 | AZ-Sen, GA-Sen, NH-Sen, NV-Sen, OH-Sen, WI-Sen | Republican | 501c/non-disclosing |
| Senate Majority PAC | 7,706 | AZ-Sen, NC-Sen, NH-Sen, NV-Sen, PA-Sen, WI-Sen | Democrat | super PAC/partial disclosing |
| Congressional Leadership Fund | 4,511 | CT2, IN1, ME2, MI7, MI8, NH1, NY19, NY22, PA8, VA2, WA8 | Republican | super PAC/partial disclosing |
| Alliance for Common Sense | 4,155 | WI-Gov | Democrat | 527/partial |
| Duty and Honor | 3,830 | WI-Sen, NC-Sen, IA-Sen | Democrat | 501c/non-disclosing |
| Put MI First | 3,742 | MI-Gov | Democrat | State IE Comm./full disclosure |
| School Freedom Fund | 3,645 | OK2 | Republican | super PAC/full |
| Georgia Honor | 2,983 | GA-Sen | Democrat | super PAC/partial |
| Wisconsin Truth PAC | 2,779 | WI-Sen | Republican | super PAC/full |
| Alliance for a Better Minnesota Action Fund | 2,386 | MN-Gov | Democrat | State IE Comm./full disclosure |
| Senate Leadership Fund | 2,273 | PA-Sen | Republican | super PAC/partial |
| Opportunity Matters Fund | 2,102 | NC-Sen, WI-Sen, IA1, IA2 | Republican | super PAC/full |
| Kansas Values Institute | 1,918 | KS-Gov | Democrat | 501c/non-disclosing |
| American Liberty Action PAC | 1,902 | FL7, NH2, NY23 | Republican | super PAC/full |
| Fund for a Working Congress | 1,833 | OK2 | Republican | super PAC/partial |
| American Leadership Action | 1,815 | PA-Sen | Republican | super PAC/full |
| People Who Play by the Rules PAC | 1,756 | IL-Gov | Republican | State IE Comm./full disclosure |
| Club for Growth Action | 1,626 | WI-Gov, NV-Sen, UT-Sen, FL13, WY1 | Republican | super PAC/partial |
| State Solutions, Inc. | 1,615 | WI-Gov | Republican | 501c/non-disclosing |
| A Stronger New Mexico | 1,458 | NM-Gov | Democrat | 527/full |
| American Chemistry Council | 1,288 | AR-Sen, TX2, TX7, OH6 | Both | 501c/partial |
| Get Families Back to Work | 1,243 | NM-Gov, NV-Gov | Republican | PAC/yes |
| Stronger CT | 1,094 | CT-Gov | Democrat | State IE Comm./full disclosure |
| A Better Wisconsin Together Political Fund | 1,089 | WI-Gov | Democrat | State IE Comm./full disclosure |
| American Jobs and Growth PAC | 1,032 | OK2 | Republican | super PAC/partial |
| Women Vote | 1,019 | WA-Sen | Democrat | super PAC/partial |
| Majority Forward | 1,002 | NH-Sen | Democrat | 501c/non-disclosing |
| Figures are from August 8 to September 4, 2022. Numbers include broadcast television for all sponsors. CITE SOURCE OF DATA AS: Kantar/CMAG with analysis by the Wesleyan Media Project. |
||||
Table 5 displays digital spending on Facebook and Google for the groups spending the most on TV from Table 4 (above) and sorts them by the largest digital spenders (groups from Table 4 not listed have no digital spending). In addition to airing the most broadcast television ads, One Nation has also spent more online than any other group by a wide margin (over $2M, with the bulk of that spending on Google). In contrast, Senate Majority PAC has only spent $74,391 on Facebook and nothing on Google. Alliance for a Better Minnesota, Georgia Honor and Wisconsin Truth PAC rank two through four in digital spending (again among the groups who have aired more than 1,000 broadcast TV ads in the last four weeks) though each has spent not even a quarter of the money One Nation has on the two largest online platforms.
Table 5: Digital Spending from Top Group Advertisers on TV (August 7 to September 3)
| Sponsor | Affiliation | Group Type | Facebook ($) | Google ($) | Total ($) |
|---|---|---|---|---|---|
| One Nation | Republican | 501c/non-disclosing | 238,791 | 1,822,200 | 2,060,991 |
| Alliance For A Better Minnesota Action Fund | Democrat | State IE Comm./full disclosure | 92,895 | 362,600 | 455,495 |
| Georgia Honor | Democrat | super PAC/partial | 105,171 | 346,600 | 451,771 |
| Wisconsin Truth PAC | Republican | super PAC/full | - | 406,600 | 406,600 |
| Congressional Leadership Fund | Republican | super PAC/partial disclosing | 202,664 | 176,900 | 379,564 |
| Senate Leadership Fund | Republican | super PAC/partial | 29,746 | 309,400 | 339,146 |
| American Chemistry Council | Both | 501c/partial | 331,689 | - | 331,689 |
| Majority Forward | Democrat | 501c/non-disclosing | 51,968 | 159,900 | 211,868 |
| Alliance For Common Sense | Democrat | 527/partial | 142,976 | 45,900 | 188,876 |
| Duty And Honor | Democrat | 501c/non-disclosing | 32,351 | 94,900 | 127,251 |
| American Liberty Action PAC | Republican | super PAC/full | 26,408 | 97,700 | 124,108 |
| A Better Wisconsin Together Political Fund | Democrat | State IE Comm./full disclosure | 56,650 | 51,300 | 107,950 |
| Kansas Values Institute | Democrat | 501c/non-disclosing | - | 83,600 | 83,600 |
| Senate Majority PAC | Democrat | super PAC/partial disclosing | 74,391 | - | 74,391 |
| People Who Play By The Rules PAC | Republican | State IE Comm./full disclosure | 66,684 | 6,000 | 72,684 |
| Opportunity Matters Fund | Republican | super PAC/full | - | 65,700 | 65,700 |
| Club For Growth Action | Republican | super PAC/partial | 51,783 | 7,700 | 59,483 |
| Women Vote | Democrat | super PAC/partial | 14,383 | 11,000 | 25,383 |
| Stronger CT | Democrat | State IE Comm./full disclosure | - | 20,000 | 20,000 |
| Figures are from August 7 to September 3, 2022 for Facebook and Google. CITE SOURCE OF DATA AS: Google and Facebook Ad Libraries with analysis by the Wesleyan Media Project. |
|||||
Dark Money Accounts for about 1 in 3 Outside Group Ads
Table 6 shows the sponsorship of advertising by race and party in the full cycle-to-date. In races for governor, full disclosure is typical especially among groups that back Democratic candidates. But in races for the U.S. Senate, only 18.5 percent of the pro-Democratic ad airings were from groups that fully disclose their donors. Fully disclosing pro-Democratic groups account for only 31 percent of group ads backing Democrats in House races. By and large, there is no consistent pattern across races and parties in terms of groups and their donor disclosure.
These distributions across parties are also largely unchanged from the cycle-to-date numbers reported in WMP’s report from August. This is true even though groups in the last four weeks aired about 100,000 additional spots in congressional and gubernatorial campaigns.
Table 6: Ad Airings on Behalf of Democrats and Republicans by Outside Groups
| Full | Partial | None | Total | |
|---|---|---|---|---|
| GOVERNOR | ||||
| Pro-Dem | 71,728 | 16,929 | 18,803 | 107,460 |
| row % | 66.7% | 15.8% | 17.5% | |
| Pro-GOP | 36,277 | 13,454 | 26,275 | 76,006 |
| row % | 47.7% | 17.7% | 34.6% | |
| U.S. SENATE | ||||
| Pro-Dem | 23,906 | 18,554 | 86,743 | 129,203 |
| row % | 18.5% | 14.4% | 67.1% | |
| Pro-GOP | 122,149 | 58,055 | 51,655 | 231,859 |
| row % | 52.7% | 25.0% | 22.3% | |
| U.S. HOUSE | ||||
| Pro-Dem | 27,901 | 24,857 | 36,155 | 88,913 |
| row % | 31.4% | 28.0% | 40.7% | |
| Pro-GOP | 52,717 | 30,933 | 37,877 | 121,527 |
| row % | 43.4% | 25.5% | 31.2% | |
| TOTAL | 334,678 | 162,782 | 257,508 | 754,968 |
| 44.3% | 21.6% | 34.1% | ||
| Figures are from January 6, 2021, to September 4, 2022. Numbers include broadcast television for all sponsors. CITE SOURCE OF DATA AS: Kantar/CMAG with analysis by the Wesleyan Media Project. |
||||
Budget, Inflation Top GOP Issues in Senate Races
Republican advertising in Senate races over the past month has been focused on the budget, the economy and inflation, with almost half of pro-GOP ads mentioning each issue (Table 7). Democratic advertising in the Senate, on the other hand, has been more scattered, with jobs, taxes and healthcare being the top issues—each mentioned in between 20 and 25 percent of pro-Democratic ads.
Table 7: Top Issues in Senate Races by Party Lean (August 8 to September 4)
| Issue | Pro-Dem % | Issue | Pro-GOP % |
|---|---|---|---|
| Jobs | 23.50% | Budget | 54.70% |
| Taxes | 21.70% | Economy | 48.60% |
| Healthcare | 20.30% | Inflation | 48.60% |
| Public Safety | 18.60% | Public Safety | 37.20% |
| Social Security | 18.30% | Oil | 24.60% |
| Prescription Drugs | 17.50% | Coronavirus | 21.90% |
| Manufacturing | 15.10% | Immigration | 20.30% |
| Abortion | 12.00% | Taxes | 15.50% |
| Medicare | 11.80% | Drugs | 14.80% |
| Budget | 10.50% | Education | 9.60% |
| Figures are from August 8 to September 4, 2022. Numbers include broadcast television for all sponsors. CITE SOURCE OF DATA AS: Kantar/CMAG with analysis by the Wesleyan Media Project. |
|||
Abortion Top Democratic Issue in House Ads
While abortion was not mentioned heavily in Senate advertising, it features prominently in pro-Democratic advertising in House races (Table 8), with almost a third of pro-Democratic ads mentioning the issue. On the Republican side, the issue emphasis looks similar to the Senate, with a strong focus on the economy, inflation and the budget.
Table 8: Top Issues in House Races by Party Lean (August 8 to September 4)
| Issue | Pro-Dem % | Issue | Pro-GOP % |
|---|---|---|---|
| Abortion | 31.20% | Economy | 40.50% |
| Economy | 21.50% | Inflation | 39.30% |
| Jobs | 18.60% | Budget | 28.80% |
| Prescription Drugs Cost | 17.20% | Oil | 26.50% |
| Taxes | 16.60% | Taxes | 24.30% |
| Inflation | 16.00% | Public Safety | 19.80% |
| Budget | 13.20% | Immigration | 19.20% |
| Medicare | 12.80% | Gun Control/Guns | 13.20% |
| Oil | 12.50% | Jobs | 11.20% |
| Supreme Court | 12.20% | Education | 10.50% |
| Figures are from August 8 to September 4, 2022. Numbers include broadcast television for all sponsors. CITE SOURCE OF DATA AS: Kantar/CMAG with analysis by the Wesleyan Media Project. |
|||
Abortion Dominates Democratic Ads in Gov Races; Republicans Focus on Taxes
In races for governor over the past month, abortion has been the primary issue focus of pro-Democratic advertising, with 43 percent of Democratic ads mentioning the topic (Table 9). Republican advertising has been largely silent, with the issue of taxes and the budget taking top billing in pro-Republican ads.
Table 9: Top Issues in Governor Races by Party Lean (August 8 to September 4)
| Issue | Pro-Dem % | Issue | Pro-GOP % |
|---|---|---|---|
| Abortion | 43.20% | Taxes | 38.90% |
| Healthcare | 28.00% | Budget | 35.40% |
| Budget | 27.90% | Public Safety | 30.70% |
| Education | 25.20% | Jobs | 30.50% |
| Women's Rights | 23.60% | Education | 21.10% |
| Economy | 18.50% | Economy | 19.80% |
| Taxes | 18.40% | Coronavirus | 18.40% |
| Inflation | 15.00% | Inflation | 16.70% |
| Gun Control/Guns | 12.60% | Oil | 10.10% |
| Campaign Finance | 10.80% | Immigration | 6.60% |
| Figures are from August 8 to September 4, 2022. Numbers include broadcast television for all sponsors. CITE SOURCE OF DATA AS: Kantar/CMAG with analysis by the Wesleyan Media Project. |
|||
Pace of 2022 Television Advertising is Slowing in U.S. Senate Contests
In contrast to earlier this year when we reported record shattering volumes of ad airings compared to earlier cycles, broadcast television advertising in U.S. Senate races has cooled down. The number of broadcast ads in this cycle now trails the 2020 cycle-to-date tally (see Figure 4, right panel). However, compared to advertising for the same Senate seats six years ago, advertising is still well ahead of the 2016 totals at this point. On the House side, 2022 ad volumes on television are still outpacing all of the prior five cycles spanning the last decade of election advertising (Figure 4, left panel).
Figure 4: Volume of Advertising in U.S. House and U.S. Senate Races (Cycle-to-Date)
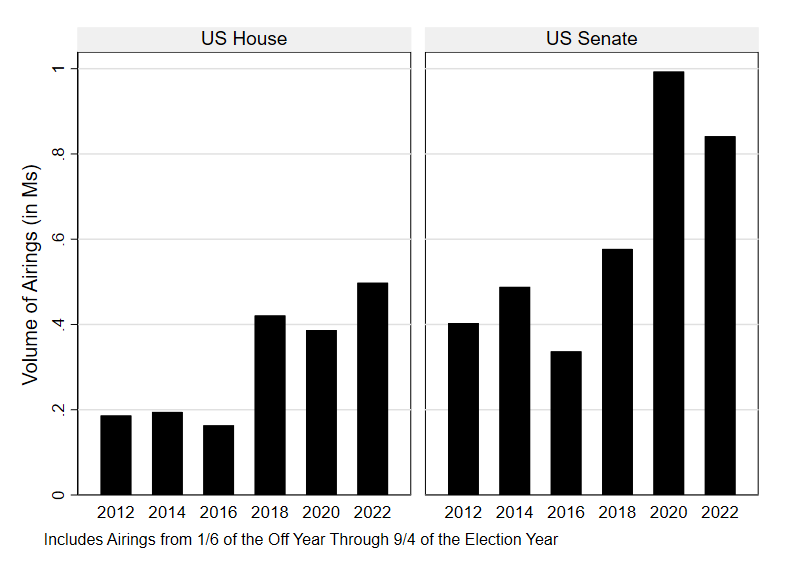
CITE SOURCE OF DATA AS: Kantar/CMAG with analysis by the Wesleyan Media Project.
Figure 5 shows that compared to the prior two midterm cycles, gubernatorial advertising in the 2021-2022 cycle still edges out advertising totals in 2018 at this point, although the difference is smaller, suggesting that the pace of 2022 advertising is slowing compared to earlier this summer.
Figure 5: Volume of Advertising in Gubernatorial Races (Cycle-to-Date)
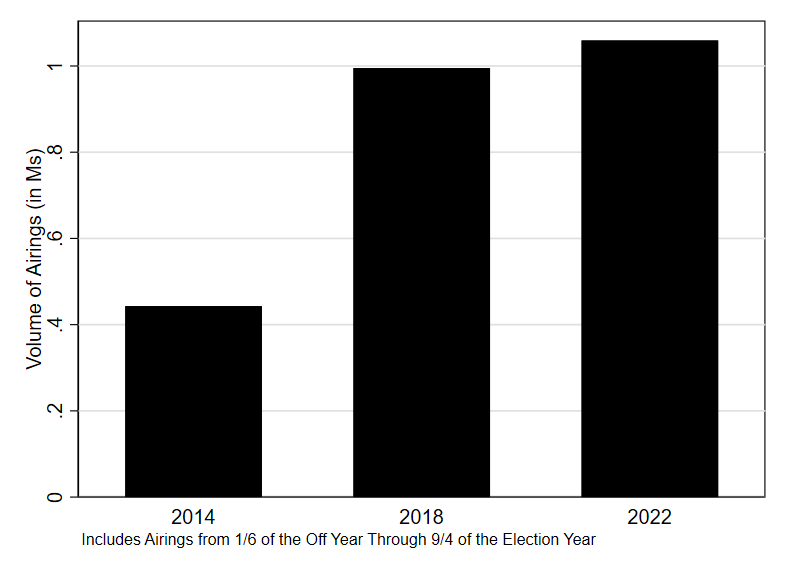
CITE SOURCE OF DATA AS: Kantar/CMAG with analysis by the Wesleyan Media Project.
About the Data
For television ad totals, data reported here from Kantar/CMAG (unless otherwise specified) refer to broadcast television. All cost estimates for television are precisely that: estimates.
For Facebook ads, data come from the aggregate reports, which provide spending information for each page name and disclaimer combination. Totals in this report reflect spending between January 6, 2021, or August 7, 2022, and September 3, 2022. These totals are calculated by subtracting the reported cumulative spending (as reported by Facebook as the total spent since May 2018) for the September 3, 2022 report and subtracting the cumulative spending reported for January 5, 2021, or August 6, 2022.
In Table A (click here to download), we list the page names/disclaimer rows from the Facebook aggregate reports that we identified for this report. It is possible that we missed some spending from a Facebook page affiliated with a candidate or group. This is exacerbated by the absence of EIN or FEC identifiers in the Facebook reports.
For Google ads, we downloaded the weekly reports from the platform’s Transparency Report. The totals reflected in this release are current as of 9/6/22, the day on which we pulled the transparency report. Google only includes spending in federal and state races and only includes weekly totals but lists the sponsor’s EIN or FEC committee ID. Google spending is from the following time periods: January 6, 2021 or August 7, 2022 and September 3, 2022.
In Table B (click here to download), we list the advertiser name for all entities used in this report to calculate Google spending totals.
About This Report
The Wesleyan Media Project provides real-time tracking and analysis of all political television advertising in an effort to increase transparency in elections. Housed in Wesleyan’s Quantitative Analysis Center – part of the Allbritton Center for the Study of Public Life – the Wesleyan Media Project is the successor to the Wisconsin Advertising Project, which disbanded in 2009. It is directed by Erika Franklin Fowler, professor of government at Wesleyan University, Michael M. Franz, professor of government at Bowdoin College and Travis N. Ridout, professor of political science at Washington State University. WMP personnel include Laura Baum (Associate Director), Breeze Floyd (Research Coordinator), Pavel Oleinikov (Associate Director, QAC), Markus Neumann (Post-Doctoral Fellow), and Jielu Yao (Post-Doctoral Fellow).
Data are provided by Kantar/CMAG with analysis by the Wesleyan Media Project. The Wesleyan Media Project is partnering again this year with OpenSecrets, to provide added information on outside group disclosure and candidate status.
The Wesleyan Media Project’s digital advertising tracking is supported by the contributions of students in Delta Lab, an interdisciplinary research collaborative focusing on computationally-driven and innovative analyses and visualizations of media messaging.
Periodic releases of data will be posted on the project’s website and dispersed via Twitter @wesmediaproject. To be added to our email update list, click here.
For more information contact: media@wesleyan.edu.
About Wesleyan University
Wesleyan University, in Middletown, Conn., is known for the excellence of its academic and co-curricular programs. With more than 2,900 undergraduates and 200 graduate students, Wesleyan is dedicated to providing a liberal arts education characterized by boldness, rigor and practical idealism. For more, visit www.wesleyan.edu.


