Photo Gage Skidmore/Flickr
Outside Groups Airing a Third of All Ads; Spotlight on Abortion, Immigration, and Guns
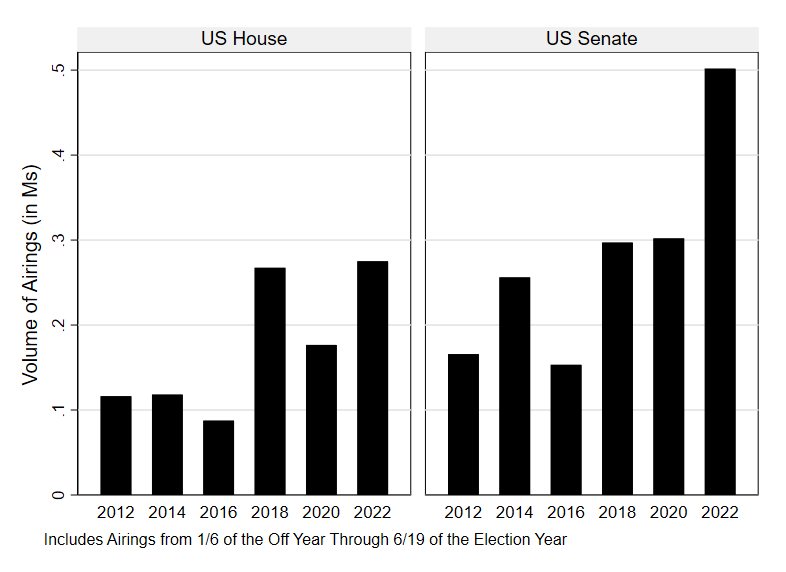
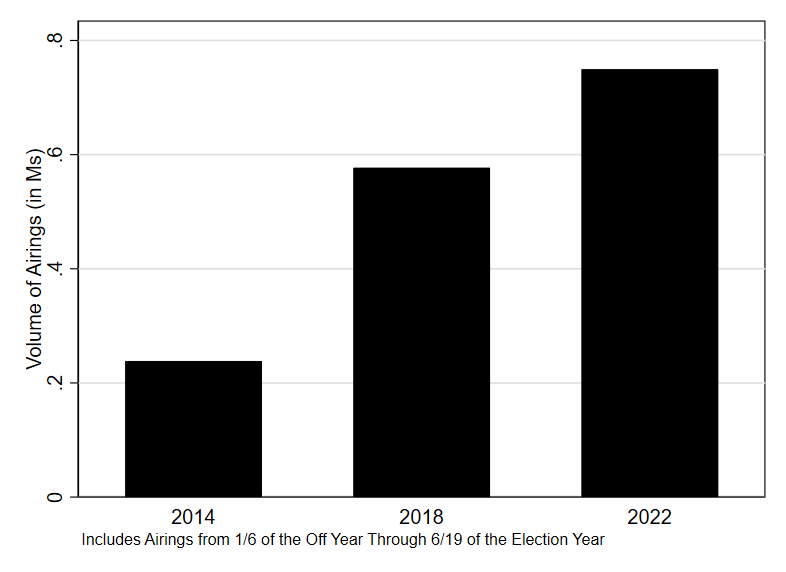
(MIDDLETOWN, CT) June 23, 2022 – Driven by competitive primaries for U.S. Senate seats and gubernatorial races, the volume of advertising on television so far in the 2022 midterms is shattering records, according to a new report by the Wesleyan Media Project. Between January 6, 2021, and June 19, 2022, U.S. Senate contests have seen just over half a million television ad airings, which is a 66 percent increase over the volume of Senate ads in 2020 and a 227 percent increase over the volume that had aired for these same Senate contests in the 2016 elections. Gubernatorial television airings are up 30 percent from 2018 (and up 214 percent over 2014), and even television airings in U.S. House contests are up slightly (an increase of 3 percent) over the prior 2018 records during the same period.
“Given the prevalence and growth of online advertising these days, it’s hard to believe that the volume of political ads on television keeps increasing each year, but that’s exactly what we’ve seen in 2022 so far,” said Erika Franklin Fowler, co-director of the Wesleyan Media Project.
Figures 1 and 2 show the number of broadcast television ad airings to date in the 2022 election cycle and the number of such ads in the comparable period for the previous five congressional election cycles and previous two gubernatorial cycles.
Figure 1: Volume of Airings in U.S. House and U.S. Senate (Cycle-to-Date)
CITE SOURCE OF DATA AS: Kantar/CMAG with analysis by the Wesleyan Media Project.
Figure 2: Volume of Airings in Gubernatorial Races (Cycle-to-Date)
CITE SOURCE OF DATA AS: Kantar/CMAG with analysis by the Wesleyan Media Project.
Table 1 shows the volume of advertising during this election cycle broken down by office and party. Ads favoring Republican candidates have considerably outnumbered ads favoring Democratic candidates in both gubernatorial and U.S. Senate races, while there have been slightly more ad airings on behalf of Democratic candidates in U.S. House races. These totals include those sponsored by candidates, outside groups and party committees.
“Although pro-Republican advertising has dominated in the Senate and races for governor, that does not necessarily indicate that Republicans will be advantaged in the general election,” said Travis Ridout, co-director of the Wesleyan Media Project. “Much of the advertising up to this point has been directed toward highly competitive primary races.”
All told, there have been 1.53 million ad airings in Senate, House and gubernatorial races since the start of the election cycle at an estimated cost of $716.37 million. Independent groups have sponsored 31 percent of those advertisements.
Table 1: Ad Airings and Spending by Race and Party (Cycle-to-Date)
| Governor | Senate | House | ||||
|---|---|---|---|---|---|---|
| Airings | Spend (in $Ms) | Airings | Spend (in $Ms) | Airings | Spend (in $Ms) | |
| Pro-Dem | 261,548 | 136.33 | 163,730 | 83.80 | 144,033 | 66.53 |
| Pro-Rep | 481,761 | 184.11 | 337,936 | 180.28 | 129,109 | 62.87 |
| Other | 6,288 | 2.20 | 19 | 0.01 | 1,877 | 0.25 |
| Total | 749,597 | 322.64 | 501,685 | $264.09 | 275,019 | 129.65 |
| Figures are from January 6, 2021, to June 19, 2022. Numbers include broadcast television for all sponsors. CITE SOURCE OF DATA AS: Kantar Media/CMAG with analysis by the Wesleyan Media Project. |
||||||
Illinois and New York Lead Governor Races in TV Airings
In the past six weeks (May 9 through June 19), residents of Illinois have seen over 63,000 television airings, making the race for governor in that state the most ad saturated race in the country, with ad costs totaling over $37 million. The bulk of those advertisements have been aired on behalf of Republican candidates, a reflection of a competitive Republican primary in that state to be held on June 28. Republican candidate Richard Irvin has aired more than twice as many ads (28,000) as his primary opponent, Darren Bailey (12,000 spots). Airings have been abundant in New York (where there are primaries in both parties on June 28), Georgia (where primaries wrapped up on May 24 and Republican Brian Kemp and Democrat Stacey Abrams have already moved into general election mode) and Alabama (where spending was heavy up to the May 24 Republican primary).
As a percentage of ads aired in the last 6 weeks, outside groups were most active in Kansas, where incumbent Democratic Governor Laura Kelly has benefited from supportive ads from the Kansas Values Institute, which is a 501c non-profit, and in Nevada, where three outside groups waded into a competitive Republican primary held on June 14.
Table 2: Top Governor Races (May 9 to June 19)
| Race | Airings | Pro-Dem Airings | Pro-Rep Airings | Est. Cost (in $Ms) | % Outside Group Airings |
|---|---|---|---|---|---|
| IL | 63,502 | 17,909 | 45,593 | 37.14 | 2.2% |
| NY | 23,147 | 8,241 | 14,906 | 7.96 | 0.0% |
| GA | 15,511 | 7,451 | 8,060 | 8.49 | 13.3% |
| AL | 13,141 | 0 | 13,141 | 3.64 | 12.4% |
| PA | 11,428 | 7,376 | 4,052 | 9.20 | 13.1% |
| WI | 10,888 | 2,674 | 8,214 | 6.03 | 22.7% |
| OR | 10,591 | 1,877 | 4,996 | 2.73 | 0.0% |
| NM | 8,697 | 4,564 | 4,133 | 1.65 | 3.3% |
| NV | 7,711 | 0 | 7,711 | 3.55 | 38.4% |
| CA | 7,339 | 6,104 | 1,059 | 2.49 | 0.0% |
| KS | 6,020 | 3,859 | 2,161 | 3.75 | 41.1% |
| AZ | 5,445 | 411 | 5,034 | 3.63 | 15.8% |
| MD | 4,581 | 4,221 | 360 | 3.16 | 6.4% |
| MI | 3,500 | 844 | 2,656 | 2.67 | 27.7% |
| ID | 2,891 | 0 | 2,891 | .30 | 0.0% |
| OK | 2,891 | 0 | 2,891 | 1.25 | 36.8% |
| NE | 2,580 | 0 | 2,580 | .52 | 28.2% |
| CT | 2,173 | 1,490 | 683 | .94 | 0.4% |
| SC | 1,686 | 1,035 | 651 | .41 | 0.0% |
| AR | 1,532 | 44 | 1,488 | .31 | 0.0% |
| Figures are from May 9 to June 19, 2022. Numbers include broadcast television for all sponsors. CITE SOURCE OF DATA AS: Kantar Media/CMAG with analysis by the Wesleyan Media Project. |
|||||
Alabama Senate Primary Draws Barrage of Ads
Alabama’s Republican primary for a U.S. Senate nomination, which was decided in favor of Katie Britt on Tuesday, drew substantial advertising over the past 6 weeks, with over 23,000 ad airings. Almost two-thirds of those airings were sponsored by outside groups, including the Alabama RINO PAC, a Super PAC that attacked Britt’s opponent, Mo Brooks.
Advertising for Arizona’s Senate race has also been substantial. Some of the activity concerns the August 2 Republican primary, while Democratic advertising is working to shore up incumbent Mark Kelly in a race that is expected to be very competitive in November. Nine different outside groups, in addition to the Republican Party, have aired ads in the race since early May.
Spending has also been heavy in Wisconsin during this time, where Republican Ron Johnson has received air cover from One Nation, a 501c non-profit (airing about 3,000 spots), and the Wisconsin Truth PAC (a super PAC that has sponsored 3,200 airings). These ads have aired while Democrats prepare for a primary on August 9 between several contenders, including the state’s Lieutenant Governor, Mandela Barnes.
Ad airings in Pennsylvania have tailed off significantly since the May 17 primary, with only Democratic nominee John Fetterman and the National Republican Senatorial Committee sponsoring ads since the election (and through June 19).
Of course, not all ads that candidates make end up on TV. Some ads are designed to get media attention or are posted exclusively on digital platforms. For example, to date the much-discussed RINO ad from former Governor Eric Greitens, who is running for the GOP nomination for Senate, with the election scheduled in August, had not (as of June 19) appeared on broadcast stations.
Table 3: Top U.S. Senate Races (May 9 to June 19)
| State | Airings | Dem Airings | Rep Airings | Est. Cost (in $Ms) | % Outside Group Airings |
|---|---|---|---|---|---|
| AL | 23,334 | 0 | 23,334 | 8.62 | 63.2% |
| AZ | 19,846 | 8,561 | 11,285 | 10.67 | 50.2% |
| WI | 19,554 | 10,637 | 8,917 | 11.29 | 55.3% |
| GA | 14,483 | 9,778 | 4,705 | 9.94 | 32.0% |
| PA | 12,856 | 1,788 | 11,068 | 10.39 | 41.4% |
| NC | 9,465 | 3,483 | 5,982 | 8.72 | 30.1% |
| NV | 8,462 | 5,628 | 2,834 | 4.45 | 36.0% |
| OK | 7,423 | 0 | 7,423 | 2.91 | 20.6% |
| OH | 7,404 | 7,403 | 1 | 3.42 | 0.0% |
| AR | 6,136 | 0 | 6,136 | 2.24 | 74.8% |
| CA | 4,474 | 4,474 | 0 | 1.07 | 0.0% |
| IA | 4,368 | 3,703 | 665 | .65 | 0.0% |
| NH | 3,069 | 2,075 | 994 | 2.87 | 47.5% |
| MO | 2,834 | 0 | 2,834 | 1.58 | 69.7% |
| CO | 2,557 | 2,557 | 0 | 1.57 | 100.0% |
| SD | 2,450 | 3 | 2,447 | .16 | 20.5% |
| FL | 1,937 | 1,405 | 532 | 1.65 | 28.8% |
| WA | 1,817 | 1,817 | 0 | .36 | 0.0% |
| VT | 992 | 950 | 42 | .21 | 47.0% |
| ID | 854 | 0 | 854 | .12 | 0.0% |
| Figures are from May 9 to June 19, 2022. Numbers include broadcast television for all sponsors. CITE SOURCE OF DATA AS: Kantar Media/CMAG with analysis by the Wesleyan Media Project. |
|||||
Competitive Primaries Draw Advertising in House Races
As Table 4 shows, the House races that have seen the most advertising since May 9 tend to be the ones with competitive primaries, such as the race in Texas’s 28th district between Henry Cuellar and Jessica Cisneros for the Democratic nomination, which went to a run-off election on May 24 (which Cuellar won by about 300 votes of 45,000 cast) after the March 1 primary. The run-off saw over 12,000 ad airings between May 9 and May 14. In addition, the two-incumbent contest for the Republican nomination in Illinois’ District 15 between Rodney Davis and Mary Miller has seen over 6,500 ad airings, with the primary set for June 28.
Outside groups have been very active in these top House races. Four outside groups were active in the Texas-28 run-off, including Women Vote, a super PAC supportive of Democratic female candidates. In the Illinois-15 race, seven outside groups have been on the air, including the Club for Growth, which opposes Rodney Davis.
Table 4: Top U.S. House Races (May 9 to June 19)
| Race | Airings | Pro-Dem Airings | Pro-Rep Airings | Est. Cost (in $Ms) | % Outside Group Airings |
|---|---|---|---|---|---|
| TX28 | 12,062 | 12062 | 0 | 3.21 | 40.0% |
| IL15 | 6,593 | 0 | 6,593 | 4.59 | 73.9% |
| ID02 | 5,284 | 0 | 5,284 | 1.07 | 65.6% |
| TX34 | 4,187 | 193 | 3,994 | 1.14 | 11.8% |
| OR06 | 3,528 | 3516 | 12 | 2.70 | 55.2% |
| AL05 | 3,227 | 0 | 3,227 | .89 | 18.2% |
| NC01 | 3,152 | 2063 | 1,089 | 1.81 | 69.4% |
| SC01 | 3,127 | 0 | 3,127 | 1.09 | 22.0% |
| NC13 | 3,101 | 196 | 2,905 | 2.17 | 41.5% |
| OK02 | 2,941 | 0 | 2,941 | 1.06 | 7.5% |
| SC07 | 2,927 | 0 | 2,927 | .30 | 10.1% |
| GA07 | 2,739 | 2739 | 0 | 2.49 | 36.5% |
| AK01 | 2,695 | 216 | 1,284 | .50 | 9.8% |
| CA41 | 2,237 | 1495 | 742 | .20 | 0.0% |
| NV02 | 2,063 | 0 | 2,063 | .67 | 36.3% |
| MN01 | 1,999 | 0 | 1,999 | 2.49 | 100.0% |
| PA12 | 1,970 | 1970 | 0 | 1.63 | 67.1% |
| GA02 | 1,894 | 0 | 1,894 | .66 | 58.3% |
| MT01 | 1,571 | 593 | 978 | 1.06 | 2.5% |
| CA40 | 1,545 | 0 | 1,545 | 1.86 | 34.4% |
| Figures are from May 9 to June 19, 2022. Numbers include broadcast television for all sponsors. CITE SOURCE OF DATA AS: Kantar Media/CMAG with analysis by the Wesleyan Media Project. |
|||||
Trump Still Prominent in 2022 Advertising over the Last Six Weeks
Attacks on an incumbent president are routine in midterm elections, but pro-Republican airings are not just attacking Biden; they are also promoting former president Donald Trump. Over a third of pro-Republican television ads in both U.S. Senate and U.S. House races contain pro-Trump content (37.7 percent in the Senate and 34.9 in the House) while a similar proportion of ads attack President Biden (37.6 percent in the Senate and 34.7 in the House). The pattern is slightly different in gubernatorial races where pro-Republican airings are slightly more likely to attack Biden (6.2 percent) than to promote Trump (5.3 percent).
Some pro-Democratic ads are also mentioning Trump but in an unfavorable light. U.S. House ads in favor of Democrats target Trump much more often than ads in U.S. Senate contests (13.1 percent compared to 3.6 percent), but pro-Democratic gubernatorial ads also attack the former president in 7.7 percent of airings.
Democrats Focus on Abortion; Republican Focus on Taxes and Public Safety in Gubernatorial Ads
As the country waits for an impending Supreme Court decision on abortion, about a third of advertisements favoring Democratic candidates for governor discussed the topic (33.9 percent), which is by far their top issue mention in pro-Democratic ads. These totals cover the May 9 to June 19 period. About a quarter of pro-Democratic ads discuss taxes, and another roughly 20 percent mention public safety, the budget and gun control/guns. Although not mentioned frequently, some Democratic ads reference the 2020 election.
Republican ads meanwhile are talking primarily about taxes (43 percent) followed closely by issues of public safety (40 percent). Fewer than one out of ten pro-Republican ads (8.9 percent) in gubernatorial races mention abortion.
Table 5: Top Issues in Governors Races by Party Lean (May 9 to June 19)
| Pro-Dem | Pro-Dem % | Pro-Rep | Pro-Rep % |
|---|---|---|---|
| Abortion | 33.9% | Taxes | 43.2% |
| Taxes | 24.5% | Public Safety | 39.8% |
| Public Safety | 21.4% | Budget | 35.3% |
| Budget | 19.5% | Education | 21.2% |
| Gun Control/Guns | 19.0% | Covid-19 | 16.8% |
| Jobs | 18.7% | Jobs | 14.3% |
| Education | 16.8% | Economy | 12.7% |
| Health Care | 13.0% | Campaign Finance | 12.5% |
| Voting | 11.2% | Corruption | 9.9% |
| 2020 Election | 8.8% | Immigration | 9.3% |
| Figures are from May 9 to June 19, 2022. Numbers include broadcast television for all sponsors. CITE SOURCE OF DATA AS: Kantar Media/CMAG with analysis by the Wesleyan Media Project. |
|||
Immigration Tops List of GOP Issues in U.S. House and Senate Contests; House Democrats Talk Health Care and Senate Dems Discuss the Economy
Senate ads favoring Democrats in the past six weeks have been focused on bread-and-butter issues, such as the economy, jobs, inflation and health care (see Table 6). The issue agenda is different on the Republican side, where immigration and public safety top the list of issues being discussed.
Table 6: Top Issues in U.S. Senate Races by Party Lean (May 9 to June 19)
| Pro-Dem | Pro-Dem % | Pro-Rep | Pro-Rep % |
|---|---|---|---|
| Economy | 28.2% | Immigration | 37.6% |
| Jobs | 25.1% | Public Safety | 30.0% |
| Inflation | 22.6% | Budget | 20.9% |
| Health Care | 22.1% | Abortion | 19.0% |
| Public Safety | 20.2% | Energy/Environment | 19.0% |
| Budget | 15.7% | Taxes | 17.1% |
| Technology | 15.7% | Economy | 15.9% |
| Trade | 14.8% | Inflation | 15.5% |
| Manufacturing | 14.6% | Gun control/Guns | 14.5% |
| Abortion | 14.0% | Faith/religion | 9.7% |
| Figures are from May 9 to June 19, 2022. Numbers include broadcast television for all sponsors. CITE SOURCE OF DATA AS: Kantar Media/CMAG with analysis by the Wesleyan Media Project. |
|||
On the House side, over four in every ten pro-Democratic ads mention health care with nearly a third mentioning abortion explicitly (29.1 percent). In ads favoring House Republicans, immigration takes the top spot, appearing in roughly a third of all pro-Republicans airings in the last six weeks (32.9 percent).
Table 7: Top Issues in U.S. House Races by Party Lean (May 9 to June 19)
| Pro-Dem | Pro-Dem % | Pro-Rep | Pro-Rep % |
|---|---|---|---|
| Health Care | 42.8% | Immigration | 32.9% |
| Abortion | 29.1% | Budget | 25.7% |
| Public Safety | 23.4% | Economy | 24.8% |
| Prescription Drugs | 21.4% | Energy/Environment | 21.7% |
| Budget | 19.1% | Inflation | 20.4% |
| Jobs | 17.9% | Public Safety | 19.3% |
| Campaign Finance | 17.3% | Abortion | 17.5% |
| Education | 16.4% | Taxes | 15.0% |
| Energy/Environment | 15.6% | Gun control/Guns | 15.0% |
| Voting | 14.2% | International affairs | 8.2% |
| Figures are from May 9 to June 19, 2022. Numbers include broadcast television for all sponsors. CITE SOURCE OF DATA AS: Kantar Media/CMAG with analysis by the Wesleyan Media Project. |
|||
Cycle-to-Date Issue Comparisons of Abortion, Guns, and Immigration
Abortion Mentions Increase in Senate, House Races
Table 8 shows that abortion is shaping up to be a much more important issue in 2022 than in the previous two election cycles. All told, for the entire cycle thus far, 11.3 percent of ads in House, Senate and gubernatorial races have mentioned the issue this cycle. This compares to 6.2 percent in 2020 and 6.1 percent in 2018. The only exception to the rule is in ads favoring Republicans running for governor, where mentions of abortion have decreased.
Table 8: Percentage of Ads Mentioning Abortion by Race and Favored Party
| 2022 | 2020 | 2018 | |||||||
|---|---|---|---|---|---|---|---|---|---|
| Overall % | Pro-Dem % | Pro-GOP % | Overall % | Pro-Dem % | Pro-GOP % | Overall % | Pro-Dem % | Pro-GOP % | |
| Governor | 9.75 | 16.79 | 6.06 | 5.68 | 0.62 | 9.94 | 6.11 | 2.81 | 9.27 |
| US House | 15.08 | 14.25 | 16.19 | 8.94 | 2.79 | 14.34 | 5.22 | 2.32 | 8.63 |
| US Senate | 11.42 | 6.09 | 14.01 | 4.96 | 1.54 | 10.06 | 6.75 | 0.53 | 12.03 |
| Total | 11.26 | 13.07 | 10.27 | 6.16 | 1.51 | 11.12 | 6.07 | 2.14 | 9.9 |
| Figures are from January 6, 2021 to June 19, 2022. Numbers include broadcast television for all sponsors. CITE SOURCE OF DATA AS: Kantar Media/CMAG with analysis by the Wesleyan Media Project. | |||||||||
Gun Mentions Up from 2020, Down from 2018
The issue of guns has been mentioned in 7.7 percent of House, Senate and gubernatorial ads so far this election cycle (Table 9), a higher percentage than in 2020 (5.42 percent) but a lower percentage than in 2018 (13.8 percent). Ads about guns are most commonly found in pro-Republican ads in the House and Senate. (Notably, at least in the past six weeks pro-Republican airings in Senate contests have featured much more discussion of guns than in the comparable six-week period in 2020 or 2018).
Table 9: Percentage of Ads Mentioning Guns by Race and Favored Party
| 2022 | 2020 | 2018 | |||||||
|---|---|---|---|---|---|---|---|---|---|
| Overall % | Pro-Dem % | Pro-Rep % | Overall % | Pro-Dem % | Pro-GOP % | Overall % | Pro-Dem % | Pro-GOP % | |
| Governor | 5.56 | 9.52 | 3.48 | 4.37 | 2.89 | 5.62 | 14.48 | 17.29 | 11.8 |
| US House | 8.54 | 3.28 | 14.53 | 11.08 | 8.25 | 13.59 | 14.81 | 13.77 | 16.08 |
| US Senate | 10.51 | 1.61 | 14.83 | 3.05 | 2.07 | 4.53 | 11.56 | 5.97 | 16.35 |
| Total | 7.72 | 5.67 | 9.03 | 5.42 | 3.66 | 7.33 | 13.8 | 13.66 | 13.97 |
| Figures are from January 6, 2021 to June 19, 2022. Numbers include broadcast television for all sponsors. CITE SOURCE OF DATA AS: Kantar Media/CMAG with analysis by the Wesleyan Media Project. |
|||||||||
Immigration Discussion High, Especially from Republicans in Senate Races
Table 10 shows that discussion of immigration is up overall, appearing in 16 percent of ads so far this cycle. This compares to 13.5 percent in the 2019-2020 election cycle and 14.2 percent in the 2017-2018 election cycle. The largest increase is in pro-Republican ads aired in U.S. Senate campaigns, where 1 in every 3 ads from pro-Republican sponsors have mentioned immigration, far higher than in 2020.
Table 10: Percentage of Ads Mentioning Immigration by Race and Favored Party
| 2022 | 2020 | 2018 | |||||||
|---|---|---|---|---|---|---|---|---|---|
| Overall % | Pro-Dem % | Pro-Rep % | Overall % | Pro-Dem % | Pro-GOP % | Overall % | Pro-Dem % | Pro-GOP % | |
| Governor | 9.11 | 2.12 | 13.03 | 11.9 | 1.69 | 20.45 | 15.01 | 8.14 | 21.61 |
| US House | 18.85 | 6.88 | 32.44 | 27.84 | 9.4 | 44.02 | 11.92 | 5.8 | 19.09 |
| US Senate | 24.76 | 2.82 | 35.39 | 6.65 | 0.76 | 15.4 | 14.55 | 2.99 | 24.36 |
| Total | 16.01 | 3.53 | 23.63 | 13.54 | 2.9 | 24.89 | 14.16 | 6.3 | 21.84 |
| Figures are from January 6, 2021 to June 19, 2022. Numbers include broadcast television for all sponsors. CITE SOURCE OF DATA AS: Kantar Media/CMAG with analysis by the Wesleyan Media Project. |
|||||||||
Outside Groups are Active, with Dark Money Abundant
Classifications by OpenSecrets reveal over 30 percent of outside group ads in congressional and gubernatorial races in the current election cycle are sponsored by groups that do not disclose their donors. OpenSecrets classifies groups as full-disclosure groups (meaning they disclose contributor lists to the Federal Election Commission or state election finance regulators), non-disclosing dark money groups (which are not required to disclose publicly their donors; these are most often 501c4 non-profits), and partial-disclosure groups (those that disclose donors but also accept contributions from dark money sources).
As Table 11 shows, nearly 2 in 3 outside group ads in gubernatorial races are from full-disclosure groups, but over half of outside group ads in congressional campaigns are from non-disclosing or partial-disclosing groups. The most active group cycle-to-date in congressional races is the Club for Growth, a super PAC that OpenSecrets classifies as a partial disclosure group. It has aired over 27,000 spots in Senate races and about 3,000 in House races. Next on the list is the American Acton Network, which is a 501c non-disclosing group, and it has sponsored over 17,000 spots in House races. Close behind is the Democratic-leaning Majority Forward, a 501c non-disclosing group, which has sponsored about 16,000 ads in Senate races.
“In recent years, outside groups have been a consistent presence in competitive elections across the country. In 2022, many big-dollar groups are already heavily active in primary elections and early general election spending,” said Michael Franz, co-director of the Wesleyan Media Project. “Dark money groups seem poised to play a big role,” he added, “either by directly sponsoring ads or by funding other groups.”
Table 11: Group-Sponsored TV Ad Airings by Disclosure Type (Cycle-to-Date)
| No disclosure | Partial | Full | Total | ||
|---|---|---|---|---|---|
| Governor | Airings | 34,318 | 10,574 | 84,044 | 128,936 |
| Row % | 26.6% | 8.2% | 65.2% | ||
| House | Airings | 50,379 | 27,012 | 46,812 | 124,203 |
| Row % | 40.6% | 21.7% | 37.7% | ||
| Senate | Airings | 64,931 | 53,509 | 108,523 | 226,963 |
| Row % | 28.6% | 23.6% | 47.8% | ||
| Total | 149,628 | 91,095 | 239,379 | 480,102 | |
| 31.2% | 19.0% | 49.9% | |||
| Figures are from January 6, 2021 to June 19, 2022. Numbers include broadcast television. CITE SOURCE OF DATA AS: Kantar Media/CMAG with analysis by the Wesleyan Media Project. Group classifications by OpenSecrets. |
|||||
About This Report
Data reported here from Kantar/CMAG do not cover local cable buys, only broadcast television, national network and national cable buys. All cost estimates are precisely that: estimates.
The Wesleyan Media Project provides real-time tracking and analysis of all political television advertising in an effort to increase transparency in elections. Housed in Wesleyan’s Quantitative Analysis Center – part of the Allbritton Center for the Study of Public Life – the Wesleyan Media Project is the successor to the Wisconsin Advertising Project, which disbanded in 2009. It is directed by Erika Franklin Fowler, professor of government at Wesleyan University, Michael M. Franz, professor of government at Bowdoin College and Travis N. Ridout, professor of political science at Washington State University. WMP personnel include Laura Baum (Associate Director), Breeze Floyd (Research Coordinator), Pavel Oleinikov (Associate Director, QAC), Markus Neumann (Post-Doctoral Fellow), and Jielu Yao (Post-Doctoral Fellow).
Data are provided by Kantar Media/CMAG with analysis by the Wesleyan Media Project. The Wesleyan Media Project is partnering again this year with OpenSecrets, to provide added information on outside group disclosure.
The Wesleyan Media Project’s digital advertising tracking is supported by the contributions of students in Delta Lab, an interdisciplinary research collaborative focusing on computationally-driven and innovative analyses and visualizations of media messaging.
Periodic releases of data will be posted on the project’s website and dispersed via Twitter @wesmediaproject. To be added to our email update list, click here.
For more information contact: Steven Scarpa at media@wesleyan.edu or 860-685-3813.
About Wesleyan University
Wesleyan University, in Middletown, Conn., is known for the excellence of its academic and co-curricular programs. With more than 2,900 undergraduates and 200 graduate students, Wesleyan is dedicated to providing a liberal arts education characterized by boldness, rigor and practical idealism. For more, visit www.wesleyan.edu.
