Photo Gage Skidmore/flickr
Trump Mentioned in 55% of Congressional TV Airings; Over 70% of Spots from GOP House and Senate Candidates Mention the President
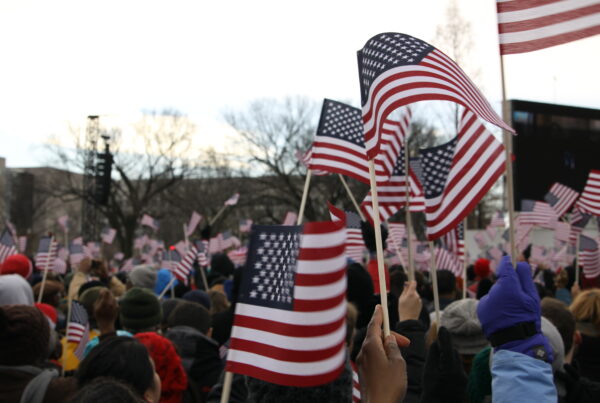
(MIDDLETOWN, CT) June 18, 2026 – The 2026 midterm election is all about Donald Trump, as advertisers from both parties frequently feature the president in their campaign ads. Indeed, 55 percent of broadcast TV ad airings across candidate and outside group sponsors in U.S. House and Senate races since January 1 of last year have mentioned Trump. That percentage is even higher on the Republican side than on the Democratic side, with over 70 percent of pro-GOP candidate ads in House and Senate races mentioning the president compared to 50 percent of pro-Democratic ads. These totals are based on an analysis of ad transcripts and miss references to Trump that appear only as images.
“Given Trump’s low approval ratings nationally, one might think that Republican candidates would be trying to distance themselves from the president, but that expectation is exactly the opposite of what we’ve seen,” said Erika Franklin Fowler, co-director of the Wesleyan Media Project. “Many Republican candidates are touting Trump endorsements in their ads, and many Republican candidates who were not endorsed by the president have been racing to associate themselves with him–and to accuse their Republican primary opponents of not showing enough loyalty to the president.”
Table 1 breaks out the rate of mentions of Trump and Joe Biden in ad airings by Democratic and Republican candidates and by outside groups. One sees, first, that Trump is mentioned more frequently in House and Senate ads than in gubernatorial ads, but still about a third of ad airings in races for governor mention Trump. Second, congressional candidates are even more likely than groups airing ads in their races to mention the president. Finally, Joe Biden is an afterthought for most advertisers. Biden appears in well under ten percent of ads and is not mentioned in a single ad aired by a Democratic candidate.
Table 1: Mentions of Trump and Biden in Broadcast TV Ads (1/1/25 to 6/14/26)
| Race | |||
|---|---|---|---|
| Governor | Republican Candidates | 28.68% | 2.31% |
| Democratic Candidate | 28.96% | 0.00% | |
| All Outside Groups | 38.85% | 1.29% | |
| House | Republican Candidates | 73.28% | 5.25% |
| Democratic Candidate | 53.39% | 0.00% | |
| All Outside Groups | 47.73% | 3.42% | |
| Senate | Republican Candidates | 70.30% | 6.45% |
| Democratic Candidate | 45.46% | 0.00% | |
| All Outside Groups | 49.90% | 6.41% | |
| CITE SOURCE OF DATA AS: AdImpact with analysis by the Wesleyan Media Project. Mentions are based on keyword searches of ad transcripts Total ad airings across all cells is ~1.7M |
|||
Total Ad Spending Surpasses $2.2 Billion in House, Senate and Governor Races
As of June 16, twenty-eight states had held primary elections for Congress or Governor, with four more states scheduled to hold elections before the end of June. In these and other states, where elections for primaries later in the summer are heating up, candidates and supportive party committees and outside groups have spent over $2.2 billion in ads across media platforms (Table 2). These totals include gubernatorial elections and special elections for vacant House seats back to January 2025.
In Table 2, we also break out spending by platform and sponsor type. Of total ad spending, 43 percent was committed to local broadcast ads on live television. This is up slightly from 41 percent in our May report. Over 27 percent of ad spending has been on Connected TV (CTV) platforms, which are ads seen on smart TVs through streaming applications. Nearly 15 percent of ad spending has been via social media platforms, with just over 12 percent on local cable stations on live television. The rest, just 2.6 percent, are for ads on radio, satellite television, and national network television.
Groups Outspend Candidates 2-to-1 in Senate
Table 2 also shows the important role of outside groups at this point in the midterm election cycle. In Senate races, outside groups have out-spent candidates by nearly 2 to 1 ($394 million to $210 million). Outside groups have also vastly outspent candidates in U.S. House races ($317 million to $210 million).
By and large, outside groups have allocated their ad spending across platforms in much the same way as candidates. Gubernatorial and congressional candidates have devoted 43 percent of their ad spending to broadcast television and 26 percent to CTV. For outside groups, the split is 44 percent and 28 percent, respectively.
Table 2: Spending by Office, Sponsor Type and Media Channel (1/1/25 to 6/14/26)
(in $Ms) | (in $Ms) | (in $Ms) | (in $Ms) | (in $Ms) | (in $Ms) |
||
|---|---|---|---|---|---|---|---|
| Governor | Candidate | 334.26 | 190.8 | 81.59 | 87.3 | 19.94 | 713.89 |
| Outside Group | 153.62 | 110.51 | 38.58 | 46.53 | 6.27 | 355.51 | |
| Coordinated | 1.46 | 2.53 | 0.94 | 0.16 | 5.09 | ||
| Senate | Candidate | 64.91 | 64.81 | 58.65 | 16.99 | 4.89 | 210.24 |
| Outside Group | 168.44 | 132.06 | 38.78 | 44.33 | 10.81 | 394.42 | |
| Coordinated | 16.61 | 10.15 | 1.81 | 2.63 | 1.1 | 32.3 | |
| House | Candidate | 80.8 | 40.28 | 51.67 | 24.39 | 4.84 | 201.99 |
| Outside Group | 144.49 | 61 | 52.94 | 49.75 | 9.05 | 317.23 | |
| Coordinated | 2.15 | 0.83 | 0.04 | 0.32 | 0.08 | 3.42 | |
| Total | $966.74 | $612.97 | $324.98 | $272.41 | $56.98 | $2,234.08 | |
| % | 43.3% | 27.4% | 14.5% | 12.2% | 2.6% | ||
| Other includes network cable, radio, satellite, and network broadcast CTV includes spending on streaming, CTV devices and in-app ads. Digital includes spending on Meta, Google, Snapchat, and X CITE SOURCE OF DATA AS: AdImpact with analysis by the Wesleyan Media Project. |
|||||||
Spending on Gubernatorial Campaigns in OK, SC, and MI Passes $30 Million in Each State
Table 3 shows spending in each race for governor this past cycle, including the 2025 races in New Jersey and Virginia. Although California’s race accounts for a huge sum of spending–almost one-third of a billion dollars–spending has been ramping up in other states, including Oklahoma, South Carolina and Michigan. Each state has seen over $30 million in ad spending thus far, with the general election still almost 5 months away.
In Georgia, the race for the GOP nomination went to a run-off, which was held on June 16. Since our last report on May 28, the two Republican candidates and groups supportive of them sponsored $29 million in political ads (for the period between May 25 and June 14). Rick Jackson won the run-off and spent $20.6 million. Burt Jones (the Lieutenant Governor and the candidate endorsed by President Trump) spent $6.5 million. All told, to-date the gubernatorial campaign in Georgia has featured over $162 million in ads.
In Oklahoma, which held a primary on June 16, the GOP nomination is headed for a run-off on August 25. The top two candidates each finished with about 26 percent of the vote. Several outside groups weighed in on the contest, including Make Oklahoma Great Again PAC, which backed Gentner Drummond (one of the candidates headed for the run-off), and the Oklahoma Conservative Coalition, which backed Charles McCall, who came in 5th.
South Carolina had a primary on June 9, and neither Republican candidate earned a majority of the votes, meaning the GOP race is slated for a run-off on June 23 between Pamela Evette (the Lieutenant Governor and Trump-backed candidate) and Alan Wilson (the state’s Attorney General). In the full campaign through June 14, there has been nearly $33 million in ads on both sides, with the bulk (over $30 million) for the GOP campaign. Since June 9, the SC Conservative Action Fund has promoted Alan Wilson’s campaign, while Patriots for South Carolina has stumped for Pamela Evette, touting Trump’s endorsement.
Outside group efforts have varied significantly across gubernatorial campaigns. Groups sponsored about 27 percent of ad spending in the California primary election (nearly $90 million), but only 13 percent of ad spending in Georgia. Groups account for nearly 40 percent of spending in Oklahoma and South Carolina.
Table 3: Most Expensive Races for Governor (1/1/25-6/14/26)
(in $Ms) | (in $Ms) | (in $Ms) | (in $Ms) | ||
|---|---|---|---|---|---|
| CA | $331.66 | $238.47 | $4.31 | $88.85 | 26.8 |
| NJ | $203.88 | $48.67 | $26.50 | $128.71 | 63.1 |
| GA | $162.45 | $2.90 | $133.59 | $22.39 | 13.8 |
| VA | $83.26 | $50.56 | $25.68 | $5.56 | 6.7 |
| MI | $46.17 | $0.15 | $27.03 | $18.01 | 39 |
| OK | $37.40 | $23.51 | $13.89 | 37.1 | |
| SC | $32.90 | $2.47 | $18.13 | $12.31 | 37.4 |
| OH | $20.42 | $0.51 | $13.97 | $5.94 | 29.1 |
| IA | $16.04 | $4.73 | $9.18 | $2.14 | 13.3 |
| ME | $14.68 | $3.20 | $2.97 | $8.51 | 58 |
| NY | $14.16 | $0.11 | $2.01 | $12.03 | 85 |
| FL | $13.42 | $0.45 | $1.77 | $11.20 | 83.5 |
| SD | $13.02 | $9.76 | $3.26 | 25 | |
| CO | $11.59 | $5.10 | $0.03 | $6.46 | 55.7 |
| IL | $10.48 | $8.76 | $1.69 | $0.03 | 0.2 |
| NV | $9.44 | $0.07 | $1.60 | $7.76 | 82.3 |
| TX | $8.20 | $0.69 | $7.25 | $0.26 | 3.1 |
| AZ | $7.15 | $2.62 | $3.72 | $0.76 | 10.6 |
| NM | $5.98 | $4.01 | $0.71 | $1.26 | 21 |
| MA | $5.17 | $0.06 | $5.02 | $0.10 | 1.9 |
| WI | $4.74 | $0.16 | $3.57 | $1.01 | 21.3 |
| TN | $4.60 | $4.23 | $0.37 | 7.9 | |
| OR | $3.88 | $0.03 | $3.44 | $0.41 | 10.5 |
| KS | $3.33 | $0.00 | $2.10 | $1.23 | 37.1 |
| PA | $2.77 | $2.12 | $0.52 | $0.13 | 4.7 |
| Totals include broadcast, local cable, connected TV (CTV), digital (including Meta, Google, Snapchat and X), network cable, radio, satellite, and network broadcast. CITE SOURCE OF DATA AS: AdImpact with analysis by the Wesleyan Media Project. |
|||||
Ad Spending in NY-12 and MD-06 Approaches $20 Million
The election in KY-04 remains the mostly costly House election of the cycle so far in terms of ad spending, but two elections in upcoming primaries are approaching $20 million in ad spending.
The spending in NY-12 is entirely in the Democratic primary (which will be held on June 23), which features Jack Schlossberg, JFK’s grandson, and George Conway, a sharp critic of President Trump. Outside groups have spent the bulk of the money on ads, including $7 million from Stand for New York, who is backing Micah Lasher, a member of the New York State Assembly. Think Big PAC has spent over $2.7 million attacking Alex Bores, also a state legislator. You Can Push Back has spent over $1.8 million promoting Bores, and Jobs and Democracy PAC has also backed Bores with $2.5 million. Conway has spent $2.5 million promoting his campaign, while Schlossberg has spent just $400,000 on political ads.
In MD-06, which will also hold a primary on June 23, the campaign for the Democratic nomination is a costly one between incumbent April McClain-Delaney and former Congressman David Trone. Trone ran for the Democratic Senate nomination in 2024 and lost and is now looking to regain his seat by defeating McClain-Delaney in the primary. Trone has spent over $13 million on political ads, while McClain-Delaney has spent $5.5 million.
Table 4: Most Expensive Races for U.S. House (1/1/25-6/14/26)
(in $Ms) | (in $Ms) | (in $Ms) | (in $Ms) | ||
|---|---|---|---|---|---|
| KY04 | $33.57 | $8.38 | $25.19 | 75 | |
| NY12 | $19.84 | $4.31 | $15.53 | 78.3 | |
| MD06 | $18.76 | $18.66 | $0.10 | 0.5 | |
| CA22 | $13.33 | $1.25 | $0.02 | $11.92 | 89.4 |
| CA40 | $12.89 | $0.67 | $5.75 | $6.48 | 50.3 |
| IL09 | $12.58 | $5.22 | $7.34 | 58.3 | |
| TN07 | $10.85 | $1.75 | $1.70 | $6.81 | 62.8 |
| IL07 | $9.96 | $2.84 | $0.00 | $7.11 | 71.4 |
| IA01 | $9.90 | $0.04 | $0.57 | $9.29 | 93.9 |
| FL06 | $9.41 | $4.38 | $0.12 | $3.67 | 39 |
| IL08 | $9.35 | $3.76 | $5.59 | 59.8 | |
| CO08 | $9.02 | $2.40 | $0.04 | $6.57 | 72.9 |
| MD05 | $8.83 | $4.01 | $4.82 | 54.6 | |
| NJ07 | $8.35 | $1.37 | $0.05 | $6.94 | 83 |
| AZ06 | $7.90 | $0.08 | $0.02 | $7.80 | 98.8 |
| PA07 | $7.82 | $0.95 | $0.03 | $6.73 | 86.1 |
| IL02 | $7.73 | $1.75 | $5.99 | 77.4 | |
| NE02 | $7.66 | $1.46 | $0.01 | $6.20 | 80.9 |
| CA04 | $7.61 | $5.89 | $0.01 | $1.71 | 22.5 |
| CA11 | $7.33 | $6.64 | $0.70 | 9.5 | |
| MI07 | $7.12 | $0.19 | $0.16 | $6.77 | 95.1 |
| NJ11 | $7.03 | $1.76 | $0.01 | $5.26 | 74.8 |
| PA08 | $7.02 | $0.04 | $6.98 | 99.4 | |
| TX18 | $6.53 | $0.67 | $5.86 | 89.7 | |
| NY17 | $5.97 | $1.12 | $0.12 | $4.62 | 77.5 |
| Totals include broadcast, local cable, connected TV (CTV), digital (including Meta, Google, Snapchat and X), network cable, radio, satellite, and network broadcast. CITE SOURCE OF DATA AS: AdImpact with analysis by the Wesleyan Media Project. |
|||||
$60 Million in Ad Spending for Senate Race in Maine, Mostly From Outside Groups
One of the most closely-watched Senate races is in Maine, where incumbent Republican Susan Collins faces the newly-crowned Democratic nominee Graham Platner. In spite of Maine’s small population, the state has seen over $60 million in advertising. Much of that advertising–75 percent–has come from outside groups seeking to influence the race. This includes One Nation (spending nearly $20 million to-date) and Pine Tree Results PAC ($5 million), both backing Susan Collins.
The campaign for the GOP nomination in Georgia was held on May 19, but no candidate earned a majority so the run-off was held on June 16. Mike Collins defeated Derek Dooley. Meanwhile, incumbent Democrat Jon Ossoff has already spent over $14 million on his re-election campaign, most of that on digital ads.
There was also a run-off on June 16 for the GOP nomination in Alabama between Barry Moore (currently a member of the U.S. House) and Jared Hudson, a former Navy SEAL. Moore won the run-off with 56 percent of the vote. In many states, the vast majority of the spending–sometimes approaching 90 percent–has come from groups as opposed to candidates. This was true in Alabama, where 85 percent of the spending was sponsored by supportive groups. These included Defend American Jobs ($9.5 million in the cycle-to-date) and the Alabama Freedom Fund ($4.4 million), both of which backed Barry Moore. Alabama Conservatives backed Jared Hudson with $1.8 million in spending.
Louisiana held Senate primaries on May 16, and both the Democratic and Republican campaigns went to a run-off, to be held on June 27. On the Republican side, incumbent Republican Bill Cassidy came in third in the primary and did not advance to the run-off. To-date, the Senate campaign has seen over $38 million in ads (Cassidy sponsored nearly $10 million), with none from Democratic candidates and the majority of spending from outside groups. Top spending groups include the Louisiana Freedom Fund ($12.4 million) attacking Julia Letlow (who finished first in the primary and was endorsed by President Trump) and the Accountability Project ($7.4 million), who backed Letlow.
Table 5: Most Expensive Races for U.S. Senate (1/1/25-6/14/26)
(in $Ms) | (in $Ms) | (in $Ms) | (in $Ms) | ||
|---|---|---|---|---|---|
| TX | $170.55 | $31.08 | $9.47 | $100.62 | 59 |
| KY | $66.70 | $0.71 | $17.70 | $48.29 | 72.4 |
| ME | $60.64 | $13.52 | $1.57 | $45.56 | 75.1 |
| IL | $57.72 | $31.79 | $0.16 | $25.76 | 44.6 |
| GA | $40.09 | $14.77 | $10.57 | $14.75 | 36.8 |
| LA | $38.49 | $15.79 | $22.70 | 59 | |
| MI | $27.48 | $2.96 | $0.17 | $24.35 | 88.6 |
| NC | $27.17 | $2.72 | $5.73 | $18.72 | 68.9 |
| SC | $26.82 | $1.72 | $18.11 | $6.98 | 26 |
| AL | $21.18 | $0.00 | $3.18 | $17.99 | 84.9 |
| IA | $20.45 | $3.47 | $1.09 | $15.89 | 77.7 |
| OH | $19.11 | $8.02 | $0.96 | $7.92 | 41.4 |
| AK | $12.17 | $1.98 | $0.06 | $10.13 | 83.2 |
| MN | $6.75 | $0.55 | $0.21 | $5.99 | 88.7 |
| MT | $6.36 | $0.00 | $5.35 | 84.2 | |
| AR | $6.28 | $0.14 | $0.68 | $5.45 | 86.8 |
| WV | $5.12 | $0.08 | $0.68 | $4.36 | 85.2 |
| NE | $3.61 | $1.56 | $1.62 | 44.9 | |
| KS | $3.47 | $0.32 | $3.16 | 90.8 | |
| NH | $2.93 | $0.33 | $0.00 | $2.60 | 88.8 |
| OK | $2.62 | $1.20 | $1.42 | 54.2 | |
| MA | $2.56 | $0.48 | $0.07 | $2.01 | 78.5 |
| FL | $1.97 | $0.95 | $1.03 | 52 | |
| MS | $1.59 | $0.48 | $0.88 | $0.23 | 14.3 |
| Totals include broadcast, local cable, connected TV (CTV), digital (including Meta, Google, Snapchat and X), network cable, radio, satellite, and network broadcast. CITE SOURCE OF DATA AS: AdImpact with analysis by the Wesleyan Media Project. |
|||||
About the Data
Advertising data reported here for 2025-2026 come from AdImpact with analysis by the Wesleyan Media Project. All cost estimates for ad spending by medium use AdImpact’s methodology.
The CTV category includes ads distributed over devices where an input is connected to a television (e.g., Apple TV, PlayStation, etc), streaming via set-top-boxes, including video on demand (e.g., Dish or XFINITY streaming) and in apps available on smart TVs (e.g., YouTube or the Hulu app, etc).
AI in ads tracking reported here comes from the Wesleyan Media Project’s original assessment of election advertising that either explicitly states in a disclaimer that it uses AI or has been reported by news media and/or by AdImpact to include AI-generated or AI-enhanced content. We investigate advertising that our coders flag as potentially incorporating AI (as of this writing, our coding has just started and is not up-to-date on ads aired through May 24), and we are tracking news mentions of such use and adding labeling to our database, so we can assess known prevalence over time. This tracking is undoubtedly an underestimate given there are a lot of ways in which AI might be incorporated that may go undetected.
About this Report
The Wesleyan Media Project provides real-time tracking and analysis of all political television advertising in an effort to increase transparency in elections. Housed in Wesleyan’s Hazel Quantitative Analysis Center – part of the Allbritton Center for the Study of Public Life – the Wesleyan Media Project is the successor to the Wisconsin Advertising Project, which disbanded in 2009. It is directed by Erika Franklin Fowler, professor of government at Wesleyan University, Michael M. Franz, professor of government at Bowdoin College and Travis N. Ridout, professor of political science at Washington State University. WMP personnel include Breeze Floyd (Program Manager), Pavel Oleinikov (Associate Director, QAC) and Yujin Kim (Post-Doctoral Fellow).
The Wesleyan Media Project’s real-time tracking in 2026 is supported by Wesleyan University and the John S. and James L. Knight Foundation. The Wesleyan Media Project is partnering again this year with OpenSecrets, to provide added information on outside group disclosure and candidate status.
The Wesleyan Media Project’s digital advertising tracking is supported by the contributions of students in Delta Lab, an interdisciplinary research collaborative focusing on computationally-driven and innovative analyses and visualizations of media messaging. We are also grateful to our Coding Supervisors Saul Ferholt-Kahn and Helen Xie, as well as Ben Berlin and the numerous student research assistants who facilitate additional content analysis of television and digital advertising.
Periodic releases of data will be posted on the project’s website and dispersed via LinkedIn, Bluesky @wesmediaproject.bsky.social and Twitter @wesmediaproject. To be added to our email update list, click here.
For more information contact: media@wesleyan.edu.
About Wesleyan University
Wesleyan University, in Middletown, Conn., is known for the excellence of its academic and co-curricular programs. With more than 2,900 undergraduates and 200 graduate students, Wesleyan is dedicated to providing a liberal arts education characterized by boldness, rigor and practical idealism. For more, visit www.wesleyan.edu.
About the John S. and James L. Knight Foundation
We are social investors who support democracy by funding free expression and journalism, arts and culture in community, research in areas of media and democracy, and in the success of American cities and towns where the Knight brothers once had newspapers. Learn more at kf.org and follow @knightfdn on social media.