
In House, Dems focus more on cost of living; GOP discuss crime and taxes
(MIDDLETOWN, CT) August 13, 2026 – Ads supporting Republicans and Democrats running for Senate this year have converged on the top issues: immigration and policing. According to a new analysis from the Wesleyan Media Project of all issues mentioned in local broadcast campaign ads in the cycle-to-date through August 2, thirty-one percent of ad airings sponsored by Democratic candidates, Democratic-affiliated groups or the Democratic party in Senate races mention the issue of policing and 29 percent mention immigration (Table 1). In the Senate on the Republican side, the top issues are immigration, which is mentioned in 38 percent of airings, and policing, which is mentioned in 36 percent of ad airings. (The analysis does not consider the issue content of digital ads or ads on CTV platforms.)
“Often times, Republican and Democratic ads talk past each other, emphasizing different things, but this year we’ve seen some convergence around the issues of immigration and policing in Senate races,” said Michael Franz, co-director of the Wesleyan Media Project. “That may change, however, as advertisers shift from messages designed to win a nomination to messages designed to win a general election race.”
Although policing and racial violence is an issue raised by ad sponsors in both parties, how the parties frame the issue tends to be different. Democrats frequently mention ICE overreach, while Republicans often discuss the issue in terms of supporting law enforcement and accusing their opponents of wanting to defund the police.
Other popular issues on the Democratic side in Senate races are cost of living concerns (mentioned in 28 percent of ads) and health care (24 percent). On the Republican side in Senate races, other popular issues are crime (mentioned in 28 percent of ad airings) and taxes (27 percent).
In the House, the issue agenda is somewhat different from that in Senate races, and there are more differences between the parties as well. As Table 2 shows, Democratic ad sponsors have the cost of living at the top of their agenda, with the topic appearing in 36 percent of ad airings. This is followed by health care (35 percent of airings) and immigration (26 percent of airings). On the Republican side, by contrast, immigration sits atop the agenda, being mentioned in 40 percent of ad airings. This is followed by taxes (32 percent of airings) and references to the military, which appear in 30 percent of ad airings.
Anti-Trans Attacks Persist, Abortion Talk Decreases, and Little MAHA Conversation
Attacks on transgender people continue to be present in Republican ads, with the topic clocking in as tenth most common in pro-GOP House ads, mentioned in 14 percent of those ad airings. (Discussion on the Senate side is much lower than House and lower than rates of Senate discussion from 2024).
“Similar to prior years, it remains common for Republican-sponsored ads to mention men in girls sports, men in girls locker rooms, puberty blockers and gender transitions,” said Travis Ridout, co-director of the Wesleyan Media Project. “Many of these ads attack not just Democrats but fellow Republicans for their purported support for rights for transgender people.”
One difference from the past two election cycles is that discussion of abortion is relatively rare. Abortion is mentioned in 2.9 percent of House GOP ads, 15 percent of Dem House ads, 4.6 percent of Dem Senate ads and 1.9 percent of GOP Senate ads.
Also worth noting is that our coding for MAHA (the Make America Health Again) movement revealed very few mentions–just 0.2% of airings from Republican Senate sponsors and 0.2% of airings from Republican House sponsors.
Table 1: Top Issues by Party in Senate Races (January 1, 2025 - August 2, 2026)
| Pro-Democratic Sponsors | Pro-Republican Sponsors | ||
|---|---|---|---|
| Police / Racial Violence | 30.5% | Immigration | 37.7% |
| Immigration | 28.6% | Police / Racial Violence | 36.1% |
| Cost of living | 28.2% | Crime | 27.6% |
| Health Care (not prescription drugs) | 24.5% | Taxes | 27.4% |
| Business | 22.4% | Military (generic reference) | 25.1% |
| Government Ethics / Scandal | 22.1% | Veterans | 17.5% |
| Campaign Finance Reform | 19.8% | Government Spending | 14.2% |
| Taxes | 17.0% | Moral / Family / Religious Values | 12.9% |
| Energy Policy | 14.8% | Government Ethics / Scandal | 12.9% |
| Government Spending | 13.2% | Health Care (not prescription drugs) | 12.5% |
| Prescription Drugs | 13.0% | Business | 11.7% |
| Protests / Riots | 12.5% | Employment / Jobs | 11.2% |
| Military (generic reference) | 12.4% | Cost of living | 10.0% |
| Economic Disparity / Income Inequality | 11.7% | Narcotics / Illegal Drugs | 9.5% |
| Veterans | 11.5% | Incarceration / Sentencing | 8.8% |
| Columns report percentage of total ad airings within all identified party sponsors (candidate and party sponsored along with affiliated groups) that contain a mention of the specific issue. Percentages sum to more than 100 percent because many ads mention more than one issue. |
|||
Table 2: Top Issues by Party in House Races (January 1, 2025 - August 2, 2026)
| Pro-Democratic Sponsors | Pro-Republican Sponsors | ||
|---|---|---|---|
| Cost of living | 36.2% | Immigration | 40.2% |
| Health Care (not prescription drugs) | 34.6% | Taxes | 31.9% |
| Immigration | 26.0% | Military (generic reference) | 29.9% |
| Police / Racial Violence | 25.3% | Veterans | 26.9% |
| Business | 24.6% | Police / Racial Violence | 24.0% |
| Taxes | 18.0% | Business | 22.7% |
| Campaign Finance Reform | 16.5% | Cost of living | 19.4% |
| Abortion | 15.0% | Farming | 19.1% |
| Government Spending | 14.3% | Moral / Family / Religious Values | 15.8% |
| Military (generic reference) | 14.3% | Crime | 15.7% |
| Energy Policy | 14.0% | Employment / Jobs | 14.5% |
| Medicaid | 13.9% | LGBTQ Issues / Rights | 13.9% |
| Government Ethics / Scandal | 13.1% | Energy Policy | 11.3% |
| Welfare | 13.0% | Government Spending | 10.6% |
| Education / Schools | 12.2% | Gun Control | 9.0% |
| Columns report percentage of total ad airings within all identified party sponsors (candidate and party sponsored along with affiliated groups) that contain a mention of the specific issue. Percentages sum to more than 100 percent because many ads mention more than one issue. |
|||
Trump Continues to Dominate Ad Conversation
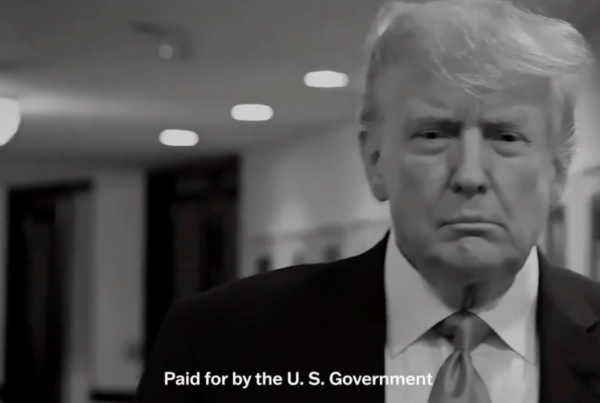
Over half (57 percent) of all federal ad airings this cycle have featured the president, based on original Wesleyan Media Project analysis of AdImpact data. Democratic sponsors have referenced the president in roughly every other ad (52.5 percent), nearly all of which (97.5 percent) have been in a way to convey disapproval. Republicans have featured the president more frequently, with Trump making an appearance in nearly two-thirds (64.7 percent) of their advertising, nearly all of which have been in ways to convey approval (95.4 percent). By contrast, mentions of former President Joe Biden (tracked through audio mentions only) are rare, appearing in only 5.9 percent of Republican ad airings and just 0.3 percent of Democratic ad airings.
“In a midterm cycle where the public is concerned about cost of living and presidential approval is low, it is highly unusual to see candidates of the president’s party touting their connections; however, the 2026 midterms are shaping up to be similar to what we saw in the 2018 midterms when Republicans also praised Trump at record levels,” said Erika Franklin Fowler, co-director of the Wesleyan Media Project.
Almost $3 Billion in Ad Spending
Spending on political ads through August 9 continues to rise as more states hold nomination contests and candidates turn toward the general election. In the full cycle to-date, just under $3 billion has been spent on election ads in House, Senate and gubernatorial campaigns (Table 3). The plurality of that spending has been in races for governor (including the NJ and VA races in 2025), with $1.31 billion spent on ads in those races.
Also of note is that groups are vastly outspending candidates in races for both the U.S. Senate and the U.S. House. In the Senate, groups account for $620 million in spending compared to just half of that, $310 million, coming from candidates. In the House, groups account for $416 million in ad spending while candidates account for $288 million.
Spending in these races is spread across several types of advertising, with local broadcast advertising accounting for 46 percent of total ad spending and connected TV (including CTV, streaming and in-app devices) accounting for 26 percent. A little over 14 percent of ad spending is on digital platforms like Facebook, Instagram, YouTube, X and Snapchat, and about 12 percent of ad spending is on local cable. A smattering of ads are found on other media, such as satellite TV and radio.
Table 3: Spending by Office, Sponsor Type and Media Channel (1/1/25 to 8/9/26)
Type | (in $Ms) | (in $Ms) | (in $Ms) | (in $Ms) | (in $Ms) | (in $Ms) |
|
|---|---|---|---|---|---|---|---|
| Governor | Candidate | 394.32 | 221.73 | 96.64 | 99.32 | 24.36 | 836.37 |
| Issue Group | 207.25 | 137.87 | 47.45 | 59.65 | 8.47 | 460.69 | |
| Coordinated | 6.14 | 6.3 | 1.22 | 0.9 | 0.1 | 14.66 | |
| Senate | Candidate | 110.37 | 87.52 | 80.2 | 25.01 | 6.61 | 309.72 |
| Issue Group | 295.56 | 184.45 | 65.2 | 58.64 | 16.56 | 620.41 | |
| Coordinated | 17.4 | 11.25 | 1.81 | 2.83 | 1.12 | 34.41 | |
| House | Candidate | 126.23 | 55.74 | 63.33 | 35.19 | 7.15 | 287.65 |
| Issue Group | 196.63 | 74.78 | 69.1 | 64.86 | 11.06 | 416.44 | |
| Coordinated | 2.98 | 0.91 | 0.04 | 0.47 | 0.08 | 4.47 | |
| Total | $1,356.89 | $780.54 | $424.99 | $346.88 | $75.52 | $2,984.83 | |
| % | 45.5% | 26.2% | 14.2% | 11.6% | 2.5% | ||
| Other includes network cable, radio, satellite, and network broadcast CTV includes spending on streaming, CTV devices and in-app ads. Digital includes spending on Meta, Google, Snapchat, and X CITE SOURCE OF DATA AS: AdImpact with analysis by the Wesleyan Media Project. |
|||||||
Heavy Ad Spending for Governor in Several States
Since June 15, the most recent date covered by our last release, nine gubernatorial races have featured at least $10 million in advertising (Florida, Tennessee, Ohio, Michigan, Iowa, Wisconsin, Kansas, Georgia and Arizona). In several of those states, spending was boosted by an intra-party primary race, such as in Florida (with a primary set for 8/18), which saw $27 million in spending over the past 7 weeks. Nearly all of that was from outside groups, including $20M from the Friends of Byron Donalds PAC, which under Florida campaign finance law is not a candidate committee formally even though it features Donalds (a Republican) speaking in the ad. Another group, Quiet Professionals FL, has spent over $3.3M promoting Donalds’s opponent, the current Lieutenant Governor, Jay Collins. Public First Action has pitched in another $2.5M promoting Donalds.
The Tennessee gubernatorial race featured over $25 million in spending. It had a primary on 8/6, with the most money spent on the Republican side. Marsha Blackburn, a current U.S. Senator from the state, won that campaign, spending over $5M in the covered time period on political ads. She was out-spent by her opponent, John Rose, but Blackburn also benefited from over $9M in ads from the Tennessee Freedom Fund.
The gubernatorial race in Ohio saw over $24 million in ads, but that primary was in May, meaning the spending over the last two months has been early general election spending. Much of that was from groups backing Republican nominee Vivek Ramaswamy, in particular, V-Pac: Victors, Not Victims, which spent over $17M on ads.
In Wisconsin, which saw David Crowley narrowly defeat Francesca Hong in the Democratic primary on Tuesday, August 11, spending was uneven across the top candidates, with Hong heavily out-spent on ads. Hong’s campaign spent only $225,000 on advertising compared to $800,000 from Crowley. But Crowley benefited from group spending as well, with several groups airing ads on his behalf. For example, Wisconsin Future Rising spent $1.6 on ads supporting Crowley and attacking Hong. Additionally, Right Direction PAC committed $3.4 million into the race on ads that criticized Hong.
In Iowa, the primary wrapped up on June 2, but the state has seen heavy spending, almost $9 million from Democratic candidate Rob Sand and more than $8 million from Republican candidate Zach Lahn. Group-sponsored ads have been largely absent from the state’s airwaves.
Table 4: Most Expensive Races for Governor (6/15/26-8/9/26)
| Race | (in $Ms) | (in $Ms) | (in $Ms) | (in $Ms) | |
|---|---|---|---|---|---|
| FL | $27.00 | $0.11 | $0.32 | $26.57 | 98.4 |
| TN | $25.40 | $0.04 | $12.61 | $11.04 | 43.5 |
| OH | $24.17 | $0.27 | $6.22 | $17.68 | 73.1 |
| MI | $18.19 | $0.08 | $15.10 | $3.01 | 16.6 |
| IA | $17.67 | $8.98 | $8.14 | $0.56 | 3.2 |
| WI | $16.60 | $2.28 | $3.55 | $10.77 | 64.9 |
| KS | $14.98 | $1.18 | $5.33 | $8.48 | 56.6 |
| GA | $12.40 | $0.17 | $7.55 | $0.79 | 6.4 |
| AZ | $11.70 | $5.52 | $0.43 | $0.12 | 1 |
| NV | $9.49 | $0.09 | $2.72 | $6.68 | 70.4 |
| PA | $9.17 | $8.86 | $0.05 | $0.25 | 2.8 |
| OK | $7.02 | $1.84 | $5.18 | 73.8 | |
| CT | $6.52 | $5.55 | $0.97 | 0 | |
| CO | $5.70 | $1.66 | $0.02 | $4.02 | 70.5 |
| SC | $4.59 | $0.00 | $1.68 | $2.91 | 63.3 |
| IL | $3.72 | $3.69 | $0.03 | 0 | |
| NY | $2.57 | $0.02 | $1.78 | $0.77 | 29.9 |
| MA | $2.53 | $0.02 | $1.75 | $0.76 | 30.1 |
| RI | $2.46 | $2.46 | $0.00 | 0 | |
| AK | $2.37 | $0.74 | $1.62 | $0.00 | 0.2 |
| WY | $2.29 | $0.92 | $1.38 | 60 | |
| SD | $2.27 | $1.53 | $0.74 | 32.5 | |
| Totals include broadcast, local cable, connected TV (CTV), digital (including Meta, Google, Snapchat and X), network cable, radio, satellite, and network broadcast. *Total spending will in some rows be greater than the sum of candidate and group spending, as the total includes any spending on party coordinated ads with candidates. There has been notable coordinated spending in the GA and AZ races. CITE SOURCE OF DATA AS: AdImpact with analysis by the Wesleyan Media Project. |
|||||
Michigan Race Tops House Spending
The race in Michigan’s 7th congressional district was the most expensive since mid-June, with $9.5 million in ad spending. Much of that was in a heated three-way contest for the Democratic nomination, which featured considerable outside group spending. Indeed, groups accounted for 83 percent of ad spending in that race over the past 7 weeks. Over twenty groups placed ads in that race, including Vote Vets, which spent over $2.6 million in support of candidate Matt Maasdam.
Another expensive race was that in Arizona’s 1st congressional district, which saw competitive Democratic and Republican primaries after incumbent David Schwiekert decided not to run for reelection. More than $7.6 million was spent on ads in that race, with about half the spending coming from outside groups.
Because the time period we examine covered primaries that concluded in late June (such as in New York and Maryland, both of which had a primary on June 23), some spending in those primary campaigns is included in the totals in Table 5. For example, NY-12 featured $7M in spending, but nearly all of that wrapped up by the day of the primary.
One highly watched primary from early August was in MO-01, which featured Democratic incumbent Wesley Bell defeating challenger (and former incumbent) Cori Bush. That campaign featured over $5M in ads, the bulk from outside groups. These included ads from the United Democracy Project, a super PAC affiliated with the American Israel Public Affairs Committee (AIPAC), which spent over $2.3M attacking Bush and promoting Bell.
Table 5: Most Expensive Races for U.S. House (6/15/26-8/9/26)
(in $Ms) | (in $Ms) | (in $Ms) | (in $Ms) | ||
|---|---|---|---|---|---|
| MI07 | $9.52 | $1.59 | $7.94 | 83.3 | |
| AZ01 | $7.61 | $2.32 | $0.86 | $3.59 | 47.1 |
| NY12 | $7.00 | $1.03 | $5.96 | 85.3 | |
| FL19 | $6.37 | $4.35 | $2.02 | 31.7 | |
| MI13 | $6.29 | $3.93 | $2.36 | 37.6 | |
| MD05 | $5.43 | $1.25 | $4.17 | 76.9 | |
| MO01 | $5.38 | $2.19 | $3.18 | 59.2 | |
| NY13 | $5.18 | $0.34 | $4.84 | 93.4 | |
| MD06 | $4.93 | $4.43 | $0.50 | 10.1 | |
| FL22 | $4.54 | $0.03 | $4.50 | $0.00 | 0.1 |
| MO05 | $4.44 | $0.00 | $0.79 | $3.65 | 82.2 |
| FL02 | $4.26 | $0.20 | $2.27 | $1.79 | 42.1 |
| WY01 | $3.46 | $2.30 | $1.15 | 33.3 | |
| CA14 | $3.30 | $0.80 | $2.50 | 75.8 | |
| FL11 | $3.24 | $3.22 | $0.03 | 0.9 | |
| MN02 | $3.20 | $0.45 | $2.75 | 86 | |
| MA06 | $3.13 | $2.97 | $0.17 | 5.3 | |
| TN06 | $3.13 | $2.44 | $0.69 | 22 | |
| NY17 | $3.00 | $0.39 | $0.01 | $2.60 | 86.5 |
| CT01 | $2.88 | $1.67 | $1.20 | 41.8 | |
| FL25 | $2.79 | $0.21 | $0.80 | $1.78 | 63.6 |
| AZ06 | $2.75 | $1.84 | $0.80 | $0.10 | 3.8 |
| WA03 | $2.74 | $1.59 | $0.43 | $0.71 | 26 |
| CO08 | $2.74 | $0.67 | $0.12 | $1.95 | 71.2 |
| CO01 | $2.54 | $0.59 | $1.83 | 72 | |
| FL14 | $2.35 | $0.01 | $0.98 | $1.36 | 57.9 |
| NH01 | $2.35 | $0.82 | $0.72 | $0.81 | 34.4 |
| TN05 | $2.34 | $0.12 | $0.00 | $2.22 | 94.6 |
| NY21 | $2.25 | $0.59 | $1.66 | $0.00 | 0 |
| AK01 | $2.08 | $0.19 | $1.87 | 90.1 | |
| WI03 | $2.01 | $1.98 | $0.00 | $0.03 | 1.5 |
| IA01 | $1.99 | $0.23 | $0.02 | $1.75 | 87.5 |
| TN09 | $1.98 | $0.02 | $1.37 | $0.60 | 30.1 |
| Totals include broadcast, local cable, connected TV (CTV), digital (including Meta, Google, Snapchat and X), network cable, radio, satellite, and network broadcast. *Total spending will in some rows be greater than the sum of candidate and group spending, as the total includes any spending by party coordinated ads with candidates. CITE SOURCE OF DATA AS: AdImpact with analysis by the Wesleyan Media Project. |
|||||
Outside Groups Dominate MI Senate Spending
The high-profile Michigan Senate race saw over $76 million in ad spending since mid-June, with 88 percent of that coming from groups. The United Democracy Project spent $30.5 million on ads in support of Haley Stevens in the Democratic primary, while another pro-Stevens group, A Stronger Michigan, spent $14.3 million. The winning candidate, Abdul El-Sayed, was heavily out-spent by pro-Stevens forces.
In the closely-watched Texas Senate race, almost all ad spending has come from the campaign of Democrat James Talarico, which has spent $18.1 million since June 15. By contrast, Republican nominee Ken Paxton has spent only $90,000 on advertising during that time period. Talarico is the heaviest spending candidate in the country since mid-June, and his campaign’s spending is surpassed only by three other interest groups.
In the Maine Senate race, 80 percent of the nearly $40M in ad spending has been sponsored by outside groups. Nearly 30 groups have sponsored ads across platforms in that race, with some like Majority Forward and Affordable Maine, attacking the incumbent Susan Collins, with others promoting Collins (e.g., One Nation) or attacking the current (Troy Jackson) and former (Graham Platner) Democratic nominees. Pine Tree Results PAC, for example, has spent nearly $10M on political ads on behalf of Susan Collins since the middle of June.
Table 6: Most Expensive Races for U.S. Senate (6/15/26-8/9/26)
(in $Ms) | (in $Ms) | (in $Ms) | (in $Ms) | ||
|---|---|---|---|---|---|
| MI | $76.53 | $8.10 | $1.48 | $66.95 | 87.5 |
| OH | $50.27 | $11.23 | $4.28 | $34.30 | 68.2 |
| ME | $38.99 | $3.10 | $4.38 | $31.09 | 79.7 |
| GA | $21.52 | $13.85 | $0.29 | $7.39 | 34.3 |
| TX | $18.42 | $18.06 | $0.12 | $0.22 | 1.2 |
| MN | $17.98 | $4.58 | $0.59 | $12.81 | 71.2 |
| AK | $16.71 | $3.00 | $1.08 | $12.24 | 73.3 |
| IA | $16.44 | $0.66 | $0.00 | $15.42 | 93.8 |
| NC | $15.59 | $5.06 | $1.75 | $8.78 | 56.3 |
| NH | $11.44 | $1.03 | $0.00 | $10.30 | 90 |
| NE | $6.21 | $0.00 | $2.73 | $3.44 | 55.4 |
| LA | $5.79 | $0.01 | $1.59 | $4.19 | 72.5 |
| MA | $5.09 | $2.22 | $0.01 | $2.86 | 56.2 |
| MT | $4.95 | $0.00 | $0.57 | $3.89 | 78.7 |
| SC | $4.88 | $0.78 | $1.69 | $2.08 | 42.6 |
| KS | $4.67 | $2.25 | $2.42 | 51.8 | |
| AR | $2.35 | $0.01 | $0.00 | $2.34 | 99.7 |
| AL | $1.42 | $0.18 | $1.25 | 87.6 | |
| CO | $1.33 | $0.97 | $0.22 | 16.7 | |
| Totals include broadcast, local cable, connected TV (CTV), digital (including Meta, Google, Snapchat and X), network cable, radio, satellite, and network broadcast. *Total spending will in some rows be greater than the sum of candidate and group spending, as the total includes any spending by party coordinated ads with candidates. CITE SOURCE OF DATA AS: AdImpact with analysis by the Wesleyan Media Project. |
|||||
About the Data
Advertising issue data reported here come from original Wesleyan Media Project human coding of the television ads from AdImpact unless otherwise specified below. References to Biden and to MAHA issues come from textual searches of the transcripts of the ads only (for MAHA we searched for MAHA, Make America Healthy Again, and RFK).
Advertising spending data reported here for 2025-2026 come from AdImpact with analysis by the Wesleyan Media Project. All cost estimates for ad spending by medium use AdImpact’s methodology.
The CTV category includes ads distributed over devices where an input is connected to a television (e.g., Apple TV, PlayStation, etc), streaming via set-top-boxes, including video on demand (e.g., Dish or XFINITY streaming) and in apps available on smart TVs (e.g., YouTube or the Hulu app, etc).
About this Report
The Wesleyan Media Project provides real-time tracking and analysis of all political television advertising in an effort to increase transparency in elections. Housed in Wesleyan’s Hazel Quantitative Analysis Center – part of the Allbritton Center for the Study of Public Life – the Wesleyan Media Project is the successor to the Wisconsin Advertising Project, which disbanded in 2009. It is directed by Erika Franklin Fowler, professor of government at Wesleyan University, Michael M. Franz, professor of government at Bowdoin College and Travis N. Ridout, professor of political science at Washington State University. WMP personnel include Breeze Floyd (Program Manager), Pavel Oleinikov (Associate Director, QAC) and Donny Snyder (Post-Doctoral Fellow).
The Wesleyan Media Project’s real-time tracking in 2026 is supported by Wesleyan University and the John S. and James L. Knight Foundation. The Wesleyan Media Project is partnering again this year with OpenSecrets, to provide added information on outside group disclosure and candidate status.
The Wesleyan Media Project’s digital advertising tracking is supported by the contributions of students in Delta Lab, an interdisciplinary research collaborative focusing on computationally-driven and innovative analyses and visualizations of media messaging. We are also grateful to our Coding Supervisors Saul Ferholt-Kahn and Helen Xie, as well as Ben Berlin and Raissa Fernandes, and the numerous student research assistants who facilitate additional content analysis of television and digital advertising.
Periodic releases of data will be posted on the project’s website and dispersed via LinkedIn, Bluesky @wesmediaproject.bsky.social and Twitter @wesmediaproject. To be added to our email update list, click here.
For more information contact: media@wesleyan.edu.
About Wesleyan University
Wesleyan University, in Middletown, Conn., is known for the excellence of its academic and co-curricular programs. With more than 2,900 undergraduates and 200 graduate students, Wesleyan is dedicated to providing a liberal arts education characterized by boldness, rigor and practical idealism. For more, visit www.wesleyan.edu.
About the John S. and James L. Knight Foundation
We are social investors who support democracy by funding free expression and journalism, arts and culture in community, research in areas of media and democracy, and in the success of American cities and towns where the Knight brothers once had newspapers. Learn more at kf.org and follow @knightfdn on social media.