Cost of Living and Taxes Top Issue Mentions in Congressional Spots
(MIDDLETOWN, CT) October 1, 2026 – Spending on ads in U.S. Senate races approached $500 million in the period between September 8 (the day after Labor Day) and September 27. Of that, over $112 million was devoted to ads in the Texas Senate race, as Table 1 shows. Notably, the Republican candidate, Ken Paxton, spent almost no money on ads (though he did coordinate on some spending with the Republican Party—about $800,000), while outside groups made up 82.5 percent of the ad spending in that race during this time frame. The vast majority of that spending was on behalf of Paxton, as only 20 percent of the ads in the Texas Senate race favored Democrat James Talarico. One group spending aggressively in the race in the previous three weeks is President Trump’s Super PAC, MAGA, Inc. It sponsored $18 million in ads, largely on CTV and digital platforms. (See our “About the Data” section for more information on which ads fall into different categories.)
Spending in the Senate race in Ohio nearly matched the Texas totals, with $90 million in ad spending since Labor Day. Here, too, outside groups dominated the air war, with groups responsible for over 77 percent of the ad spending. The Democratic challenger, Sherrod Brown, only benefited from 36 percent of the ad spending, with roughly two-thirds of ad spending on behalf of the Republican incumbent, Jim Husted. Husted, like Paxton, has also spent very little money directly from his campaign, though he did coordinate with the Republican Party on about $8 million in ads in this time period.
All told, nine Senate races featured at least $20 million in political ads since Labor Day, and in those races, pro-Republican spending exceeded pro-Democratic spending in eight. Outside groups made up at least 67 percent of the ad spending in these same eight races. Among these top races, only in Georgia was spending on pro-Democratic advertising higher than spending on pro-Republican advertising.
Table 1: Most Expensive Races for U.S. Senate (9/8/26 to 9/27/26)
(in $Ms) | Spend (in $Ms) | Spend (in $Ms) | (in $Ms) | |||
|---|---|---|---|---|---|---|
| TX | $112.58 | $18.73 | $0.25 | $92.91 | 82.5 | 20 |
| OH | $90.21 | $10.17 | $0.01 | $69.74 | 77.3 | 36.1 |
| MI | $56.95 | $8.69 | $0.28 | $39.14 | 68.7 | 39.5 |
| NC | $39.77 | $7.50 | $1.54 | $28.42 | 71.5 | 42.3 |
| IA | $36.63 | $5.08 | $0.49 | $26.51 | 72.4 | 38.6 |
| ME | $32.67 | $5.32 | $0.57 | $24.74 | 75.7 | 44.4 |
| GA | $29.07 | $12.46 | $0.10 | $16.51 | 56.8 | 62.2 |
| NH | $25.45 | $3.17 | $0.84 | $18.63 | 73.2 | 38.8 |
| AK | $22.20 | $3.13 | $0.34 | $17.37 | 78.2 | 35.8 |
| NE | $9.57 | $1.77 | $6.72 | 70.2 | 0.0** | |
| FL | $5.65 | $0.09 | $2.12 | $3.44 | 60.9 | 2.5 |
| KS | $4.88 | $1.75 | $1.54 | $1.60 | 32.7 | 61.7 |
| SC | $3.76 | $3.23 | $0.00 | $0.53 | 14.2 | 85.7 |
| AR | $2.40 | $0.04 | $1.95 | $0.41 | 17.1 | 2.1 |
| MT | $1.73 | $0.00 | $0.50 | $1.11 | 64.1 | 0.0** |
| MN | $1.39 | $0.49 | $0.70 | $0.06 | 4.4 | 35.8 |
| MS | $1.23 | $0.23 | $0.46 | $0.55 | 44.5 | 24.7 |
| VA | $0.97 | $0.74 | $0.23 | 23.8 | 100 | |
| SD | $0.96 | $0.20 | $0.44 | 46.3 | 0.0** | |
| KY | $0.74 | $0.01 | $0.72 | $0.01 | 1.4 | 1.8 |
| ID | $0.55 | $0.51 | $0.04 | 7.2 | 0 | |
| LA | $0.52 | $0.01 | $0.02 | $0.48 | 92.7 | 4.5 |
| CO | $0.18 | $0.05 | $0.00 | 0.8 | 29.6** | |
| NM | $0.17 | $0.17 | $0.00 | $0.00 | 0 | 99.8 |
| WV | $0.15 | $0.00 | $0.02 | $0.13 | 87.7 | 0.4 |
| TN | $0.07 | $0.00 | $0.07 | 99.1 | 0 | |
| DE | $0.06 | $0.06 | 0 | 100 | ||
| RI | $0.04 | $0.04 | 0 | 100 | ||
| NJ | $0.01 | $0.01 | $0.00 | 7.3 | 100 | |
| IL | $0.01 | $0.01 | $0.00 | $0.00 | 16.2 | 90.5 |
| MA | $0.01 | $0.01 | $0.00 | $0.00 | 15 | 40.6 |
| AL | $0.00 | $0.00 | $0.00 | 59.3 | 0 | |
| OK | $0.00 | $0.00 | $0.00 | 68.3 | 1.6 | |
| WY | $0.00 | $0.00 | $0.00 | 5 | 0 | |
| OR | $0.00 | $0.00 | 0 | 100 | ||
| Totals include broadcast, local cable, connected TV (CTV), digital (including Meta, Google, Snapchat and X), network cable, radio,satellite, and network broadcast. *Total spending will be greater in some rows than the sum of candidate and group spending because the total also includes any spending on party coordinated ads with candidates. **This percentage is the Democratic percentage of total. The total includes spending on behalf of the Independent candidate. CITE SOURCE OF DATA AS: AdImpact with analysis by the Wesleyan Media Project. |
||||||
Democrats, Republicans Evenly Matched in Top House Race Spending
Table 2 lists the top House races by spending since Labor Day. Twenty races have seen over $5 million in spending, and two have seen over $9 million in spending. Those two races are in Iowa’s 1st congressional district, where incumbent Republican Mariannette Miller-Meeks faces Democratic challenger Christina Bohannan, and in Colorado’s 8th congressional district, a race that pits incumbent Republican Gabe Evans against Democrat Manny Rutinel.
Spending on behalf of Republican and Democratic candidates in many of these top House races is fairly evenly matched, as the final column of the table shows. The percentage of Democratic spending in most of the top races tends to stay relatively close to 50 percent, suggesting that race-by-race neither party has a consistent advantage right now when it comes to advertising spending. As we show later in the report, though, in total pro-Democratic spots in House races out-number pro-Republican spots on broadcast television stations in the past few weeks.
Also note that groups are heavily involved in many of the top races, with their spending topping combined candidate spending in most of the top races.
Table 2: Most Expensive Races for U.S. House (9/8/26 to 9/27/26)
(in $Ms) | Spend (in $Ms) | Spend (in $Ms) | (in $Ms) | |||
|---|---|---|---|---|---|---|
| IA01 | $9.40 | $2.36 | $1.41 | $4.89 | 52.1 | 47.1 |
| CO08 | $9.34 | $1.23 | $0.55 | $6.31 | 67.5 | 44.8 |
| NC01 | $7.89 | $1.04 | $0.07 | $4.92 | 62.4 | 63.4 |
| TX34 | $7.80 | $0.18 | $0.27 | $5.95 | 76.2 | 52.9 |
| WI03 | $7.40 | $1.84 | $1.74 | $2.64 | 35.7 | 57 |
| FL25 | $7.00 | $0.98 | $0.00 | $4.61 | 65.8 | 42.5 |
| MI04 | $6.70 | $0.84 | $0.46 | $5.01 | 74.8 | 53.1 |
| CA22 | $6.36 | $0.67 | $0.06 | $4.58 | 72 | 51.5 |
| NY17 | $6.29 | $2.07 | $0.72 | $1.58 | 25.1 | 45.6 |
| NJ07 | $6.24 | $1.99 | $0.61 | $2.29 | 36.7 | 40.9 |
| AZ01 | $6.04 | $1.27 | $0.00 | $3.65 | 60.4 | 52.9 |
| IA03 | $5.95 | $1.48 | $1.09 | $2.52 | 42.3 | 43.1 |
| MI07 | $5.73 | $0.65 | $0.59 | $3.81 | 66.4 | 32.8 |
| OH09 | $5.57 | $0.59 | $0.09 | $3.68 | 66 | 39.9 |
| VA02 | $5.41 | $1.42 | $0.74 | $2.55 | 47.1 | 58.1 |
| PA10 | $5.37 | $1.27 | $0.75 | $2.48 | 46.1 | 44.2 |
| PA08 | $5.37 | $0.92 | $0.95 | $2.83 | 52.8 | 45.6 |
| NY03 | $5.32 | $1.04 | $0.00 | $3.24 | 60.8 | 19.7 |
| AZ06 | $5.30 | $0.62 | $0.55 | $2.93 | 55.3 | 52.3 |
| WA03 | $5.12 | $0.62 | $0.21 | $2.49 | 48.6 | 30.6 |
| NC11 | $4.35 | $0.72 | $0.06 | $2.87 | 66.1 | 53.2 |
| NM02 | $4.34 | $1.14 | $0.19 | $1.64 | 37.7 | 43.6 |
| IA02 | $4.21 | $0.86 | $0.18 | $2.75 | 65.3 | 57.2 |
| TX15 | $4.14 | $1.02 | $0.48 | $2.64 | 63.7 | 62.8 |
| VA01 | $4.13 | $0.99 | $1.29 | $1.84 | 44.7 | 68.7 |
| AK01 | $3.67 | $0.26 | $2.30 | 62.8 | 22.2** | |
| ME02 | $3.51 | $0.41 | $0.60 | $2.18 | 62 | 38 |
| NE02 | $3.48 | $0.26 | $0.13 | $2.22 | 63.9 | 53.6 |
| TX28 | $3.35 | $0.35 | $0.08 | $1.82 | 54.4 | 42.2 |
| OH07 | $3.31 | $0.62 | $0.74 | $1.17 | 35.2 | 58.3 |
| MI10 | $3.28 | $0.05 | $0.00 | $1.14 | 34.8 | 48.3 |
| PA07 | $3.16 | $0.79 | $0.37 | $0.97 | 30.7 | 42.9 |
| FL14 | $2.94 | $1.05 | $0.00 | $1.34 | 45.7 | 44.2 |
| CA48 | $2.76 | $0.72 | $0.06 | $1.38 | 49.9 | 76.2 |
| CO05 | $2.64 | $0.84 | $0.49 | $1.31 | 49.6 | 43.9 |
| OH01 | $2.45 | $0.97 | $0.19 | $0.65 | 26.5 | 47.3 |
| NH01 | $2.37 | $0.04 | $0.08 | $1.34 | 56.4 | 58.1 |
| TX35 | $2.30 | $0.25 | $0.00 | $1.93 | 84 | 10.6 |
| NV03 | $2.24 | $1.10 | $0.45 | $0.00 | 0.1 | 49.7 |
| CA13 | $2.09 | $0.13 | $0.03 | $1.15 | 54.8 | 13.1 |
| NY21 | $1.96 | $0.91 | $1.05 | 0 | 46.5 | |
| CA04 | $1.87 | $1.83 | $0.05 | 2.5 | 100 | |
| MI08 | $1.79 | $0.52 | $0.00 | $1.27 | 71 | 30.6 |
| WI01 | $1.78 | $0.31 | $0.81 | $0.65 | 36.8 | 18.2 |
| KY06 | $1.70 | $0.41 | $0.26 | $1.02 | 60.2 | 50.9 |
| VA05 | $1.65 | $0.57 | $0.10 | $0.99 | 59.7 | 87.6 |
| NV01 | $1.52 | $0.60 | $0.05 | $0.00 | 0.2 | 38.7 |
| MT01 | $1.39 | $0.63 | $0.12 | $0.34 | 24.5 | 47.8 |
| CA06 | $1.34 | $0.04 | $0.35 | 26.3 | 44.2 | |
| PA01 | $1.11 | $0.04 | $0.99 | $0.08 | 7.6 | 3.7 |
| FL13 | $1.08 | $0.61 | $0.29 | $0.18 | 16.5 | 73 |
| VA07 | $1.02 | $1.01 | 0 | 99.2** | ||
| SC01 | $0.96 | $0.70 | $0.00 | $0.27 | 27.6 | 72.8 |
| LA06 | $0.95 | $0.78 | $0.16 | 17.1 | 0 | |
| OH15 | $0.90 | $0.19 | $0.61 | $0.11 | 11.8 | 32.9 |
| CO03 | $0.88 | $0.24 | $0.52 | $0.01 | 0.6 | 27.7 |
| OH13 | $0.84 | $0.83 | $0.01 | 1.3 | 100 | |
| AZ02 | $0.83 | $0.65 | $0.15 | $0.04 | 4.4 | 77.4 |
| AL02 | $0.78 | $0.02 | $0.14 | 18.4 | 76.6 | |
| FL22 | $0.75 | $0.42 | $0.33 | $0.00 | 0.4 | 56.1 |
| AR02 | $0.72 | $0.54 | $0.19 | 25.9 | 0 | |
| NY04 | $0.70 | $0.08 | $0.18 | $0.06 | 7.9 | 19.3 |
| NY19 | $0.70 | $0.44 | $0.26 | $0.00 | 0 | 63.6 |
| OH10 | $0.67 | $0.05 | $0.61 | 91.8 | 91.7 | |
| CA07 | $0.66 | $0.59 | $0.08 | 11.8 | 100 | |
| VA06 | $0.66 | $0.61 | $0.06 | $0.00 | 0.1 | 91.3 |
| FL09 | $0.59 | $0.24 | $0.02 | $0.00 | 0 | 97.2 |
| TX24 | $0.58 | $0.58 | 100 | 0 | ||
| MA01 | $0.57 | $0.30 | 0 | 53.8** | ||
| CA11 | $0.54 | $0.44 | $0.10 | 18.3 | 100 | |
| CA40 | $0.53 | $0.00 | $0.53 | 100 | 0 | |
| MN01 | $0.52 | $0.36 | $0.16 | $0.00 | 0.3 | 70.1 |
| CO04 | $0.51 | $0.50 | $0.01 | 2.8 | 97.1 | |
| Totals include broadcast, local cable, connected TV (CTV), digital (including Meta, Google, Snapchat and X), network cable, radio, satellite, and network broadcast. *Total spending will be greater in some rows than the sum of candidate and group spending because the total also includes any spending on party coordinated ads with candidates. **This percentage is the Democratic percentage of total spending. The total includes spending on behalf of the Independent candidate. CITE SOURCE OF DATA AS: AdImpact with analysis by the Wesleyan Media Project. |
||||||
Ohio Leads in Gov Spending
The race for governor in Ohio continues to top our list of most expensive gubernatorial races, with $33 million in spending since Labor Day. Almost two-thirds of that advertising has supported Republican candidate Vivek Ramaswamy, while just over one-third has supported Democratic candidate Amy Acton. A bit over half of the ad spending ($17.8 million) came from groups.
The Republican advantage in the gubernatorial races in Texas and Georgia is even more lopsided, with pro-Democratic ads making up only 15 percent of spending in Texas and 8 percent in Georgia over the past three weeks.
Democrats have also been out-spent in Wisconsin and Florida. In Wisconsin, 45 percent of ad spending has come from outside groups, whereas only 6 percent of spending in the Florida race is from groups.
Table 3: Most Expensive Races for Governor (9/8/26 to 9/27/26)
(in $Ms) | Spend (in $Ms) | Spend (in $Ms) | (in $Ms) | |||
|---|---|---|---|---|---|---|
| OH | $33.30 | $6.08 | $9.43 | $17.78 | 53.4 | 34.8 |
| TX | $24.27 | $3.67 | $20.40 | $0.20 | 0.8 | 15.4 |
| GA | $22.92 | $0.03 | $21.15 | $0.09 | 0.4 | 7.5 |
| WI | $19.51 | $3.19 | $7.50 | $8.82 | 45.2 | 34.8 |
| FL | $18.72 | $1.11 | $1.20 | $0.99 | 5.3 | 5.9 |
| MI | $16.58 | $2.95 | $0.27 | $13.36 | 80.6 | 56.4 |
| IA | $12.60 | $6.70 | $5.89 | $0.01 | 0 | 53.4 |
| NV | $10.42 | $1.31 | $1.36 | $7.73 | 74.2 | 44 |
| PA | $9.05 | $9.00 | $0.04 | $0.01 | 0.2 | 99.5 |
| NY | $8.65 | $3.25 | $4.21 | $1.19 | 13.7 | 51.4 |
| AZ | $7.68 | $0.35 | $0.20 | $0.47 | 6.2 | 82.1 |
| MA | $6.11 | $1.58 | $4.19 | $0.29 | 4.7 | 30.7 |
| MN | $6.01 | $1.22 | $1.09 | $2.80 | 46.6 | 35.3 |
| OR | $5.89 | $3.61 | $2.28 | $0.00 | 0 | 61.6 |
| IL | $4.98 | $4.96 | $0.01 | $0.02 | 0.3 | 99.5 |
| CT | $4.27 | $1.56 | $2.71 | $0.01 | 0.2 | 36.8 |
| KS | $4.11 | $0.48 | $0.00 | $3.63 | 88.4 | 11.5 |
| TN | $3.79 | $0.01 | $0.16 | $1.32 | 34.8 | 0.2** |
| NE | $2.55 | $0.83 | $1.72 | $0.00 | 0 | 32.7 |
| AL | $2.52 | $0.93 | $1.59 | $0.00 | 0 | 36.7 |
| NH | $1.70 | $0.13 | $1.57 | 0 | 7.6 | |
| ME | $1.25 | $0.65 | $0.02 | $0.58 | 46.6 | 98.1 |
| NM | $1.24 | $1.21 | $0.03 | $0.00 | 0 | 97.2 |
| AR | $0.93 | $0.93 | 0 | 0 | ||
| MD | $0.49 | $0.49 | $0.00 | $0.00 | 0 | 99.9 |
| CA | $0.46 | $0.25 | $0.18 | $0.03 | 5.6 | 62.3 |
| RI | $0.36 | $0.16 | $0.00 | $0.19 | 51.4 | 94.4 |
| MS | $0.24 | $0.24 | 0 | 0 | ||
| AK | $0.21 | $0.21 | $0.00 | 0 | 99.3 | |
| CO | $0.17 | $0.17 | $0.00 | $0.00 | 0.2 | 98.9 |
| HI | $0.08 | $0.08 | $0.00 | 0 | 98.6 | |
| VT | $0.05 | $0.00 | $0.05 | $0.00 | 0.1 | 0.2 |
| SD | $0.01 | $0.01 | $0.00 | $0.00 | 3.4 | 89.9 |
| OK | $0.01 | $0.01 | $0.00 | 5.7 | 0 | |
| SC | $0.01 | $0.00 | $0.01 | $0.00 | 9.9 | 1.8 |
| WY | $0.00 | $0.00 | $0.00 | 78.2 | 0 | |
| ID | $0.00 | $0.00 | 0 | 0 | ||
| Totals include broadcast, local cable, connected TV (CTV), digital (including Meta, Google, Snapchat and X), network cable, radio, satellite, and network broadcast. *Total spending will be greater in some rows than the sum of candidate and group spending because the total also includes any spending on party coordinated ads with candidates. **This percentage is the Democratic percentage of total. The total includes spending on behalf of the Independent candidate. CITE SOURCE OF DATA AS: AdImpact with analysis by the Wesleyan Media Project. |
||||||
Three Taxpayer-Funded Ads Feature Trump
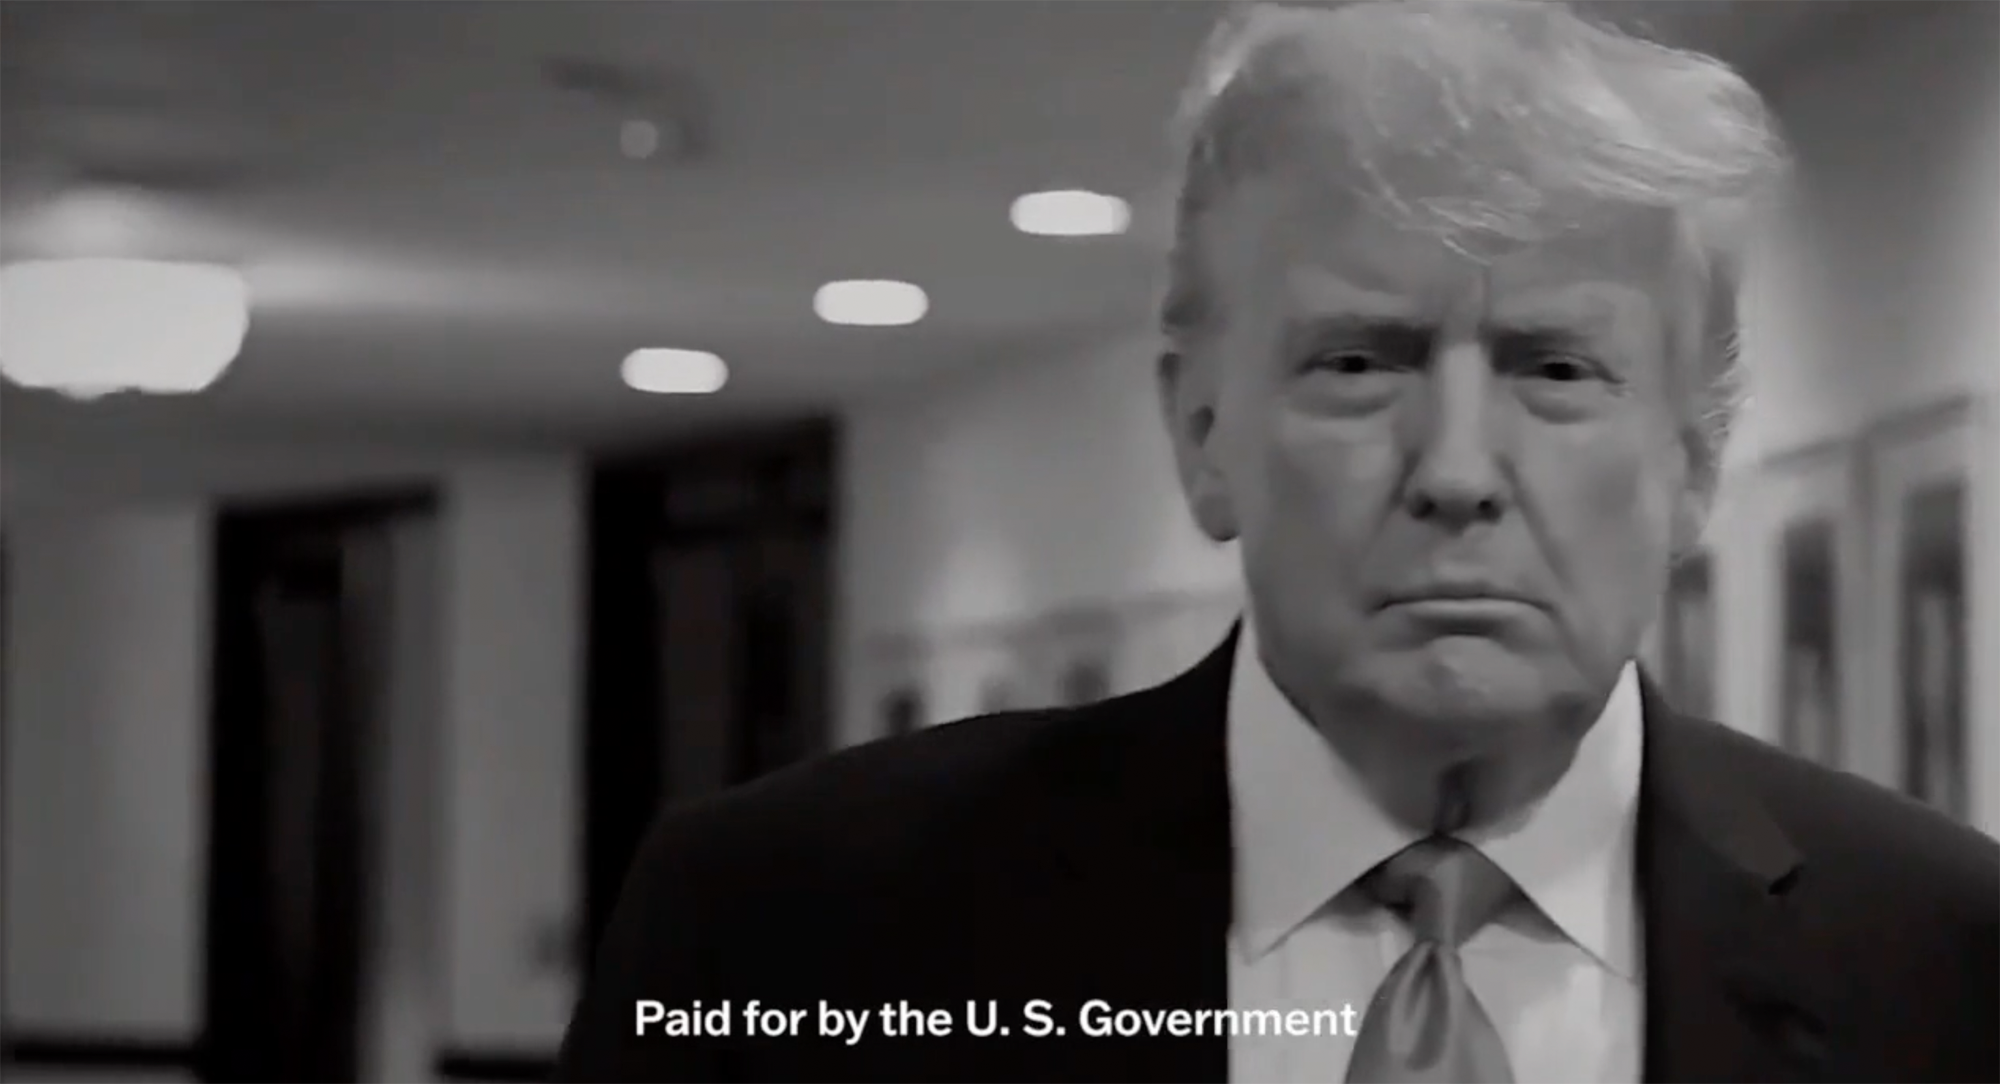
The U.S. government has spent $3.5 million in the past week on three different ads featuring Donald Trump. The first ad, which debuted on cable and broadcast channels on September 23, features Trump speaking about “defeating communism, socialism and Marxism in America.” $1.37 million has been spent on this ad as of September 30.
The second ad started airing on broadcast and cable channels on September 24. This ad, backed by $693,000 in spending, is also voiced by Trump. Against the backdrop of images like Mount Rushmore, Trump declares that “the United States of America is the most successful, most accomplished, most exceptional nation ever to exist in human history.”
The third ad, which started airing on September 26, has cost taxpayers $1.46 million so far. This ad, which is also being seen on broadcast and cable television, is voiced by Trump. While photos of Trump are shown on the screen, Trump states: “We will demolish the deep state. We will expel the warmongers from our government. We will drive out the globalists. We will cast out the communists, Marxists, and fascists.”
“I’m struggling to recall any ads like these in the past,” said Travis Ridout, co-director of the Wesleyan Media Project. “When the U.S. government has funded paid ads in the past, it’s generally been to make the public aware of particular benefits they may be eligible for, whereas the recent ads closely resemble campaign ads.”
Nearly $1 Billion in Ad Spending since Labor Day; Local Broadcast Accounts for Nearly 60 Percent
Ad spending in congressional and gubernatorial races since Labor Day totaled nearly $1 billion (Table 4). Ad spending in these races cycle-to-date totaled over $4.7 billion, meaning 20 percent of ad spending has happened in the roughly three weeks since Labor Day. In the full cycle, about 49 percent of ad spending across mediums was for ads on local broadcast stations. For the period between September 8 and 27, however, broadcast ad spending accounted for 58 percent of ad spending, suggesting ad sponsors see particular value in traditional ad mediums in the heat of the general election—or that they are having difficulty securing inventory on CTV, streaming and local cable.
Outside groups are dominating the landscape of ad spending in U.S. Senate races—and to a lesser extent in U.S. House races. In Senate races, groups account for 72 percent of ad spending since Labor Day. In House races, outside groups accounted for the plurality (49 percent) of ad spending since Labor Day. It is important to realize, however, that outside groups pay more for broadcast ads than candidates, who are given the lowest unit rate for these ads in the 45 days before a primary election and the 60 days before a general election. Because of that, the imbalance in ad spending between candidates and groups is greater for broadcast spots than for cable, digital, radio, and CTV ads—all of which are exempt from the lowest unit rate provision.
Table 4: Spending by Office, Sponsor Type and Media Channel (9/8/26 to 9/27/26)
(in $Ms) | (in $Ms) | (in $Ms) | (in $Ms) | (in $Ms) | (in $Ms) |
||
|---|---|---|---|---|---|---|---|
| Governor | Candidate | 76.2 | 38.34 | 15.69 | 12.42 | 4.27 | 146.92 |
| Issue Group | 34.45 | 11.78 | 5.91 | 4.56 | 2.81 | 59.51 | |
| Coordinated | 13.4 | 8.98 | 0.77 | 1.45 | 0.11 | 24.71 | |
| Senate | Candidate | 49.55 | 23.11 | 16.62 | 5.75 | 2.59 | 97.62 |
| Issue Group | 201.5 | 78.1 | 32.3 | 22.62 | 15.29 | 349.79 | |
| Coordinated | 20.62 | 7.87 | 0.13 | 3.44 | 1.09 | 33.16 | |
| House | Candidate | 47.16 | 18.06 | 8.04 | 6.68 | 1.34 | 81.28 |
| Issue Group | 78.39 | 18.92 | 11.39 | 4.02 | 1.48 | 114.19 | |
| Coordinated | 30.84 | 6.26 | 0.23 | 1.62 | 0.28 | 39.23 | |
| Total | $552.10 | $211.41 | $91.08 | $62.55 | $29.25 | $946.40 | |
| % | 58.3% | 22.3% | 9.6% | 6.6% | 3.1% | ||
| Other includes network cable, radio, satellite, and network broadcast CTV includes spending on streaming, CTV devices and in-app ads. Digital includes spending on Meta, Google, Snapchat, and X CITE SOURCE OF DATA AS: AdImpact with analysis by the Wesleyan Media Project. |
|||||||
Ad-level spending differences are not the only explanation for the heavy spending by outside groups. Groups are also airing significant volumes of ads, especially in Senate races. In those campaigns, since Labor Day, outside groups have aired 50.6 percent of broadcast spots (Table 5). In House races, outside groups sponsored 27 percent of broadcast spots.
Figure 1: Advertising Spending by Office, Party, and Platform (9/8/26 to 9/27/26)
Other includes network cable, radio, satellite, and network broadcast
CTV includes spending on streaming, CTV devices and in-app ads.
Digital includes spending on Meta, Google, Snapchat, and X
CITE SOURCE OF DATA AS: AdImpact with analysis by the Wesleyan Media Project.
Coordinated Spending Rises in Recent Weeks
Another trend noted in these data is the increased volume of party-candidate coordinated spending in recent weeks. In June 2026, the Supreme Court overturned long-standing caps on coordinated expenditures between party committees and candidates, and on September 4, 2026, the Supreme Court’s emergency stay allowed party committee coordinated spending to qualify for the same lowest unit rate cost enjoyed by candidates. Now, parties and candidates can work together in an election on unlimited spending at less expensive rates for advertising, which is noteworthy since the contribution limits to party committees are much higher than the contribution limits to candidates. Donors can donate to a party committee with the understanding that the party will re-direct that money into ad buys jointly planned with the favored candidate.
In the full cycle-to-date, coordinated spending is only 4 percent of the $4.7 billion spent on ads. In the period since Labor Day, however, coordinated spending is 10.2 percent of total ad spending in federal and gubernatorial races. It is higher in House races (nearly 20 percent of spending) than in Senate races (almost 8 percent of spending). If we shift the focus from spending to airings, we find that in Senate races, coordinated spots make up 12 percent of ad airings and are double that (23.5 percent) in House races.
Table 5: Broadcast Airings by Office and Sponsor Type (9/8/26 to 9/27/26)
(in $Ms) | spending | Airings | airings |
|
|---|---|---|---|---|
| Governor | ||||
| Candidate | 76.2 | 61.4% | 156,010 | 78.5% |
| Group | 34.45 | 27.8% | 24,462 | 12.3% |
| Coordinated | 13.4 | 10.8% | 18,362 | 9.2% |
| Total | 124.1 | 198,834 | ||
| Senate | ||||
| Candidate | 49.55 | 18.2% | 108,150 | 37.2% |
| Group | 201.5 | 74.2% | 146,997 | 50.6% |
| Coordinated | 20.62 | 7.6% | 35,262 | 12.1% |
| Total | 271.7 | 290,409 | ||
| House | ||||
| Candidate | 47.16 | 30.2% | 121,410 | 49.1% |
| Group | 78.39 | 50.1% | 67,746 | 27.4% |
| Coordinated | 30.84 | 19.7% | 58,038 | 23.5% |
| Total | 156.4 | 247,194 | ||
| CITE SOURCE OF DATA AS: AdImpact with analysis by the Wesleyan Media Project. | ||||
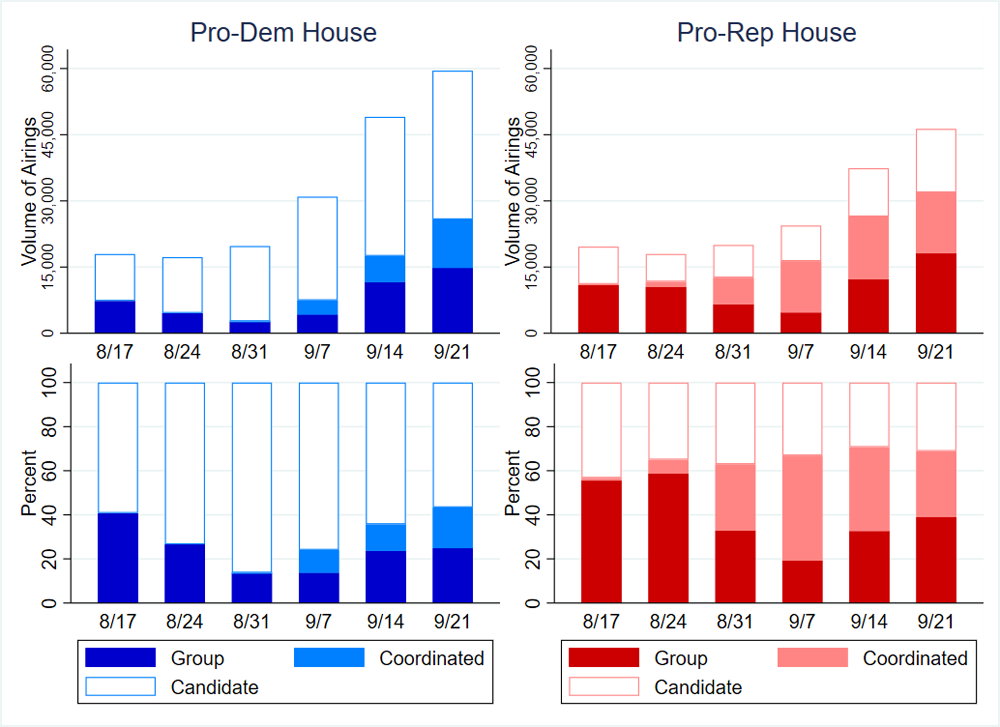
Figure 2 looks at the sponsorship of broadcast ads in House races by week since the week of August 17. We show ad volumes in the top panels and the share of airings by sponsor-type for Democrats and Republicans in the bottom panels. One finding is that Republicans have relied on coordinated spending at higher rates than Democrats. Yet the Democratic Party has increased its use of coordinated spending in the last few weeks, starting in the week after Labor Day. Overall, Democratic candidates account for a higher share of spending on behalf of their campaigns, while Republican House candidates have relied more on outside groups and party coordinated spending. In the last three weeks, pro-Democratic ads across all races have out-paced pro-Republican ads on broadcast stations.
Figure 2: Broadcast Airings in U.S. House Races by Party and Sponsor Type (8/17/26 to 9/27/26)
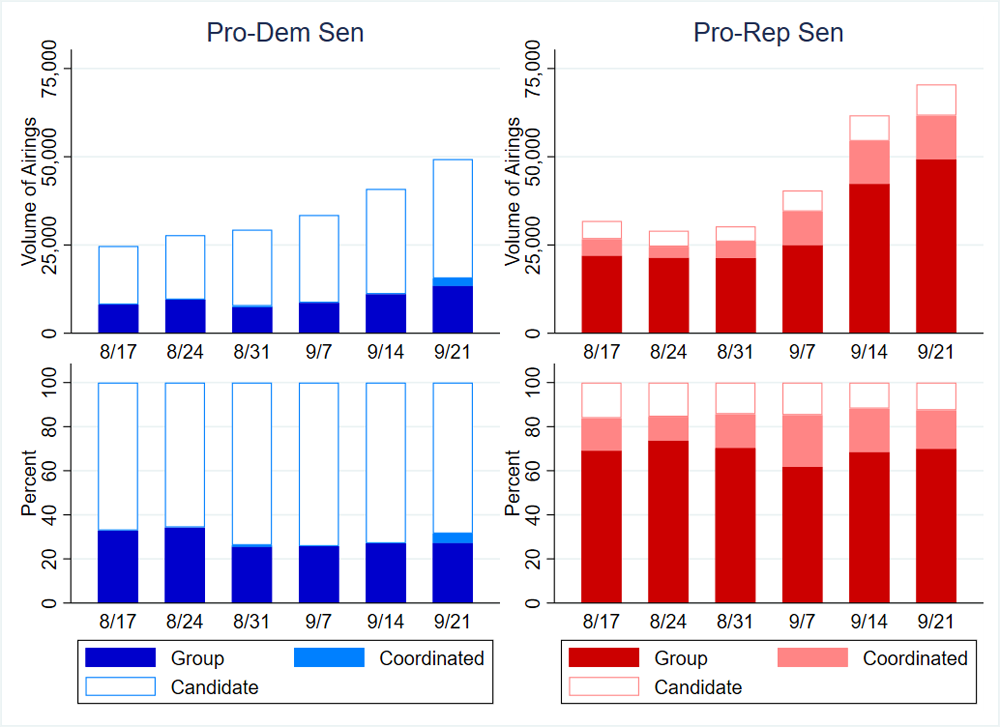
For Senate campaigns (Figure 3), we see much the same story but amplified. Republican candidates are responsible for a very small share of spending on their behalf, with outside groups making up over 60 percent of pro-GOP spots each week since mid-August. In contrast, Democratic coordinated spending in Senate races only picked up in the last week (the week of September 21) and is a small share of the spending on behalf of Senate Democrats. Senate Democratic candidates have sponsored roughly two-thirds of broadcast spots on their behalf each week since mid-August. Unlike in House races, in most weeks pro-GOP airings in Senate races have outpaced pro-Democratic airings on broadcast television, especially in the last two weeks.
“The difference between Democrats and Republicans in Senate broadcast spots is striking,” said Michael Franz, co-director of the Wesleyan Media Project. “Republican candidates are spending comparatively little from their own campaigns funds on broadcast spots, relying a lot on outside groups to pick up the slack. Democratic candidates, however, are disproportionately pulling the load on their own behalf. It will be interesting to see if this trend continues into October.”
Figure 3: Broadcast Airings in U.S. Senate Races by Party and Sponsor Type (8/17/26 to 9/27/26)
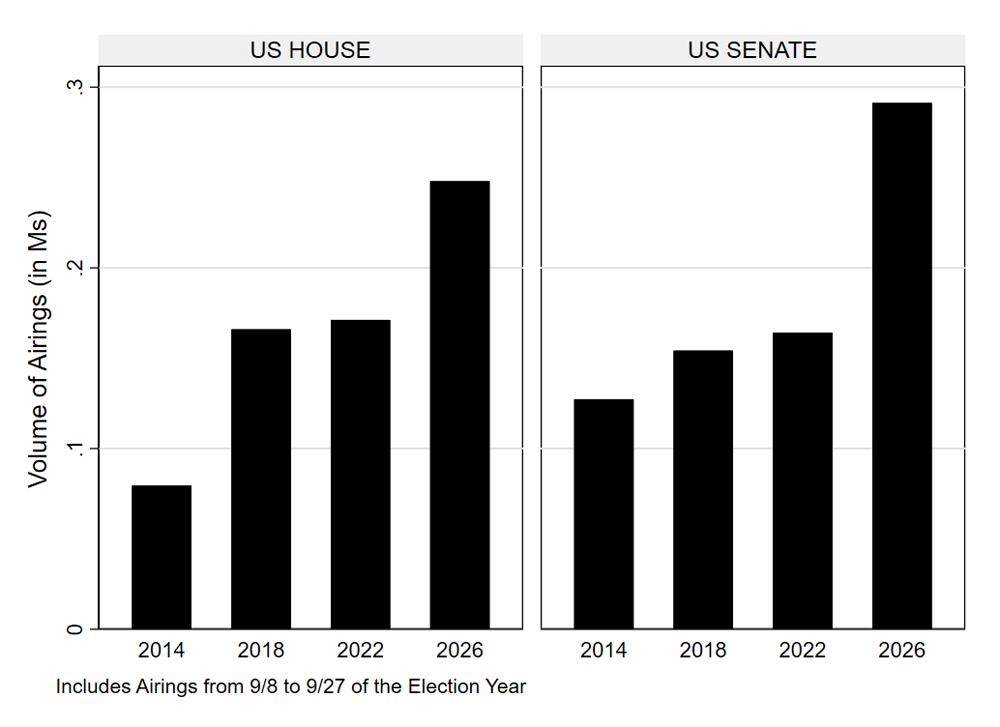
Finally, Figure 4 shows the volume of broadcast television airings since September 8 across the past four midterm election years for both the U.S. House and Senate. The story is clear: the volume of advertising since Labor Day greatly surpasses the volume in the previous three midterm election cycles, and this is true for races in both chambers. Since Labor Day, there have been about 250,000 ad airings in the House and almost 300,000 ad airings in Senate races.
Figure 4: Broadcast Airings in Congressional Races (9/8 to 9/27), 2014 to 2026
Economic Issues Dominate Discussion from Both Parties
The economy and cost of living issues are dominating the general election conversation in federal elections across the country.
“2026 is a midterm election cycle that is all about economic concerns,” said Erika Franklin Fowler, co-director of the Wesleyan Media Project. “Campaigns are well aware that Americans are increasingly stressed about paying for gas and groceries and are using their advertising to speak directly to concerns about costs, though Democrats and Republicans are framing that differently. While Democrats are leaning heavily into rising cost of living and unaffordable health care, Republicans are reminding voters that they are for lower taxes.”
In Senate contests, a third of all pro-Democratic broadcast ads on the air since Labor Day reference concerns about businesses, cost of living, and health care (including both cost and loss of insurance, Table 6). Nearly 30 percent of pro-Democratic ads in this time frame explicitly raise government ethics or corruption issues, and another 17 percent argue for campaign finance reform to remove big money from politics. A quarter of the ads describe energy prices as too high. Notably absent from pro-Democratic talking points in the fall campaign to-date (at least on broadcast stations) is the issue of abortion, which has been a featured issue for the past two cycles.
Ads for Senate Republicans are also talking about economic concerns, and while one in five contain a mention of their efforts to lower costs, nearly half (46 percent) make the case that Republicans favor lower taxes and Democrats prefer to raise them. Anti-trans attacks make up 18 percent of all ads for Senate Republicans, followed by trumpeting their activities to reduce crime and fix issues at the border.
Table 6: Top Issues in U.S. Senate Races (9/8/26 to 9/27/26)
| Pro-Dem | Pro-Rep | ||
|---|---|---|---|
| Business | 36.0% | Taxes | 46.1% |
| Cost of living | 35.7% | Cost of living | 19.9% |
| Health Care (not prescription drugs) | 33.8% | Anti-trans | 18.1% |
| Government Ethics / Scandal | 29.1% | Immigration | 15.1% |
| Energy Policy | 25.3% | Crime | 14.4% |
| Moral / Family / Religious Values | 17.5% | Business | 14.2% |
| Campaign Finance Reform | 16.5% | Health Care (not prescription drugs) | 13.4% |
| Taxes | 15.3% | Government Ethics / Scandal | 12.9% |
| Employment / Jobs | 14.7% | Police Brutality / Racial Violence | 10.7% |
| Domestic violence / sexual assault | 11.5% | Moral / Family / Religious Values | 9.5% |
| Based on ongoing Wesleyan Media Project classification of transcribed audio from broadcast advertising only, which may differ from final coding. CITE SOURCE OF DATA AS: AdImpact with analysis by the Wesleyan Media Project. |
|||
Nearly one out of every two pro-Democratic broadcast spots in U.S. House races features cost of living as a central issue (Table 7), with business concerns (40 percent) and health care (36 percent) not far behind. Corruption and money in politics are also being raised in ads for congressional Democrats, followed by concerns about veterans issues, energy, and the cost of prescription drugs.
Pro-Republican ads in U.S. House races are similar in the top two topics: they focus first and foremost on lowering taxes (41 percent) and second on cost of living (26 percent). Roughly a quarter (24 percent) of ads either attack Democratic opponents on ethical issues for enriching themselves or taking donations in exchange for tax hikes or tout the Republican candidate’s support for some ethics reform like banning Congress members from trading stocks.
Table 7: Top Issues in U.S. House Races (9/8/26 to 9/27/26)
| Pro-Dem | Pro-Rep | ||
|---|---|---|---|
| Cost of living | 47.3% | Taxes | 40.9% |
| Business | 39.8% | Cost of living | 26.3% |
| Health Care (not prescription drugs) | 36.0% | Government Ethics / Scandal | 23.7% |
| Government Ethics / Scandal | 27.7% | Moral / Family / Religious Values | 21.1% |
| Taxes | 25.8% | Business | 19.5% |
| Moral / Family / Religious Values | 21.5% | Energy Policy | 15.9% |
| Veterans | 16.7% | Health Care (not prescription drugs) | 15.6% |
| Campaign Finance Reform | 15.8% | Veterans | 14.0% |
| Energy Policy | 14.9% | Employment / Jobs | 13.7% |
| Prescription Drugs | 11.9% | Immigration | 13.6% |
| Based on ongoing Wesleyan Media Project classification of transcribed audio from broadcast advertising only, which may differ from final coding. CITE SOURCE OF DATA AS: AdImpact with analysis by the Wesleyan Media Project. |
|||
Despite the rhetoric at the 2026 Republican National Convention in Dallas, campaign advertising by and on behalf of Republican candidates has not focused a lot on socialism or communism, however, there is some discussion of these issues in roughly 7 percent of pro-Republican ads.
Trump Appearing Less Often in Ads, More Likely in Dem Attacks
While earlier in the primaries, very large portions of broadcast advertising from both parties featured Trump, federal advertising since Labor Day on television has featured the president much less often as measured through keyword searches of transcribed audio. When the president does appear, he is more likely to be attacked in pro-Democratic advertising than to be touted in pro-Republican messaging. (This analysis does not consider mentions of Trump in ads on CTV, cable, radio, or digital platforms.)
Overall, more than one in ten ads (12 percent) for Democratic House candidates contain an unflattering reference to Trump. Pro-Democratic outside groups are most likely to be doing the attacking as nearly a quarter (23 percent) of their ads mention the president. Not a single ad for Republican House candidates from any sponsor has contained a verbal mention of Trump, and in fact former president Joe Biden is referenced more often than Trump. Still, Biden only appears in 1 percent of pro-Republican airings in the House.
On the Senate side, pro-Democratic ads attack Trump less often than pro-Democratic House ads. Just under 9 percent of pro-Democratic Senate airings mention Trump. Group ads are more likely to mention Trump than candidate ads (15 percent compared to 7 percent respectively). Republican Senate candidates mention Trump in roughly a quarter of their advertising while pro-Republican outside groups have not mentioned the president at all. Coordinated airings between Republican candidates and the party have featured the president roughly 16 percent of the time and have been more likely to attack Biden, who appears in nearly a quarter (23 percent) of coordinated pro-Republican airings.
About the Data
Advertising spending data reported here for 2025-2026 come from AdImpact with analysis by the Wesleyan Media Project. All cost estimates for ad spending by medium use AdImpact’s methodology.
The CTV category includes ads distributed over devices where an input is connected to a television (e.g., Apple TV, PlayStation, etc), streaming via set-top-boxes, including video on demand (e.g., Dish or XFINITY streaming) and in apps available on smart TVs (e.g., YouTube or the Hulu app, etc).
Advertising historical airings data reported here come from original Wesleyan Media Project analysis of Vivvix/CMAG data for the 2012-2024 cycles and AdImpact for the current cycle.
Advertising content information on issue focus comes from ongoing Wesleyan Media Project trained classifiers applied to transcribed audio from 2026 cycle broadcast advertising and data on Trump mentions for this release also come from textual searches of transcribed audio, both of which may differ from final coding incorporating additional visual elements. In this case, our issue classifiers utilize machine learning methods to rate text trained from prior human, hand-coded data. Testing indicates an average precision of roughly 0.72, indicating a fairly high degree of human-machine reliability, though this varies by issue domain and should be interpreted cautiously.
About this Report
The Wesleyan Media Project provides real-time tracking and analysis of all political television advertising in an effort to increase transparency in elections. Housed in Wesleyan’s Hazel Quantitative Analysis Center – part of the Allbritton Center for the Study of Public Life – the Wesleyan Media Project is the successor to the Wisconsin Advertising Project, which disbanded in 2009. It is directed by Erika Franklin Fowler, professor of government at Wesleyan University, Michael M. Franz, professor of government at Bowdoin College and Travis N. Ridout, professor of political science at Washington State University. WMP personnel include Breeze Floyd (Program Manager), Pavel Oleinikov (Associate Director, QAC), and Donny Snyder (Post-Doctoral Fellow).
The Wesleyan Media Project’s real-time tracking in 2026 is supported by Wesleyan University and the John S. and James L. Knight Foundation. The Wesleyan Media Project is partnering again this year with OpenSecrets, to provide added information on outside group disclosure and candidate status, and we especially thank Brendan Glavin for his work.
The Wesleyan Media Project’s digital advertising tracking is supported by the contributions of students in Delta Lab, an interdisciplinary research collaborative focusing on computationally-driven and innovative analyses and visualizations of media messaging. We are also grateful to our Coding Supervisors Saul Ferholt-Kahn and Helen Xie, and the numerous student research assistants who facilitate additional content analysis of television and digital advertising.
Periodic releases of data will be posted on the project’s website and dispersed via LinkedIn, Bluesky @wesmediaproject.bsky.social and Twitter @wesmediaproject. To be added to our email update list, click here.
For more information contact: media@wesleyan.edu.
About Wesleyan University
Wesleyan University, in Middletown, Conn., is known for the excellence of its academic and co-curricular programs. With more than 2,900 undergraduates and 200 graduate students, Wesleyan is dedicated to providing a liberal arts education characterized by boldness, rigor and practical idealism. For more, visit www.wesleyan.edu.
About the John S. and James L. Knight Foundation
We are social investors who support democracy by funding free expression and journalism, arts and culture in community, research in areas of media and democracy, and in the success of American cities and towns where the Knight brothers once had newspapers. Learn more at kf.org and follow @knightfdn on social media.