
GOP Candidates More Negative than Democrats
![]()
(MIDDLETOWN, CT) October 4, 2018 – A new analysis from the Wesleyan Media Project (WMP) shows that half of the ads airing in the past month in U.S. Senate races were pure negative ads—their focus was attacking an opponent (Table 1). Only 30 percent were positive ads that focused solely on the favored candidate. The remaining 20 percent were contrast ads, which mention both the favored candidate and the opponent. Tone is determined based on whether the favored or targeted candidate in a race is featured in the ad (excluding the “paid for by” disclaimer). An ad that touts a candidate’s opposition to President Donald Trump, but does not mention the candidate’s opponent, would still be classified as a positive ad.
![]()
“As Election Day approaches, attack messages become common, and 2018 is no exception to that rule,” said Travis Ridout, co-director of the Wesleyan Media Project. “In Senate races, in particular, every other ad that voters have seen since Labor Day was an attack on an opposing candidate. Attack ads are often reviled by voters, but research suggests that they nonetheless tend to focus on policies and can help better inform voters about the issue priorities of candidates.”
![]()
Ads aired in races for governor were slightly less negative than the ads aired in races for the U.S. Senate, with 43 percent of gubernatorial ads falling into the negative category and 35 percent falling into the positive category. Ads in House races were the least likely to contain attacks—41 percent fell into the negative category, with 41 percent coded as positive.
![]()
Table 1: Tone of Advertising by Race Type (Sept. 4-Oct. 1)
| Negative | Contrast | Positive | Total | |
|---|---|---|---|---|
| Governor | 87,169 | 42,993 | 71,412 | 201,574 |
| 43.2% | 21.3% | 35.4% | 100% | |
| U.S. House | 93,809 | 41,574 | 94,569 | 229,952 |
| 40.8% | 18.1% | 41.1% | 100% | |
| U.S. Senate | 108,162 | 44,367 | 63,990 | 216,519 |
| 50.0% | 20.5% | 29.6% | 100% | |
| TOTAL | 648,045 | |||
| Numbers include ads aired on broadcast television between September 4 and October 1, 2018. CITE SOURCE OF DATA AS: Kantar Media/CMAG with analysis by the Wesleyan Media Project. |
||||
Ads aired in U.S. Senate races in September were also more negative than ads aired in Senate races in 2010, 2014, and 2016 as Table 2 shows. While 50 percent of ads this year were negative, roughly 49 percent were in 2014 and 2016, and 44.2 percent were in 2010. The percentage of negative ads in Senate races this year is slightly less negative, though, than the percentage of negative ads in Senate races in 2012—when the same set of states was holding races. In 2012, 51.4 percent of Senate ads were negative.
Negativity in House races, by contrast, is down from the elections of 2010, 2012, and 2014. It has moved back upward in comparison to 2016, though.
Despite these modest changes from election to election, there is also a fair amount of consistency. In eight of the ten electoral contexts noted in Table 2, negative ads were more common than positive or contrast ads. And positive ads pretty uniformly account for about 1 in every 5 ads in the elections in the table.
![]()
Table 2: Tone of Federal Advertising by Office and Year (Sept. 4-Oct. 1)
| Attack | Contrast | Positive | Airings | ||
|---|---|---|---|---|---|
| 2010 | US House | 44.5% | 24.1% | 31.4% | 137,016 |
| US Senate | 44.2% | 21.4% | 34.4% | 140,970 | |
| 2012 | US House | 46.3% | 20.7% | 33.0% | 133,305 |
| US Senate | 51.4% | 20.4% | 28.2% | 154,228 | |
| 2014 | US House | 43.4% | 21.6% | 35.0% | 109,699 |
| US Senate | 48.9% | 24.2% | 27.2% | 174,791 | |
| 2016 | US House | 35.0% | 21.5% | 43.5% | 101,330 |
| US Senate | 48.8% | 23.4% | 27.8% | 162,995 | |
| 2018 | US House | 40.8% | 18.1% | 41.1% | 229,952 |
| US Senate | 50.0% | 20.5% | 29.5% | 216,519 | |
| Numbers include ads aired on broadcast television between September 4 and October 1 in each year. CITE SOURCE OF DATA AS: Kantar Media/CMAG with analysis by the Wesleyan Media Project. |
|||||
Still, one important departure is an increase in the volume of ads aired this cycle. For example, in the month since Labor Day (through October 1), there have been nearly 230,000 ads aired in House races across the country. This is more than double the number aired during the comparable period in 2014. Figure 1 shows ad totals by media market in the two elections.
![]()
“2018 isn’t the most negative campaign we’ve seen in proportion of attack ads,” said Erika Franklin Fowler, co-director of the Wesleyan Media Project. “However, a comparable proportion of negativity can still feel more negative when there has been a large increase in the number of ads on air because citizens are more likely to see attack ads.”
![]()
![]()
Figure 1: House Ad Volume in 2014 and 2018
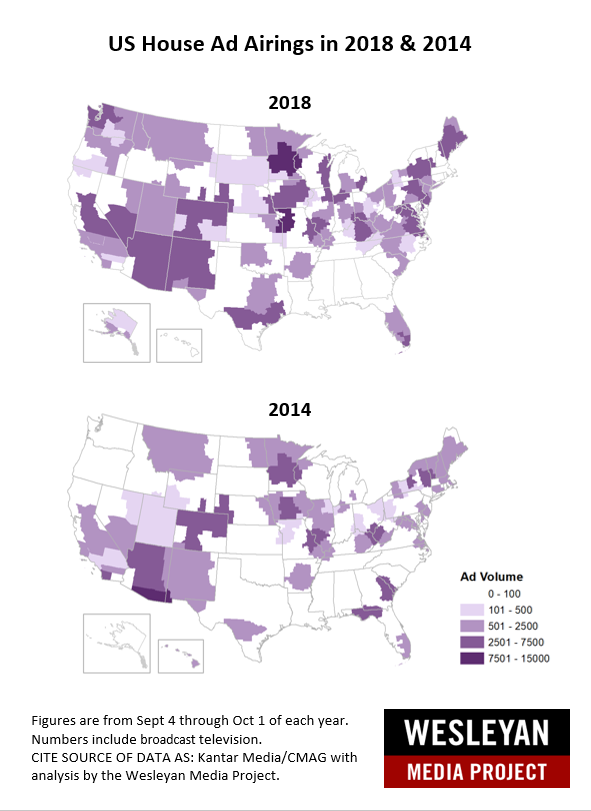
Table 3 displays the tone of gubernatorial advertising in 2018 compared to the prior two midterms. Although attack ads in 2018 are down slightly from 2014 as a percentage of all airings (43.2 percent compared to 44.8 percent in the prior midterm), they are also less likely to be positive (35.4 percent compared to 37 percent in 2014 and 40.8 percent in 2010). The volume of ads aired in gubernatorial races has been fairly stable across the past three cycles.
![]()
Table 3: Tone of Gubernatorial Advertising by Year (Sept. 4-Oct. 1)
| Cycle | Attack | Contrast | Positive | Airings |
|---|---|---|---|---|
| 2010 | 38.20% | 21.00% | 40.80% | 219,237 |
| 2014 | 44.80% | 18.20% | 37.00% | 193,331 |
| 2018 | 43.20% | 21.30% | 35.40% | 201,574 |
| Numbers include ads aired on broadcast television between September 4 and October 1 in each year. CITE SOURCE OF DATA AS: Kantar Media/CMAG with analysis by the Wesleyan Media Project. |
||||
Democratic Candidates More Positive than Republicans
Table 4 shows the percentage of total ads backing Democrats and backing Republicans in federal races (for 2018 and the two previous midterms) that were pure attack ads (including candidate, group, coordinated and party sponsored airings). Overall, Democrats have been much less negative in 2018 than Republicans. While 37 percent of ads supporting Democrats were negative during the September 4 to October 1 period, 59 percent of ads supporting Republicans were negative. That was not the case in 2014, however, when Democrats were far more negative than Republicans.
![]()
“One explanation for this may be the motivations of being the party likely to benefit from prevailing political winds,” said Michael Franz, co-director of the Wesleyan Media Project. “Democrats faced a tough political environment in 2014, and they may have decided that sharp attacks on Republicans were a means to stem the tide. In this cycle, the GOP faces the possibility of many lost seats in House races, making it important to point out the flaws of Democratic opponents.”
![]()
![]()
Table 4: Percent of Negative Ads by Party and Year in Federal Races (Sept. 4-Oct. 1)
| Cycle | Pro-Dem % | Pro-GOP % | Combined % | All Ad Airings |
|---|---|---|---|---|
| 2010 | 44.16% | 46.18% | 45.15% | 272,612 |
2014| 53.85% | 38.60% | 47.24% | 280,426 |
|
2018| 36.82% | 58.83% | 45.44% | 444,515 |
|
| Numbers include ads aired on broadcast television between September 4 and October 1 in each year. CITE SOURCE OF DATA AS: Kantar Media/CMAG with analysis by the Wesleyan Media Project. |
||||
If we focus just on candidate-sponsored ads in Table 5, the story is similar. Democratic candidates have not been very negative in their advertising, with 18 percent of their Senate ads and 14 percent of their House ads purely negative. Republican candidates have been significantly more negative, with 37 percent of their Senate ads and 34 percent of their House ads purely negative. That again contrasts with 2014 when Democrats were more negative than Republicans.
![]()
Table 5: Percent of Negative Candidate-sponsored Ads by Party and Year
| Dem Candidate % | GOP Candidate % |
||
|---|---|---|---|
| 2010 | US House | 37.4% | 26.96% |
| US Senate | 37.67% | 25.73% | |
| 2014 | US House | 22.64% | 15.72% |
| US Senate | 35.24% | 10.89% | |
| 2018 | US House | 14.14% | 33.7% |
| US Senate | 18.3% | 37.38% | |
| Numbers include ads aired on broadcast television between September 4 and October 1 in each year. CITE SOURCE OF DATA AS: Kantar Media/CMAG with analysis by the Wesleyan Media Project. |
|||
The party differences are less stark when it comes to group-sponsored ads in 2018 (Table 6). While pro-Democratic groups airing ads in the House have been less negative than pro-Republican groups (72 percent v. 92 percent), there are no real differences in levels of negativity between Democratic and Republican groups in the Senate races. This is not uncommon as outside groups tend to play the role of attack dog in campaigns.
![]()
Table 6: Percent of Negative Group-sponsored Ads by Party and Year
| Pro-Dem Group % | Pro-GOP Group % |
||
|---|---|---|---|
| 2010 | US House | 100% | 90.0% |
| US Senate | 97.4% | 95.4% | |
| 2014 | US House | 92.0% | 28.5% |
| US Senate | 93.3% | 64.0% | |
| 2018 | US House | 71.9% | 92.4% |
| US Senate | 91.4% | 92.0% | |
| Numbers include ads aired on broadcast television between September 4 and October 1 in each year. CITE SOURCE OF DATA AS: Kantar Media/CMAG with analysis by the Wesleyan Media Project. |
|||
Ohio, Nevada, Montana Most Negative Senate Races
Table 7 shows the tone of advertising in each U.S. Senate race in which ads have aired in the past month (whether from candidates, parties or groups), sorted by the percentage of ads falling in the pure negative category. Blank entries indicate that no ads supporting a party’s candidate aired. The most negative race is in Ohio, where 68.2 percent of ads attacked a candidate (in this case, all of those ads supported Democratic Senator Sherrod Brown.) Nevada had the second most negative race in the September 4 to October 1 period, with almost 64 percent of ads purely negative. Just under 55 percent of ads supporting Democrat Jacky Rosen were negative compared to 79 percent of ads supporting Republican Senator Dean Heller. What’s more, less than 3 percent of the ads supporting Rosen were positive, and less than 8 percent of those supporting Heller were purely positive.
Senate races in Montana, North Dakota and Indiana were all more than 60 percent negative.
![]()
Table 7: Tone of Senate Races Overall and by Party (Percent)
| % Neg Overall | Pro-Dem % Neg | Pro- Dem % Contrast | Pro-Dem % Pos | Pro-GOP % Neg | Pro- GOP % Contrast | Pro-GOP % Pos | Total Ad Airings |
|
|---|---|---|---|---|---|---|---|---|
| OH | 68.2 | 68.2 | 0.0 | 31.8 | 4,284 | |||
| NV | 63.9 | 54.4 | 43.0 | 2.7 | 79.0 | 13.6 | 7.4 | 13,167 |
| MT | 63.7 | 73.9 | 8.0 | 18.1 | 47.5 | 46.0 | 6.5 | 19,223 |
| ND | 63.1 | 62.2 | 19.0 | 18.8 | 64.4 | 24.3 | 11.3 | 9,826 |
| IN | 61.3 | 66.5 | 9.4 | 24.1 | 56.1 | 12.5 | 31.5 | 22,091 |
| TN | 58.0 | 44.3 | 15.9 | 39.8 | 81.3 | 7.8 | 10.9 | 21,184 |
| MO | 54.4 | 45.1 | 25.5 | 29.4 | 68.3 | 11.5 | 20.1 | 18,875 |
| FL | 52.5 | 52.4 | 0.0 | 47.6 | 52.5 | 31.4 | 16.1 | 27,798 |
| WI | 50.7 | 62.0 | 10.5 | 27.5 | 30.8 | 18.4 | 50.9 | 8,565 |
| AZ | 50.1 | 34.6 | 31.6 | 33.8 | 78.2 | 21.8 | 0.0 | 17,276 |
| NJ | 48.6 | 71.2 | 28.8 | 0.0 | 48.0 | 15.0 | 37.0 | 4,186 |
| PA | 44.5 | 47.9 | 0.0 | 52.1 | 36.9 | 0.0 | 63.1 | 3,402 |
| WV | 42.3 | 36.5 | 42.9 | 20.5 | 49.3 | 36.3 | 14.4 | 13,829 |
| TX | 37.4 | 0.0 | 0.0 | 100.0 | 78.2 | 21.8 | 0.0 | 13,559 |
| RI | 18.1 | 0.0 | 0.0 | 100.0 | 46.2 | 53.8 | 0.0 | 1,195 |
| VA | 0.0 | 0.0 | 54.2 | 45.8 | 5,741 | |||
| MN | 0.0 | 0.0 | 0.0 | 100.0 | 0.0 | 64.9 | 35.1 | 3,489 |
| MI | 0.0 | 0.0 | 0.0 | 100.0 | 2,559 | |||
| NE | 0.0 | 0.0 | 100.0 | 0.0 | 0.0 | 0.0 | 100.0 | 2,118 |
| NM | 0.0 | 0.0 | 0.0 | 100.0 | 1,300 | |||
| MS | 0.0 | 0.0 | 50.4 | 49.6 | 885 | |||
| CT | 0.0 | 0.0 | 0.0 | 100.0 | 823 | |||
| MD | 0.0 | 660 | ||||||
| WA | 0.0 | 0.0 | 0.0 | 100.0 | 411 | |||
| Numbers include ads aired on broadcast television between September 4 and October 1, 2018. Blanks indicate no airings from that party. CITE SOURCE OF DATA AS: Kantar Media/CMAG with analysis by the Wesleyan Media Project. |
||||||||
Table 8 shows negativity in House races during the September 4 to October 1 period. Those races in which fewer than 200 ads aired were eliminated from the table. The most negative race was in Ohio’s 1st congressional district, followed by Colorado’s 6th and New York’s 22nd.
![]()
Table 8: Tone of House Races Overall and by Party (Percent)
| Race | Total % Neg | Pro-Dem % Neg | Pro- Dem % Contrast | Pro-Dem % Pos | Pro-GOP % Neg | Pro- GOP % Contrast | Pro-GOP % Pos | Total Ad Airings |
|---|---|---|---|---|---|---|---|---|
| OH-01 | 71.2 | 61.4 | 28.6 | 10.0 | 81.7 | 13.6 | 4.7 | 4,302 |
| CO-06 | 69.8 | 72.3 | 14.9 | 12.8 | 63.3 | 24.9 | 11.9 | 5,760 |
| NY-22 | 68.7 | 66.9 | 2.7 | 30.3 | 71.1 | 4.9 | 24.0 | 11,676 |
| NC-02 | 67.4 | 100.0 | 0.0 | 0.0 | 48.2 | 49.8 | 2.0 | 389 |
| CA-25 | 67.3 | 71.0 | 0.0 | 29.0 | 0.0 | 0.0 | 100.0 | 1,013 |
| MN-03 | 66.6 | 27.8 | 50.5 | 21.7 | 100.0 | 0.0 | 0.0 | 5,719 |
| WA-05 | 65.7 | 36.6 | 63.4 | 0.0 | 100.0 | 0.0 | 0.0 | 2,575 |
| MN-01 | 65.5 | 0.0 | 83.4 | 16.6 | 100.0 | 0.0 | 0.0 | 2,388 |
| TX-23 | 64.9 | 65.8 | 24.4 | 9.8 | 64.0 | 27.0 | 9.0 | 3,455 |
| IL-06 | 61.6 | 54.0 | 12.4 | 33.6 | 100.0 | 0.0 | 0.0 | 1,976 |
| PA-08 | 60.3 | 38.6 | 61.4 | 0.0 | 73.3 | 0.0 | 26.7 | 2,930 |
| FL-16 | 59.7 | 82.4 | 17.6 | 0.0 | 34.1 | 57.6 | 8.3 | 1,464 |
| NY-24 | 59.3 | 51.5 | 27.6 | 20.9 | 69.9 | 0.0 | 30.1 | 2,553 |
| WA-3 | 59.1 | 41.5 | 0.0 | 58.5 | 100.0 | 0.0 | 0.0 | 1,442 |
| NV-04 | 59.0 | 63.3 | 0.0 | 36.7 | 53.9 | 0.0 | 46.1 | 1,905 |
| CA-10 | 58.6 | 41.9 | 25.8 | 32.3 | 79.8 | 20.2 | 0.0 | 4,560 |
| ME-02 | 54.9 | 30.5 | 39.4 | 30.1 | 77.7 | 0.0 | 22.3 | 8,987 |
| KS-03 | 54.6 | 41.1 | 14.3 | 44.6 | 69.3 | 23.3 | 7.3 | 4,284 |
| VA-10 | 54.0 | 47.3 | 4.6 | 48.1 | 65.9 | 34.1 | 0.0 | 3,165 |
| FL-26 | 54.0 | 47.7 | 0.0 | 52.3 | 64.4 | 0.0 | 35.6 | 3,479 |
| KS-02 | 52.1 | 24.6 | 75.4 | 0.0 | 100.0 | 0.0 | 0.0 | 5,615 |
| TX-07 | 51.9 | 45.1 | 20.6 | 34.4 | 62.2 | 0.0 | 37.8 | 3,699 |
| AZ-01 | 51.4 | 51.4 | 6.4 | 42.2 | 1,788 | |||
| WA-08 | 51.3 | 42.8 | 0.0 | 57.2 | 64.4 | 0.0 | 35.6 | 4,555 |
| VA-02 | 51.2 | 56.2 | 0.0 | 43.8 | 41.9 | 32.1 | 26.0 | 5,549 |
| NY-19 | 51.0 | 40.7 | 37.2 | 22.0 | 67.1 | 0.0 | 32.9 | 5,706 |
| CA-22 | 50.6 | 58.5 | 39.0 | 2.5 | 36.3 | 0.0 | 63.7 | 2,782 |
| VA-07 | 50.6 | 31.6 | 18.6 | 49.8 | 89.3 | 0.0 | 10.7 | 3,314 |
| IA-03 | 50.4 | 39.3 | 13.5 | 47.2 | 67.1 | 27.9 | 5.0 | 4,458 |
| IL-12 | 50.0 | 46.0 | 21.1 | 32.9 | 58.8 | 0.0 | 41.2 | 3,358 |
| NM-02 | 47.3 | 40.5 | 4.7 | 54.8 | 72.0 | 7.0 | 21.0 | 5,325 |
| AZ-02 | 43.3 | 46.2 | 0.0 | 53.8 | 39.6 | 47.6 | 12.8 | 3,712 |
| IA-01 | 43.1 | 40.0 | 22.8 | 37.2 | 51.1 | 0.0 | 48.9 | 3,759 |
| TX-32 | 42.7 | 0.0 | 0.0 | 100.0 | 87.9 | 0.0 | 12.1 | 613 |
| NJ-03 | 42.5 | 16.7 | 50.5 | 32.8 | 93.6 | 0.0 | 6.4 | 2,684 |
| NV-03 | 42.4 | 41.3 | 0.0 | 58.7 | 44.4 | 0.0 | 55.6 | 2,443 |
| KY-06 | 41.1 | 10.1 | 54.2 | 35.7 | 68.5 | 0.0 | 31.5 | 6,829 |
| NE-02 | 41.0 | 43.8 | 0.0 | 56.3 | 39.6 | 0.0 | 60.4 | 2,145 |
| PA-01 | 39.9 | 17.6 | 56.8 | 25.6 | 83.4 | 8.2 | 8.3 | 2,793 |
| MT-01 | 39.7 | 54.4 | 8.4 | 37.1 | 22.0 | 44.6 | 33.4 | 7,333 |
| WI-01 | 37.4 | 18.5 | 29.4 | 52.1 | 100.0 | 0.0 | 0.0 | 2,061 |
| MI-06 | 36.6 | 82.1 | 17.9 | 0.0 | 9.9 | 0.0 | 90.1 | 1,946 |
| MN-02 | 36.3 | 24.4 | 20.7 | 54.9 | 53.4 | 14.1 | 32.5 | 2,520 |
| PA-17 | 36.0 | 0.0 | 0.0 | 100.0 | 70.6 | 0.0 | 29.4 | 1,143 |
| CA-16 | 34.6 | 50.7 | 49.3 | 0.0 | 0.0 | 0.0 | 100.0 | 871 |
| MI-08 | 33.7 | 23.7 | 34.4 | 41.8 | 64.0 | 0.0 | 36.0 | 4,534 |
| FL-06 | 32.0 | 32.0 | 0.0 | 68.0 | 1,102 | |||
| MN-08 | 31.2 | 24.6 | 44.4 | 30.9 | 39.4 | 30.6 | 30.0 | 3,943 |
| NJ-11 | 30.9 | 30.9 | 0.0 | 69.1 | 404 | |||
| IN-02 | 29.7 | 12.1 | 64.0 | 23.9 | 48.9 | 0.0 | 51.1 | 2,077 |
| UT-04 | 28.1 | 0.0 | 31.0 | 69.0 | 79.0 | 0.0 | 21.0 | 2,339 |
| MI-11 | 26.6 | 27.5 | 0.0 | 72.5 | 0.0 | 0.0 | 100.0 | 974 |
| AR-02 | 26.0 | 0.0 | 0.0 | 100.0 | 70.7 | 0.0 | 29.3 | 1,534 |
| CA-45 | 23.0 | 26.2 | 0.0 | 73.8 | 0.0 | 0.0 | 100.0 | 686 |
| IN-09 | 20.6 | 0.0 | 71.9 | 28.1 | 100.0 | 0.0 | 0.0 | 1,509 |
| PA-16 | 17.6 | 0.0 | 10.7 | 89.3 | 43.1 | 44.4 | 12.5 | 2,377 |
| IL-13 | 16.6 | 16.5 | 39.6 | 43.8 | 16.9 | 0.0 | 83.1 | 2,327 |
| PA-11 | 16.5 | 0.0 | 0.0 | 100.0 | 16.6 | 0.0 | 83.4 | 520 |
| CA-49 | 12.3 | 0.0 | 0.0 | 100.0 | 70.8 | 29.2 | 0.0 | 930 |
| CA-21 | 11.0 | 16.8 | 6.3 | 76.8 | 0.0 | 39.7 | 60.3 | 3,636 |
| NC-09 | 5.7 | 0.0 | 6.8 | 93.2 | 42.1 | 0.0 | 57.9 | 2,681 |
| FL-25 | 3.7 | 0.0 | 100.0 | 0.0 | 8.7 | 0.0 | 91.3 | 985 |
| FL-18 | 3.1 | 4.2 | 46.0 | 49.9 | 0.0 | 0.0 | 100.0 | 2,149 |
| WI-06 | 0.0 | 0.0 | 0.0 | 100.0 | 0.0 | 0.0 | 100.0 | 6,044 |
| TX-31 | 0.0 | 0.0 | 0.0 | 100.0 | 3,273 | |||
| NC-13 | 0.0 | 0.0 | 25.2 | 74.8 | 0.0 | 0.0 | 100.0 | 2,041 |
| WV-03 | 0.0 | 0.0 | 30.5 | 69.5 | 0.0 | 100.0 | 0.0 | 1,494 |
| AK-01 | 0.0 | 0.0 | 0.0 | 0.0 | 0.0 | 0.0 | 100.0 | 1,372 |
| PA-10 | 0.0 | 0.0 | 17.2 | 82.8 | 0.0 | 0.0 | 100.0 | 1,191 |
| VA-05 | 0.0 | 0.0 | 0.0 | 100.0 | 0.0 | 0.0 | 100.0 | 1,101 |
| TX-21 | 0.0 | 0.0 | 0.0 | 100.0 | 1,043 | |||
| CA-24 | 0.0 | 0.0 | 58.6 | 41.4 | 0.0 | 0.0 | 100.0 | 1,020 |
| OH-14 | 0.0 | 0.0 | 50.3 | 49.7 | 972 | |||
| SC-01 | 0.0 | 0.0 | 0.0 | 100.0 | 0.0 | 0.0 | 100.0 | 920 |
| OH-10 | 0.0 | 0.0 | 24.0 | 76.0 | 0.0 | 0.0 | 100.0 | 834 |
| NY-25 | 0.0 | 0.0 | 0.0 | 100.0 | 0.0 | 0.0 | 100.0 | 834 |
| NH-01 | 0.0 | 0.0 | 0.0 | 100.0 | 0.0 | 91.9 | 8.1 | 808 |
| CA-50 | 0.0 | 0.0 | 100.0 | 0.0 | 706 | |||
| ND-01 | 0.0 | 0.0 | 25.4 | 74.6 | 0.0 | 0.0 | 100.0 | 690 |
| OH-07 | 0.0 | 0.0 | 36.6 | 63.4 | 686 | |||
| AZ-09 | 0.0 | 0.0 | 0.0 | 100.0 | 0.0 | 100.0 | 0.0 | 640 |
| IL-14 | 0.0 | 0.0 | 0.0 | 100.0 | 618 | |||
| WI-08 | 0.0 | 0.0 | 0.0 | 100.0 | 542 | |||
| OK-05 | 0.0 | 0.0 | 0.0 | 100.0 | 0.0 | 0.0 | 100.0 | 538 |
| VA-09 | 0.0 | 0.0 | 0.0 | 100.0 | 524 | |||
| IA-02 | 0.0 | 0.0 | 0.0 | 100.0 | 435 | |||
| CA-04 | 0.0 | 0.0 | 0.0 | 100.0 | 434 | |||
| SD-01 | 0.0 | 0.0 | 0.0 | 100.0 | 0.0 | 0.0 | 100.0 | 429 |
| MI-07 | 0.0 | 0.0 | 0.0 | 100.0 | 0.0 | 0.0 | 100.0 | 376 |
| NC-05 | 0.0 | 0.0 | 0.0 | 100.0 | 357 | |||
| NY-21 | 0.0 | 0.0 | 100.0 | 0.0 | 339 | |||
| OH-12 | 0.0 | 0.0 | 100.0 | 0.0 | 0.0 | 0.0 | 0.0 | 336 |
| MI-02 | 0.0 | 0.0 | 100.0 | 0.0 | 0.0 | 0.0 | 100.0 | 334 |
| CO-03 | 0.0 | 0.0 | 100.0 | 0.0 | 317 | |||
| CA-48 | 0.0 | 0.0 | 20.3 | 79.7 | 286 | |||
| NH-02 | 0.0 | 0.0 | 0.0 | 100.0 | 0.0 | 0.0 | 100.0 | 279 |
| FL-07 | 0.0 | 0.0 | 0.0 | 100.0 | 0.0 | 100.0 | 0.0 | 273 |
| MO-02 | 0.0 | 0.0 | 100.0 | 0.0 | 0.0 | 0.0 | 100.0 | 267 |
| TN-02 | 0.0 | 0.0 | 0.0 | 100.0 | 257 | |||
| Numbers include ads aired on broadcast television between September 4 and October 1, 2018. Blanks indicate no airings from that party. CITE SOURCE OF DATA AS: Kantar Media/CMAG with analysis by the Wesleyan Media Project. |
||||||||
Table 9 shows the same information for races for governor, with races in which fewer than 1000 ads aired eliminated from the table. The race for governor of Illinois is a particularly negative one. Overall, 71.1 percent of ads aired in the post-Labor Day period were negative. Among ads supporting the Democrat, J.B. Pritzker, 53.6 percent were negative, while 94 percent of ads supporting Republican Bruce Rauner were negative. Georgia and Minnesota also saw a particularly negative race.
![]()
Table 9: Tone of Governor Races Overall and by Party (Percent)
| % Neg Overall | Pro-Dem % Neg | Pro-Dem % Contrast | Pro-Dem % Pos | Pro-GOP % Neg | Pro-GOP % Contrast | Pro-GOP % Pos | Total Ad Airings |
|
|---|---|---|---|---|---|---|---|---|
| IL | 71.1 | 53.6 | 21.7 | 24.7 | 94.0 | 0.0 | 6.0 | 23,729 |
| GA | 68.5 | 82.6 | 3.7 | 13.6 | 50.9 | 0.0 | 49.1 | 12,987 |
| MN | 61.2 | 69.6 | 0.0 | 30.4 | 39.0 | 61.0 | 0.0 | 1,977 |
| RI | 57.4 | 67.7 | 19.2 | 13.1 | 32.9 | 38.7 | 28.4 | 2,851 |
| WI | 55.9 | 54.0 | 26.3 | 19.7 | 56.7 | 32.0 | 11.3 | 15,877 |
| IA | 53.6 | 14.9 | 64.9 | 20.2 | 97.8 | 2.2 | 0.0 | 9,629 |
| NM | 50.5 | 52.4 | 16.1 | 31.5 | 46.6 | 14.8 | 38.6 | 3,655 |
| AZ | 47.4 | 0.0 | 0.0 | 100.0 | 48.0 | 50.8 | 1.2 | 7,724 |
| MI | 46.7 | 34.3 | 40.1 | 25.6 | 58.7 | 0.0 | 41.3 | 13,711 |
| CO | 46.6 | 33.3 | 31.6 | 35.1 | 78.1 | 21.9 | 0.0 | 7,709 |
| OH | 45.3 | 51.4 | 36.8 | 11.8 | 40.3 | 54.1 | 5.6 | 16,630 |
| OR | 43.5 | 64.1 | 17.8 | 18.2 | 15.7 | 75.1 | 9.3 | 11,355 |
| CT | 43.2 | 36.1 | 36.7 | 27.3 | 51.3 | 48.7 | 0.0 | 4,809 |
| NV | 39.5 | 49.5 | 21.3 | 29.2 | 26.5 | 31.5 | 41.9 | 6,633 |
| PA | 37.0 | 41.9 | 0.0 | 58.1 | 0.9 | 97.0 | 2.1 | 5,833 |
| OK | 30.0 | 18.9 | 32.5 | 48.6 | 79.2 | 0.0 | 20.8 | 1,458 |
| ME | 29.2 | 49.4 | 0.0 | 50.6 | 26.8 | 0.0 | 73.2 | 7,074 |
| FL | 24.6 | 29.6 | 0.0 | 70.4 | 22.1 | 0.0 | 77.9 | 15,624 |
| NY | 20.4 | 20.4 | 8.5 | 71.1 | 5,237 | |||
| KS | 15.9 | 0.0 | 100.0 | 0.0 | 42.0 | 0.0 | 58.0 | 2,604 |
| MD | 10.5 | 38.1 | 0.0 | 61.9 | 0.0 | 0.0 | 100.0 | 1,593 |
| SD | 9.1 | 0.0 | 0.0 | 100.0 | 26.7 | 0.0 | 73.3 | 2,197 |
| TN | 6.2 | 9.3 | 48.0 | 42.7 | 0.0 | 0.0 | 100.0 | 7,335 |
| TX | 0.0 | 0.0 | 0.0 | 100.0 | 3,662 | |||
| MA | 0.0 | 0.0 | 0.0 | 100.0 | 0.0 | 8.5 | 91.5 | 3,010 |
| CA | 0.0 | 0.0 | 0.0 | 100.0 | 2,279 | |||
| NE | 0.0 | 0.0 | 0.0 | 100.0 | 1,481 | |||
| AL | 0.0 | 0.0 | 0.0 | 100.0 | 1,035 | |||
| Numbers include ads aired on broadcast television between September 4 and October 1, 2018. Blanks indicate no airings from that party. CITE SOURCE OF DATA AS: Kantar Media/CMAG with analysis by the Wesleyan Media Project. |
||||||||
Dems, GOP Mention Trump in their Attack Ads
Table 10 shows the distribution of mentions of President Donald Trump across pro-Democratic and pro-Republican ads and by the tone of those ads. Just under 10 percent (9.5 percent) of ad airings featured a reference to Trump. Trump appears in 8.3 percent of pro-Democratic airings and 11.6 percent of Republican airings. But situations in which pro-Democratic and pro-Republican ads speak of Trump are dramatically different.
On the Democratic side, almost all mentions of Trump are negative, and many of them appear in the context of attacks on opposing candidates. That is, ads favoring Democrats are most likely to mention Trump when attacking Republican opponents. As reported before, Democratic ads in red states do occasionally feature Trump in a positive or mixed light to highlight when they might stand with him or describe the circumstances under which they would support or oppose his policies.
On the Republican side, almost all mentions of Trump are positive, but those positive mentions of Trump are most likely to appear in ads that are attacking Democrats. Indeed, fully one in four pro-Republican ads that attack a Democrat contains a positive mention of Trump. These ads are most often attacking Democrats for not embracing the president or the president’s policies, often calling out their opposition to the border wall or voting against tax cuts, for example.
![]()
Table 10: Mentions of Trump by Party and Ad Tone in Federal Races
| Trump Mentions % | Pro-Trump % | Anti-Trump % | Mixed % | Ad Airings |
||
|---|---|---|---|---|---|---|
| All Airings | 9.5% | 4.8% | 4.3% | 0.5% | 444,515 | |
| Pro-Dem | 8.3% | 0.7% | 6.9% | 0.8% | 270,477 | |
| Attack | 0% | 11.3% | 0% | 99,578 | ||
| Contrast | 0% | 3.4% | 0% | 55,553 | ||
| Positive | 0.7% | 4.7% | 1.8% | 115,346 | ||
| Pro-GOP | 11.6% | 11.2% | 0.2% | 0.1% | 174,038 | |
| Attack | 25% | 0% | 0.8% | 102,393 | ||
| Contrast | 8.6% | 0% | 0% | 30,104 | ||
| Positive | 7.8% | 1% | 0% | 41,541 | ||
| Numbers include ads aired on broadcast television between September 4 and October 1, 2018. Ads not favoring a Republican or Democrat are excluded. Entries are the percent of ads in that row. CITE SOURCE OF DATA AS: Kantar Media/CMAG with analysis by the Wesleyan Media Project. |
||||||
About This Report
Data reported here from Kantar Media/CMAG do not cover local cable buys, only broadcast television, national network and national cable buys.
The Wesleyan Media Project (WMP) provides real-time tracking and analysis of political advertising in an effort to increase transparency in elections. Housed in Wesleyan’s Quantitative Analysis Center – part of the Allbritton Center for the Study of Public Life – the Wesleyan Media Project is the successor to the Wisconsin Advertising Project, which disbanded in 2009. It is directed by Erika Franklin Fowler, associate professor of government at Wesleyan University, Michael M. Franz, professor of government at Bowdoin College and Travis N. Ridout, professor of political science at Washington State University. WMP staff include Laura Baum (Project Manager), Dolly Haddad (Project Coordinator) and Matthew Motta (Research Associate).
The Wesleyan Media Project is supported by Wesleyan University and the John S. and James L. Knight Foundation. Data are provided by Kantar Media/CMAG with analysis by the Wesleyan Media Project. WMP is partnering again this year with the Center for Responsive Politics, to provide added information on outside group disclosure.
Periodic releases of data will be posted on the project’s website and dispersed via Twitter @wesmediaproject. To be added to our email update list, click here.
For more information contact:
Lauren Rubenstein, lrubenstein@wesleyan.edu, (860) 685-3813
About Wesleyan University
Wesleyan University, in Middletown, Conn., is known for the excellence of its academic and co-curricular programs. With more than 2,900 undergraduates and 200 graduate students, Wesleyan is dedicated to providing a liberal arts education characterized by boldness, rigor and practical idealism. For more, visit wesleyan.edu.
About the John S. and James L. Knight Foundation
Knight Foundation is a national foundation with strong local roots. We invest in journalism, in the arts, and in the success of cities where brothers John S. and James L. Knight once published newspapers. Our goal is to foster informed and engaged communities, which we believe are essential for a healthy democracy.


