Photo Gage Skidmore/Flickr
Over 2.2 Million Ads Aired This Cycle;
Post-Labor Day Period Slightly Less Negative than 2014
![]()
![]()
(MIDDLETOWN, CT) September 20, 2018 – In the two weeks following Labor Day – traditionally the start of the general election campaign – the volume of television advertising in 2018 was well above the volume in 2014, especially in federal races, as detailed by a new report released by the Wesleyan Media Project. Nearly 280,000 broadcast television ads aired in federal and gubernatorial races in the two weeks post-Labor Day (9/4-9/17) in 2018, an increase of 33 percent over the same dates in 2014 (Table 1). This increase is primarily driven by large increases in television advertising volume in federal races, which is up by 55 percent over the 2014 midterm election.
“Part of the reason for the increased volume this year may be that the cost of broadcast TV advertising is down,” said Erika Franklin Fowler, co-director of the Wesleyan Media Project. “Dollars spent on TV stretch further this year, and the consequence is that Americans are seeing many more ads than in 2014 at this same point.”
![]()
The increase in outside group activity is especially notable. Groups are not only airing more advertising in federal races this cycle (47,453 in the last two weeks in advertising for U.S. House and U.S. Senate races compared to 25,596 for the same dates in 2014, an increase of 85 percent), but outside group advertising also comprises a large share of the advertising on air during 2018 than it did in the last cycle. This is especially true in U.S. House races where the share of outside group advertising nearly doubled from 9.0 percent in 2014 to 17.5 percent this cycle. U.S. Senate races have also seen an increase in the share of outside group advertising from just over a quarter of all advertising (27.9 percent) in 2014 to nearly a third (32.1 percent) during the two weeks after Labor Day in 2018.
![]()
Table 1: Count and Cost of Advertising by Sponsor Type Since Labor Day (2014 and 2018)
| 2018 | Candidate Ads | Coord. Ads | Group Ads | Party Ads | TOTAL ADS | % Change | |
|---|---|---|---|---|---|---|---|
| House | Airings | 59,310 | 2,972 | 15,535 | 10,942 | 88,759 | 104% |
| Est. Cost (in Ms) | 20.0 | 1.1 | 5.3 | 4.8 | 31.2 | 78% | |
| Senate | Airings | 58,980 | 2,645 | 31,918 | 5,884 | 99,427 | 28% |
| Est. Cost (in Ms) | 21.6 | 0.9 | 10.0 | 1.5 | 34.0 | -22% | |
| Governor | Airings | 60,296 | 8,852 | 16,533 | 6,031 | 91,712 | 4% |
| Est. Cost (in Ms) | 22.4 | 5.5 | 7.0 | 2.9 | 37.9 | -46% | |
| Total airings | 178,586 | 14,469 | 63,986 | 22,857 | 279,898 | 33% | |
| 2014 | Candidate Ads | Coord. Ads | Group Ads | Party Ads | TOTAL ADS | ||
| House | Airings | 26,881 | 809 | 3,902 | 11,936 | 43,528 | |
| Est. Cost (in Ms) | 10.3 | 0.2 | 2.0 | 4.9 | 17.5 | ||
| Senate | Airings | 37,379 | 7,563 | 21,694 | 11,167 | 77,803 | |
| Est. Cost (in Ms) | 18.7 | 5.0 | 13.1 | 6.6 | 43.5 | ||
| Governor | Airings | 49,640 | 0 | 18,831 | 19,981 | 88,452 | |
| Est. Cost (in Ms) | 39.8 | 0 | 16.2 | 14.4 | 70.5 | ||
| Total airings | 113,900 | 8,372 | 44,427 | 43,084 | 209,783 | ||
| Figures are from September 4 through September 17 for each year. Numbers include broadcast television. Cost totals may be off slightly due to rounding. May include a small number of primary ads. CITE SOURCE OF DATA AS: Kantar Media/CMAG with analysis by the Wesleyan Media Project. |
|||||||
Table 2 takes a wider view and looks at advertising totals for Democrats and Republicans in the full cycle, through September 17. These figures include ads aired in both general election and primary contests. In the full cycle, over 2.2 million spots have aired in congressional and gubernatorial races, totaling nearly $1 billion. This is a 70 percent increase over airings through September 17 in the 2014 midterms. This continues the trend noted in earlier releases that advertising in 2018 has far out-paced the 2014 midterms, showing no signs of slowing down in light of expanded use of digital media by campaigns. Across all of these races, pro-Democratic sponsors have aired over 1.1 million spots, which is 50.6 percent of the ads aired between the two parties.
Republicans have slightly edged out Democrats in gubernatorial races (about 557,000 ad airings to Democrats’ 520,000 airings), but Democrats have aired more spots than Republicans in House races.
![]()
“There is a lot of variation race to race in terms of which party has the advantage,” said Michael Franz, co-director of the Wesleyan Media Project. “Sometimes Democrats air more ads than Republicans, and vice versa. But it is striking that across all of the races for Congress and governor this cycle, the ad totals are essentially even between the two parties.”
![]()
![]()
Table 2: Advertising Totals, Cycle to Date in 2018
| GOVERNOR | Dem Airings | Dem Cost (in Ms) | Rep Airings | Rep Cost (in Ms) |
| Candidate | 434,996 | 212.8 | 434,964 | 150.1 |
| Cand/party coordinated | 5,359 | 4.3 | 8,504 | 3.5 |
| Group | 77,018 | 61.5 | 94,558 | 58.6 |
| Party | 2,941 | 2.1 | 19,554 | 11.7 |
| Total | 520,314 | 280.7 | 557,580 | 224.0 |
| US HOUSE | Dem Airings | Dem Cost (in Ms) | Rep Airings | Rep Cost (in Ms) |
| Candidate | 216,076 | 77.6 | 124,988 | 38.4 |
| Cand/party coordinated | 5,646 | 1.8 | 4,088 | 1.9 |
| Group | 51,892 | 22.0 | 71,815 | 33.7 |
| Party | 15,969 | 8.4 | 14,338 | 9.4 |
| Total | 289,583 | 109.8 | 215,229 | 8.4 |
| US SENATE | Dem Airings | Dem Cost (in Ms) | Rep Airings | Rep Cost (in Ms) |
| Candidate | 193,916 | 61.3 | 176,895 | 63.8 |
| Cand/party coordinated | 1,796 | 1.0 | 6,614 | 2.1 |
| Group | 131,404 | 58.5 | 135,693 | 66.9 |
| Party | 2,452 | 0.5 | 18,671 | 8.1 |
| Total | 329,568 | 121.3 | 337,873 | 141.0 |
| GRAND TOTAL | 1,139,465 | 511.8 | 1,110,682 | 448.3 |
| Figures are from January 1, 2017 through September 17, 2018. Numbers include broadcast television. Cost totals may be off slightly due to rounding. May include a small number of primary ads. CITE SOURCE OF DATA AS: Kantar Media/CMAG with analysis by the Wesleyan Media Project. |
||||
|---|---|---|---|---|
Top Senate Races: Nelson Taking a Beating in FL; Dems Hold Ad Advantages in Most Other Contests
The Senate race in Florida has seen the most ads of any Senate race during the two weeks following Labor Day, with pro-Republican airings for Rick Scott crushing pro-Democratic airings for Bill Nelson more than 2 to 1. Pro-Scott airings totaled 9,518 while pro-Nelson airings totaled 4,242.
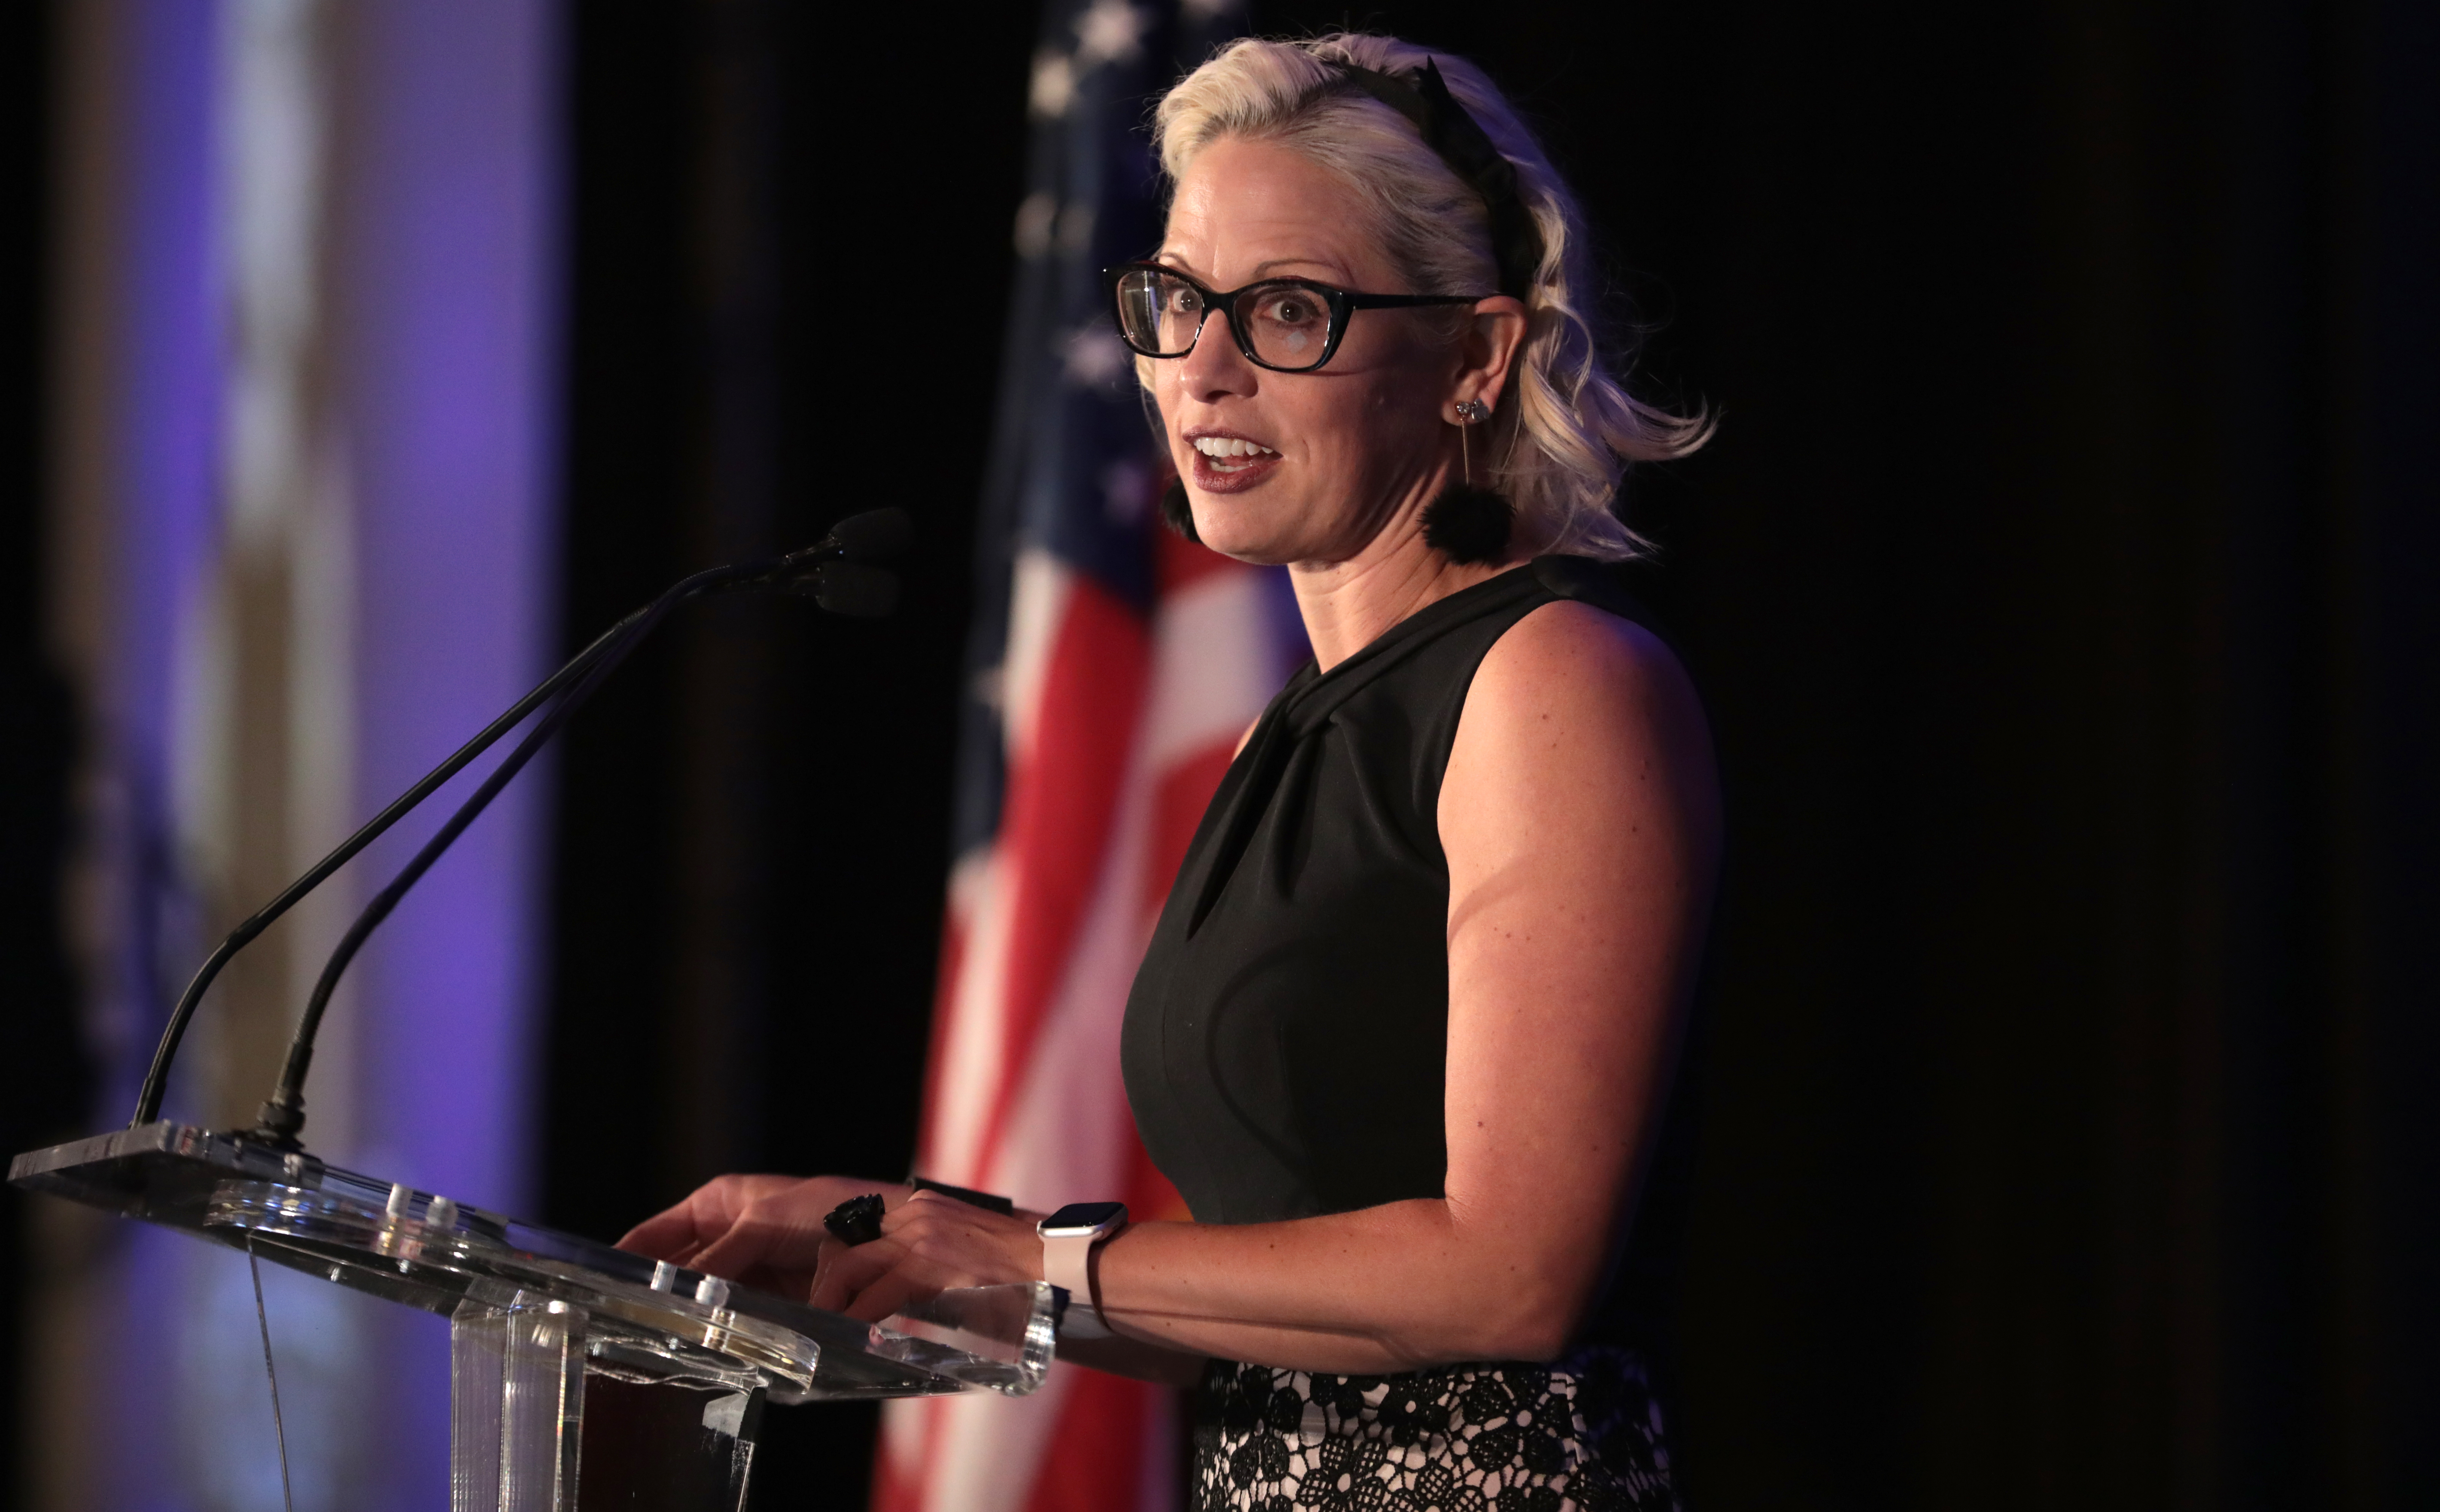
In most of the rest of the top Senate races – measured through advertising volume – Democrats held an ad advantage, including Phil Bredesen in Tennessee, Kyrsten Sinema in Arizona and Tammy Baldwin in Wisconsin. In fact, of the top 11 races in Table 3, Democrats aired more ads than Republicans in 9 of them.
Interest group involvement in Senate races is overwhelmingly skewed to the most competitive elections. Groups are essentially absent from races in the bottom half of the table, but they account for between 1 in 5 to 1 in every 2 ads in the most competitive races. More than half of the ads in Missouri are from outside groups, for example, and the same is true in in West Virginia. Over 1 in every 3 ads have been sponsored by outside groups in Indiana, Arizona, Nevada, and North Dakota.
![]()
“The Senate is certainly in play for Democrats, but it’s generally considered a longer shot than regaining control of the House,” said Travis Ridout, co-director of the Wesleyan Media Project. “Democrats know that they cannot afford to lose any competitive race where they are the incumbent. As such, groups have concentrated their efforts in the most critical states—the races that could really tip either way.”
![]()
![]()
Table 3: Volume and Cost of Ads in Senate Races
| State | Total Airings | Est. Cost (in Ms) | Pro-Dem Airings | Pro-GOP Airings | Dem % Group | GOP % Group | Dem Ad Adv |
|---|---|---|---|---|---|---|---|
| FL | 13,955 | 6.6 | 4,437 | 9,518 | 31.1% | 25.2% | -5,081 |
| TN | 10,489 | 3.0 | 6,601 | 3,888 | 48.5% | 47.8% | 2,713 |
| MO | 9,842 | 3.2 | 5,684 | 4,158 | 47.7% | 68.4% | 1,526 |
| IN | 8,782 | 2.6 | 5,239 | 3,543 | 32.0% | 45.5% | 1,696 |
| MT | 8,480 | 0.8 | 4,494 | 3,986 | 28.3% | 19.9% | 508 |
| AZ | 7,436 | 3.0 | 4,583 | 2,853 | 42.7% | 23.8% | 1,730 |
| WV | 6,832 | 1.1 | 3,588 | 3,244 | 47.5% | 61.7% | 344 |
| NV | 5,691 | 2.0 | 3,376 | 2,315 | 39.5% | 32.1% | 1,061 |
| TX | 5,520 | 2.7 | 2,715 | 2,805 | 0% | 40.7% | -90 |
| ND | 4,153 | 0.7 | 2,334 | 1,819 | 30.2% | 45.3% | 515 |
| WI | 3,976 | 1.5 | 2,832 | 1,144 | 15.8% | 53.7% | 1,688 |
| VA | 3,042 | 0.6 | 3,042 | 0 | 0% | 0% | 3,042 |
| NJ | 1,945 | 1.7 | 58 | 1,887 | 0% | 1.7% | -1829 |
| OH | 1,910 | 1.0 | 1,910 | 0 | 0% | 0% | 1,910 |
| MN | 1,728 | 0.6 | 1,426 | 302 | 0% | 0% | 1,124 |
| PA | 1,322 | 0.8 | 807 | 515 | 0% | 0% | 292 |
| MI | 1,242 | 0.8 | 1,242 | 0 | 0% | 0% | 1,242 |
| NE | 1,046 | 0.4 | 750 | 296 | 0% | 0% | 454 |
| NM | 651 | 0.1 | 651 | 0 | 0% | 0% | 651 |
| RI | 517 | 0.3 | 301 | 216 | 0% | 0% | 85 |
| CT | 503 | 0.3 | 503 | 0 | 0% | 0% | 503 |
| MD | 301 | 0.2 | 0 | 0 | 0% | 0% | 0 |
| MA | 64 | 0.02 | 0 | 64 | 0% | 0% | -64 |
| Figures are from September 4 through September 14, 2018. Numbers include broadcast television. May include a small number of primary ads. CITE SOURCE OF DATA AS: Kantar Media/CMAG with analysis by the Wesleyan Media Project. | |||||||
Top Gov Races: Illinois Advertising Far Exceeds Other Contests
Table 4 outlines spending in top gubernatorial races. Nearly $5 million has been spent in the Illinois contest, a match-up of a wealthy incumbent and billionaire challenger. In fact, the totals in Illinois are nearly double those of the second race in the list, Wisconsin, where incumbent Republican Scott Walker has a healthy advertising advantage over challenger Tony Evers.
Outside group spending is a lot more varied than in top Senate races. Groups are largely absent from the Illinois race where the candidates have plenty of personal funds to underwrite their advertising efforts. This is compared to Wisconsin, where nearly 1 in every 3 ads are from outside groups. In Michigan, where the race is open, almost half of the ads have come from groups, all of them in support of the Republican candidate. In the closely watched race for governor of Georgia, Democratic candidate Stacey Abrams has not sponsored a lot of advertising on her own, but has coordinated on nearly 2000 ads with the Georgia Democratic Party. An interest group, Power PAC, is also advertising on her behalf.
![]()
Table 4: Volume and Cost of Ads in Top Governor Races
| State | Total Airings | Est. Cost (in Ms) | Pro-Dem Airings | Pro-GOP Airings | Dem % Group | GOP % Group | Dem Ad Adv |
|---|---|---|---|---|---|---|---|
| IL | 13,641 | 5.0 | 6,881 | 6,760 | 0.00% | 9.94% | 121 |
| WI | 7,338 | 2.0 | 2,012 | 5,325 | 60.59% | 20.49% | -3,313 |
| MI | 7,064 | 2.8 | 3,172 | 3,892 | 100.00% | 68.78% | -720 |
| GA | 6,870 | 3.1 | 3,836 | 3,034 | 40.85% | 0.00% | 802 |
| OH | 6,465 | 3.2 | 2,912 | 3,553 | 52.95% | 0.00% | -641 |
| OR | 5,481 | 1.7 | 3,322 | 2,159 | 0.00% | 12.78% | 1,163 |
| NY | 4,166 | 5.1 | 4,166 | 0 | 0.00% | 0.00% | 4,166 |
| IA | 4,118 | 1.0 | 2,239 | 1,879 | 0.00% | 0.00% | 360 |
| CO | 3,726 | 2.1 | 2,558 | 1,168 | 37.69% | 37.59% | 1,390 |
| AZ | 3,660 | 1.4 | 0 | 3,660 | 0.00% | 0.00% | -3,660 |
| ME | 3,300 | 0.6 | 1,500 | 1,150 | 62.33% | 0.00% | 350 |
| TN | 3,213 | 0.9 | 2,121 | 1,092 | 0.00% | 0.00% | 1,029 |
| PA | 3,126 | 1.5 | 2,470 | 656 | 0.00% | 0.00% | 1,814 |
| FL | 2,824 | 1.2 | 389 | 2,435 | 0.00% | 28.38% | -2,046 |
| NV | 2,511 | 1.0 | 1,799 | 712 | 52.42% | 9.69% | 1,087 |
| CT | 2,382 | 1.4 | 1,226 | 1,156 | 0.00% | 51.30% | 70 |
| TX | 1,865 | 0.7 | 0 | 1,865 | 0.00% | 0.00% | -1,865 |
| NM | 1,692 | 0.6 | 1,201 | 491 | 52.21% | 0.00% | 710 |
| KS | 1,444 | 0.2 | 0 | 506 | 0.00% | 0.00% | -506 |
| MA | 1,308 | 0.8 | 2 | 1,306 | 0.00% | 38.67% | -1,304 |
| Figures are from September 4 through September 17, 2018. Numbers include broadcast television. May include a small number of primary ads. CITE SOURCE OF DATA AS: Kantar Media/CMAG with analysis by the Wesleyan Media Project. |
|||||||
Top House Races: Contests in NY, ME, MT and KY Have Seen More than 3,000 Airings
Table 5 shows advertising volume and spending in the top House races since Labor Day. Thirteen races have seen at least 2,000 airings in the last two weeks, and four have seen more than 3,000. Of the thirteen races with more than 2,000 airings, nine of them have featured significant outside group spending, including the 6th congressional district in Colorado, where nearly 64 percent of the ads were group-sponsored. Over half of the ads aired in Maine’s second congressional district have come from outside groups.
As with the Senate results above, Democratic candidates have aired more ads than Republican candidates. Twenty-five races are listed in Table 5, and Democratic candidates have aired more ads than Republican candidates in 21 of them.
![]()
Table 5: Volume and Cost of Ads in Top House Races
| District | Total Airings | Est. Cost (in Ms) | Pro-Dem Airings | Pro-GOP Airings | Dem % Group | GOP % Group | Dem Ad Adv |
|---|---|---|---|---|---|---|---|
| NY-22 | 5,810 | 0.7 | 3,479 | 2,331 | 25.7% | 44.8% | 1,148 |
| ME-02 | 4,337 | 0.8 | 2,283 | 2,054 | 45.1% | 57.5% | 229 |
| MT-01 | 3,154 | 0.3 | 1,949 | 1,205 | 0% | 0% | 744 |
| KY-06 | 3,115 | 0.8 | 1,676 | 1,439 | 40.4% | 37.3% | 237 |
| WI-06 | 2,888 | 0.3 | 2,888 | 0 | 0% | 0% | 2,888 |
| CO-06 | 2,826 | 2.0 | 2,108 | 718 | 60.4% | 74.0% | 1,390 |
| NY-19 | 2,680 | 0.6 | 1,398 | 1,282 | 26.4% | 36.0% | 116 |
| MN-03 | 2,338 | 1.1 | 1,084 | 1,254 | 25.2% | 35.1% | -170 |
| KS-02 | 2,325 | 0.4 | 1,297 | 1,028 | 0% | 100.0% | 269 |
| IA-03 | 2,205 | 0.7 | 1,379 | 826 | 0% | 58.1% | 553 |
| VA-02 | 2,090 | 0.5 | 1,301 | 789 | 0% | 0% | 512 |
| OH-01 | 2,027 | 0.8 | 949 | 1,078 | 29.4% | 68.1% | -129 |
| KS-03 | 1,922 | 0.7 | 993 | 929 | 0% | 71.4% | 64 |
| IA-01 | 1,909 | 0.4 | 1,386 | 523 | 41.6% | 0% | 863 |
| CA-10 | 1,789 | 0.7 | 1,195 | 594 | 0% | 16.5% | 601 |
| WA-08 | 1,665 | 1.1 | 888 | 777 | 26.2% | 58.0% | 111 |
| AZ-02 | 1,611 | 0.3 | 911 | 700 | 0% | 0% | 211 |
| MI-08 | 1,539 | 0.9 | 1,165 | 374 | 23.6% | 0% | 791 |
| TX-31 | 1,533 | 0.3 | 1,533 | 0 | 0% | 0% | 1,533 |
| PA-08 | 1,503 | 0.3 | 474 | 1,029 | 0% | 0% | -555 |
| PA-01 | 1,457 | 1.7 | 932 | 525 | 0% | 50.1% | 407 |
| WA-05 | 1,395 | 0.3 | 841 | 554 | 14.7% | 0% | 287 |
| NM-02 | 1,333 | 0.2 | 1,205 | 128 | 0% | 0% | 1,077 |
| TX-23 | 1,287 | 0.7 | 713 | 574 | 0% | 8.4% | 139 |
| IL-12 | 1,263 | 0.6 | 1,060 | 203 | 0% | 0% | 857 |
| Figures are from September 4 through September 17, 2018. Numbers include broadcast television. May include a small number of primary ads. CITE SOURCE OF DATA AS: Kantar Media/CMAG with analysis by the Wesleyan Media Project. | |||||||
Top Group Advertisers: Majority Forward Leads the Way
The most active group in the last two weeks has been the pro-Democratic 501c4 group, Majority Forward. It has aired ads in seven Senate races. (See Table 6.) The next six groups on the list are pro-Republican groups. These include the Congressional Leadership Fund, which has sponsored ads in sixteen House races, and the Senate Leadership Fund, active in six races. Both groups have ties to congressional leaders in each chamber. A number of groups in the table are active in only one race, most often a gubernatorial race. Nonetheless, two groups—Americans for Prosperity and State Solutions, Inc—are active in multiple gubernatorial campaigns.
![]()
Table 6: Top Group Ad Sponsors and Active Races (Sept. 4-17)
| Sponsor | Est. Cost (in Ms) | Ad Airings | Favored Party | Races |
|---|---|---|---|---|
| Majority Forward | 3.8 | 13,410 | Dem | Sen: AZ, FL, IN, MO, ND, NV, TN |
| Congressional Leadership Fund | 3.0 | 8,440 | Rep | House: CA10, CO06, IA03, KS02, KS03, KY06, ME02, MN03, MN08, NE02, NY19, NY22, OH01, PA01, VA07, WA08 |
| Senate Leadership Fund | 1.5 | 5,407 | Rep | Sen: IN, MO, ND, NV, TN, WV |
| Americans For Prosperity | 1.3 | 4,051 | Rep | Gov: MI, WI; Sen: MO, MT, TN, WI |
| New Republican PAC | 1.1 | 2,395 | Rep | Sen: FL |
| State Solutions, Inc. | 1.0 | 2,163 | Rep | Gov: CO, IL, MI, OR, SC |
| One Nation | 0.7 | 1,429 | Rep | Sen: AZ, IN, MO, ND, NV, TN |
| House Majority PAC | 0.6 | 1,470 | Dem | House: IA01, MI08, NJ03, NY19, VA07, WA08 |
| Stronger Michigan | 0.6 | 1,354 | Rep | Gov: MI |
| AFSCME | 0.5 | 1,020 | Dem | Gov: OH |
| Commonwealth Future Independent Expenditure PAC | 0.5 | 505 | Rep | Gov: MA |
| End Citizens United | 0.4 | 894 | Dem | Sen: MT; House: CO06, MN03 |
| Good Jobs Colorado | 0.4 | 964 | Dem | Gov: CO |
| Power PAC | 0.4 | 1,567 | Dem | Gov: GA |
| Nevada Families First | 0.4 | 943 | Dem | Gov: NV |
| Texans Are | 0.4 | 1,033 | Rep | Sen: TX |
| Change PAC | 0.4 | 593 | Rep | Gov: CT |
| Florida Facts | 0.4 | 691 | Rep | Gov: FL |
| A Stronger Wisconsin | 0.4 | 1,219 | Dem | Gov: WI |
| Figures are from September 4 through September 17, 2018. Numbers include broadcast television. May include a small number of primary ads. CITE SOURCE OF DATA AS: Kantar Media/CMAG with analysis by the Wesleyan Media Project. |
||||
Nearly Half of Group Spending From Dark Money Groups
In partnership with the Center for Responsive Politics, the Wesleyan Media Project tracks outside group ad spending by the type of donor disclosure. We classify groups as full-disclosure groups (meaning they disclose contributor lists to the Federal Election Commission), non-disclosing dark money groups (which are not required to disclose publicly their donors; these are most often 501c4 non-profits), and partial-disclosure groups (those that disclose donors but also accept contributions from dark money sources).
Table 7 outlines the type of disclosure for groups sponsoring ads congressional races. Since Labor Day, there are notable differences by party and congressional chamber. For pro-Democratic ads in House races, three-quarters of the ads have come from full disclosure groups like House Majority PAC. In contrast, almost all of the pro-Democratic spending (92 percent) in Senate races is from dark money sources like Majority Forward.
On the Republican side, nearly all of the spending in House races is from one group, classified as a partial disclosing one. This is the Congressional Leadership Fund, which, while a super PAC, nonetheless accepts significant contributions from dark money sources. According to FEC reports, the group has received millions in contributions from the 501c4 group, American Action Network. Pro-Republican funding in Senate races is tilted more towards full-disclosure groups like the Senate Leadership Fund, which has accepted significant funding from some corporations and wealthy individuals but not from dark money sources.
All told, 48 percent of the ads aired since Labor Day are from dark money groups. This is not all that different from the cycle-to-date totals, where the WMP finds that 49 percent of the spending from outside groups in congressional races is from dark money groups.
![]()
Table 7: Group Activity in Federal Races by Disclosure Type, Party, and Office
| Disclosure Type | |||||
|---|---|---|---|---|---|
| Pro-Democratic | None | Partial | Full | Total | |
| US House | Ad Airings | 1,767 | 0 | 4901 | 6,668 |
| Est. Cost (in Ms) | 0.2 | 0 | 1.9 | ||
| % Count | 26.5% | 0.0% | 73.5% | ||
| US Senate | Ad Airings | 13,848 | 473 | 798 | 15,119 |
| Est. Cost (in Ms) | 3.9 | 0.2 | 0.3 | ||
| % Count | 91.6% | 3.1% | 5.3% | ||
| Pro-Republican | None | Partial | Full | Total | |
| US House | Ad Airings | 423 | 8440 | 4 | 8,867 |
| Est. Cost (in Ms) | 0.2 | 3.0 | 0 | ||
| % Count | 4.8% | 95.2% | 0.0% | ||
| US Senate | Ad Airings | 5,976 | 51 | 9,509 | 15,536 |
| Est. Cost (in Ms) | 2.1 | 11K | 3.4 | ||
| % Count | 38.5% | 0.3% | 61.2% | ||
| Figures are from September 4 through September 17, 2018. Numbers include broadcast television. May include a small number of primary ads. Disclosure categorization from the Center for Responsive Politics. CITE SOURCE OF DATA AS: Kantar Media/CMAG with analysis by the Wesleyan Media Project. |
|||||
Democrats Continue Laser Focus on Healthcare; Taxation (But Not Necessarily Tax Reform) Takes Top Billing for Republicans
Pro-Democratic messaging in federal races is concentrated primarily on healthcare, with 44 percent of airings in U.S. House races and 50 percent of airings in U.S. Senate races featuring the topic. Although pro-Republican messaging in both the House and Senate is focused on taxes, there is more diversity in issue focus than on the Democratic side. More specifically, while nearly half (49 percent) of pro-Republican airings in U.S. House contests are focused on taxes, 27 percent of airings in U.S. Senate do the same. Healthcare is the second most mentioned issue in pro-Republican U.S. House ads, with 34 percent of all ads referencing it. U.S. Senate contests feature pro-Trump and immigration messages second and third; they appear in 24 percent and 23 percent of ads, respectively.
![]()
“The 2018 midterms are turning out to be the year of healthcare. Although Republicans are no longer touting unified repeal and replace messages like prior cycles, they also aren’t ignoring the issue, and Democrats – in stark contrast to earlier cycles – are really focusing the bulk of their messaging on healthcare as their signature issue,” said Erika Franklin Fowler, co-director of the Wesleyan Media Project.
![]()
![]()
Table 8: Top Issues in U.S. House Races
| Democrat | % of Airings | Republican | % of Airings | |
|---|---|---|---|---|
| Healthcare | 44% | Taxes | 49% | |
| Medicare | 18% | Healthcare | 34% | |
| Social Security | 17% | Budget | 29% | |
| Taxes | 14% | Tax Reform | 20% | |
| Corruption | 13% | Jobs | 17% | |
| Figures are from September 4 through September 17, 2018. May include a small number of primary ads. CITE SOURCE OF DATA AS: Kantar Media/CMAG with analysis by the Wesleyan Media Project. |
||||
![]()
Table 9: Top Issues in U.S. Senate Races
| Democrat | % of Airings | Republican | % of Airings | |
|---|---|---|---|---|
| Healthcare | 50% | Taxes | 27% | |
| Budget | 17% | Pro-Trump | 24% | |
| Prescription drugs | 16% | Immigration | 23% | |
| Campaign finance | 13% | Budget | 22% | |
| Veterans | 11% | Anti-Clinton | 20% | |
| Figures are from September 4 through September 17, 2018. May include a small number of primary ads. CITE SOURCE OF DATA AS: Kantar Media/CMAG with analysis by the Wesleyan Media Project. |
||||
Early Fall 2018 Advertising Not as Negative as 2014
The early fall portion of the general election is on par with previous cycles in terms of the tone of advertising, if not slightly less negative than the previous midterm in 2014. Table 10 shows the distribution of attack, positive, and contrast ads in congressional and gubernatorial races in 2018 compared to 2014 and 2010. We include all ads aired in these races from September 4 to 17, including party and outside group ads.
Nearly half of the ads in Senate races and just over a third of the ads in House races are negative, both slight drops from 2014 (though increases over 2010). There is also more positive advertising compared to 2014 as well, with nearly half of all House ads this cycle being positive, compared to 40 percent in 2014. Thirty percent of Senate ads this year were coded as positive in comparison to 25 percent in 2014.
![]()
Table 10: Tone of Advertising Over Time by Office
| Attack % | Contrast % | Positive % | ||
|---|---|---|---|---|
| 2010 | Governor | 41.0% | 14.7% | 44.3% |
| US House | 34.3% | 21.5% | 44.3% | |
| US Senate | 37.7% | 18.1% | 46.4% | |
| 2014 | Governor | 42.6% | 19.8% | 37.6% |
| US House | 40.7% | 18.5% | 40.8% | |
| US Senate | 52.4% | 21.2% | 25.6% | |
| 2018 | Governor | 41.7% | 22.2% | 36.1% |
| US House | 36.1% | 14.3% | 49.6% | |
| US Senate | 48.2% | 21.2% | 30.6% | |
| Figures are from September 4 through September 17 for each year. Numbers include broadcast television. May include a small number of primary ads. CITE SOURCE OF DATA AS: Kantar Media/CMAG with analysis by the Wesleyan Media Project. |
||||
Table 11 ranks Senate races by their share of purely promotional (positive) advertising over the past two weeks, starting with the least positive race. Out of the nearly 5,700 airings in the Nevada senate race, a mere two percent have been positive, while just 12 percent of Senate ads in Montana have been positive.
![]()
Table 11: Least Positive U.S. Senate Races
| State | Positive % | Contrast % | Attack % | Total Airings |
|---|---|---|---|---|
| NV | 1.9% | 39.3% | 58.8% | 5,691 |
| MT | 12.0% | 18.7% | 69.3% | 8,480 |
| TN | 15.5% | 18.8% | 65.8% | 10,489 |
| ND | 16.8% | 34.9% | 48.4% | 4,153 |
| WV | 23.2% | 34.0% | 42.8% | 6,832 |
| OH | 27.3% | 0.0% | 72.7% | 1,910 |
| FL | 27.7% | 38.5% | 33.8% | 13,955 |
| NE | 28.3% | 71.7% | 0.0% | 1,046 |
| AZ | 31.1% | 13.9% | 55.1% | 7,436 |
| NJ | 31.4% | 30.4% | 38.2% | 1,945 |
| MO | 32.5% | 9.2% | 58.3% | 9,842 |
| IN | 34.8% | 12.0% | 53.2% | 8,782 |
| WI | 45.0% | 6.8% | 48.2% | 3,976 |
| TX | 49.2% | 0.0% | 50.8% | 5,520 |
| PA | 55.1% | 0.0% | 44.9% | 1,322 |
| RI | 58.2% | 0.0% | 41.8% | 517 |
| VA | 64.2% | 35.8% | 0.0% | 3,042 |
| MD | 73.8% | 26.2% | 0.0% | 301 |
| MN | 82.5% | 17.5% | 0.0% | 1,728 |
| CT | 100.0% | 0.0% | 0.0% | 503 |
| MI | 100.0% | 0.0% | 0.0% | 1,242 |
| NM | 100.0% | 0.0% | 0.0% | 651 |
| Figures are from September 4 through September 17 for each year. Numbers include broadcast television and exclude 64 airings from MA primary. CITE SOURCE OF DATA AS: Kantar Media/CMAG with analysis by the Wesleyan Media Project. |
||||
Table 12 ranks U.S. House races by their share of purely promotional (positive) advertising, starting with the least positive race. Three U.S. House contests (Kansas’ 2nd district with 2,325 airings, Minnesota’s 1st with 957 airings, and Washington’s 5th with 1,395 airings) have not seen a single positive ad since Labor Day. Voters in Oregon’s 2nd congressional district have seen only attack ads, but the volume of ads has been small (just 138 airings in the past two weeks).
![]()
Table 12: Least Positive U.S. House Races
| Race | Positive % | Contrast % | Attack % | Total Airings |
|---|---|---|---|---|
| KS-02 | 0.0% | 22.9% | 77.1% | 2,325 |
| MN-01 | 0.0% | 41.1% | 58.9% | 957 |
| OR-02 | 0.0% | 0.0% | 100.0% | 138 |
| WA-05 | 0.0% | 48.5% | 51.5% | 1,395 |
| OH-01 | 3.1% | 26.9% | 70.0% | 2,027 |
| FL-16 | 5.6% | 16.3% | 78.1% | 393 |
| PA-01 | 11.3% | 54.5% | 34.2% | 1,457 |
| CO-06 | 13.2% | 23.2% | 63.6% | 2,826 |
| PA-08 | 21.1% | 23.8% | 55.2% | 1,503 |
| MN-03 | 24.6% | 21.8% | 53.6% | 2,338 |
| TX-23 | 25.3% | 17.7% | 57.0% | 1,287 |
| CA-10 | 25.5% | 52.4% | 22.1% | 1,789 |
| WI-01 | 25.6% | 59.9% | 14.5% | 759 |
| AZ-02 | 25.9% | 30.0% | 44.0% | 1,611 |
| CA-16 | 26.1% | 36.5% | 37.4% | 230 |
| NY-22 | 29.5% | 3.1% | 67.4% | 5,810 |
| KS-03 | 30.2% | 15.9% | 53.9% | 1,922 |
| VA-10 | 30.4% | 12.1% | 57.6% | 1,011 |
| FL-25 | 30.8% | 69.2% | 0.0% | 250 |
| NY-19 | 31.9% | 10.9% | 57.3% | 2,680 |
| VA-07 | 37.3% | 13.4% | 49.3% | 1,144 |
| NY-24 | 38.3% | 8.5% | 53.2% | 1,234 |
| KY-06 | 38.8% | 24.8% | 36.3% | 3,115 |
| AZ-01 | 39.1% | 0.0% | 60.9% | 929 |
| WA-08 | 40.5% | 0.0% | 59.5% | 1,665 |
| IA-03 | 41.9% | 7.9% | 50.2% | 2,205 |
| FL-26 | 42.9% | 0.0% | 57.1% | 1,183 |
| CA-22 | 44.5% | 55.5% | 0.0% | 1,102 |
| IL-12 | 46.6% | 38.4% | 15.0% | 1,263 |
| MT-01 | 46.6% | 13.1% | 40.4% | 3,154 |
| Figures are from September 4 through September 17 for each year. Numbers include broadcast television. May include a small number of primary ads. CITE SOURCE OF DATA AS: Kantar Media/CMAG with analysis by the Wesleyan Media Project. |
||||
Finally, Table 13 ranks gubernatorial campaigns by levels of positivity in ads. Minnesota and South Carolina’s gubernatorial contests – although not the most heated in terms of the volume of airings – have both only seen pure attack ads on air. The heated Illinois contest, with nearly 14,000 ads in the two weeks since Labor Day, have featured pure attacks in 2 of every 3 ads. The Wisconsin campaign is also quite negative, with over half of the ads being pure attacks and another quarter of the ads featuring contrasts between candidates.
![]()
Table 13: Least Positive Gubernatorial Races
| State | Positive % | Contrast % | Attack % | Total Airings |
|---|---|---|---|---|
| MN | 0.0% | 0.0% | 100.0% | 439 |
| SC | 0.0% | 0.0% | 100.0% | 625 |
| AZ | 2.6% | 48.3% | 49.2% | 3,660 |
| IA | 4.1% | 49.9% | 46.1% | 4,118 |
| OR | 10.7% | 49.6% | 39.8% | 5,481 |
| IL | 12.4% | 18.7% | 69.0% | 13,641 |
| OH | 13.2% | 45.4% | 41.4% | 6,465 |
| CO | 20.5% | 29.0% | 50.5% | 3,726 |
| CT | 21.0% | 42.2% | 36.8% | 2,382 |
| NV | 21.5% | 18.7% | 59.8% | 2,511 |
| WI | 23.3% | 23.1% | 53.6% | 7,338 |
| RI | 30.0% | 0.0% | 70.0% | 981 |
| NH | 30.2% | 69.8% | 0.0% | 162 |
| MI | 35.9% | 27.3% | 36.9% | 7,064 |
| GA | 39.8% | 0.0% | 60.2% | 6,870 |
| PA | 41.4% | 21.0% | 37.7% | 3,126 |
| NM | 50.9% | 5.0% | 44.1% | 1,692 |
| AK | 63.4% | 0.0% | 36.6% | 273 |
| TN | 71.7% | 28.3% | 0.0% | 3,213 |
| OK | 73.0% | 0.0% | 27.0% | 790 |
| FL | 75.5% | 0.0% | 24.5% | 2,824 |
| ME | 81.3% | 0.0% | 18.7% | 3,300 |
| NY | 89.3% | 10.7% | 0.0% | 4,166 |
| SD | 98.2% | 0.0% | 1.8% | 742 |
| AL | 100.0% | 0.0% | 0.0% | 445 |
| KS | 100.0% | 0.0% | 0.0% | 1,444 |
| MA | 100.0% | 0.0% | 0.0% | 1,308 |
| MD | 100.0% | 0.0% | 0.0% | 253 |
| NE | 100.0% | 0.0% | 0.0% | 808 |
| TX | 100.0% | 0.0% | 0.0% | 1,865 |
| Figures are from September 4 through September 17 for each year. Numbers include broadcast television. May include a small number of primary ads. CITE SOURCE OF DATA AS: Kantar Media/CMAG with analysis by the Wesleyan Media Project. |
||||
About This Report
Data reported here from Kantar Media/CMAG do not cover local cable buys, only broadcast television, national network and national cable buys.
The Wesleyan Media Project (WMP) provides real-time tracking and analysis of political advertising in an effort to increase transparency in elections. Housed in Wesleyan’s Quantitative Analysis Center – part of the Allbritton Center for the Study of Public Life – the Wesleyan Media Project is the successor to the Wisconsin Advertising Project, which disbanded in 2009. It is directed by Erika Franklin Fowler, associate professor of government at Wesleyan University, Michael M. Franz, professor of government at Bowdoin College and Travis N. Ridout, professor of political science at Washington State University. WMP staff include Laura Baum (Project Manager), Dolly Haddad (Project Coordinator) and Matthew Motta (Research Associate).
The Wesleyan Media Project is supported by Wesleyan University and the John S. and James L. Knight Foundation. Data are provided by Kantar Media/CMAG with analysis by the Wesleyan Media Project. WMP is partnering again this year with the Center for Responsive Politics, to provide added information on outside group disclosure.
Periodic releases of data will be posted on the project’s website and dispersed via Twitter @wesmediaproject. To be added to our email update list, click here.
For more information contact:
Lauren Rubenstein, lrubenstein@wesleyan.edu, (860) 685-3813
About Wesleyan University
Wesleyan University, in Middletown, Conn., is known for the excellence of its academic and co-curricular programs. With more than 2,900 undergraduates and 200 graduate students, Wesleyan is dedicated to providing a liberal arts education characterized by boldness, rigor and practical idealism. For more, visit wesleyan.edu.
About the John S. and James L. Knight Foundation
Knight Foundation is a national foundation with strong local roots. We invest in journalism, in the arts, and in the success of cities where brothers John S. and James L. Knight once published newspapers. Our goal is to foster informed and engaged communities, which we believe are essential for a healthy democracy.


