Over 900,000 Ads Aired in Presidential General Election Race;
Over 210,000 Ads since October 1;
President Continues to Hold Ad Advantage in Key Markets;
Independent Groups and Obama Campaign Most Likely to Use Pure Attack Ads
(MIDDLETOWN, CT) Oct. 24, 2012 – Over 915,000 presidential ads have been aired on broadcast and national cable television since June 1. This is a 44.5 percent increase from the 637,000 ads aired through October 21 in 2008 and a 43.7 percent increase from the 634,000 ads aired through October 21 in 2004. See Figure 1.
“When all is said and done, 2012 will go down as a record pulverizing year for political advertising,” said Erika Franklin Fowler, co-director of the Wesleyan Media Project. “We’ve already surpassed the total number of presidential ads aired during the entire 2008 campaign—and we still have two weeks to go before Election Day. What is especially striking is that the ads are concentrated on fewer markets than 2008, meaning that a smaller number of Americans have witnessed the onslaught of messages in the race for the White House.”
Figure 1: Volume of Presidential Advertising in 2004, 2008 and 2012
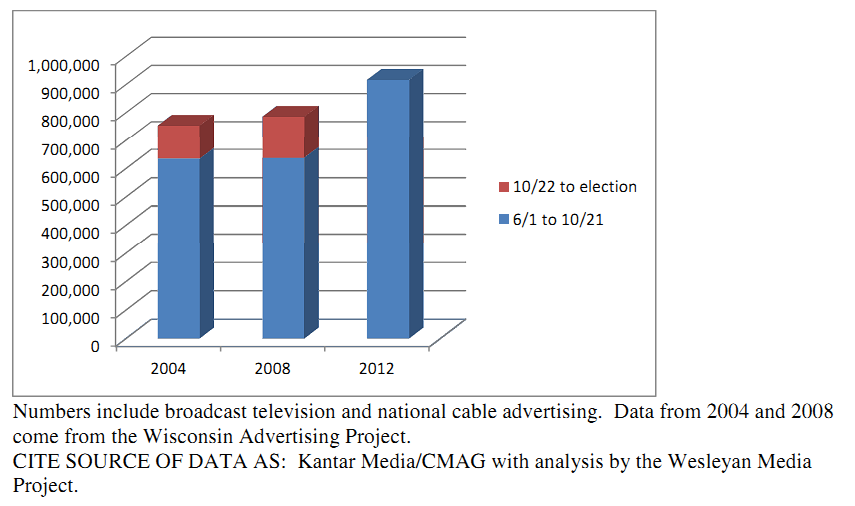
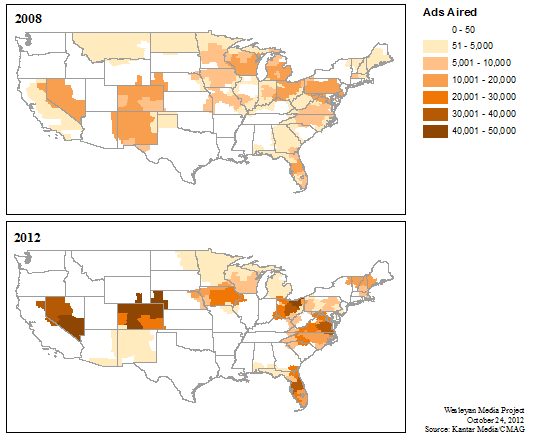
Figure 2 depicts the volume of presidential ads aired in each media market in the country since June 6 in both 2008 and 2012, showing that Las Vegas, Denver and Cleveland have been the epicenters of presidential advertising this year. It also reveals that a large portion of the country has seen no broadcast television ads (other than a few ads aired on national cable). The figures also show how the geography of ad targeting has changed since 2008. Fewer markets are receiving advertising in 2012 than in 2008, with several markets in Missouri, Indiana, Montana and North Dakota dropping off the map. Ad volumes in Michigan and Minnesota have declined, while advertising has increased in states such as Nevada, Colorado, Ohio and Virginia.
Figure 2: Ad Airings by Media Market in 2008 and 2012
Another big change since 2008 involves the sponsorship of the advertising, as Table 1 shows. Examining just the first three weeks of October, Democratic-leaning groups are estimated to have spent 438 percent more on advertising than they did four years ago, and Republican-leaning groups have increased their spending by 954 percent. In just the past three weeks, pro-Romney groups have spent over $47 million on television advertising. This translates into a $10 million advantage in ad spending by all Republican sponsors over all Democratic sponsors during the past three weeks.
Of particular note is the shift in sponsorship from 2008 to 2012 on the Republican side. In 2008, the Republican National Committee (alone or in coordination with McCain) sponsored about 85 percent of the pro-McCain ads during the first three weeks of October. The McCain campaign alone only sponsored about 9 percent of the ads aired on his behalf. In 2012, the Republican Party accounted for 12 percent of the Romney ads, while outside groups sponsored 44 percent.
In spite of the Republican’s spending advantage noted in Table 1, though, Obama and his interest group allies have maintained an advantage in the number of ads aired. Over 112,000 pro-Obama ads aired in the last three weeks compared to 97,000 for Romney.
“There was a lot of talk that Romney and his allies were hoarding resources for a major ad push in the closing moments of the campaign,” said Michael Franz, co-director of the Wesleyan Media Project. “This was supposed to counteract the Obama advantage in ads aired throughout the earlier part of the general election campaign. We just haven’t seen that to date on local broadcast,” added Franz. “And time is running out.”
Table 1: Presidential Ad Volume and Spending by Sponsor, 2008 and 2012 (October 1-21)
| Candidates | Parties | Coordinated | Groups | Total | ||
|---|---|---|---|---|---|---|
| 2008 Dems | ||||||
| Ads aired | 130,478 | 226 | 2,607 | 5,258 | 138,569 | |
| Row % | 94.16% | 0.16% | 1.88% | 3.79% | ||
| Cost | $82,437,559 | $56,897 | $1,321,977 | $2,250,505 | $86,066,938 | |
| 2008 GOP | ||||||
| Ads aired | 7,805 | 19,747 | 54,799 | 5,530 | 87,881 | |
| Row % | 8.88% | 22.47% | 62.36% | 6.29% | ||
| Cost | $3,502,074 | $8,693,427 | $23,349,869 | $4,482,846 | $40,028,216 | |
| 2012 Dems | ||||||
| Ads aired | 97,170 | 0 | 0 | 15,560 | 112,730 | |
| Row % | 86.2% | 0% | 0% | 13.8% | ||
| Cost | $65,341,560 | $0 | $0 | $12,125,740 | $77,467,300 | |
| % cost change | -20.74% | 438.80% | -9.99% | |||
| 2012 GOP | ||||||
| Ads aired | 42,937 | 3,557 | 8,050 | 42,863 | 97,407 | |
| Row % | 44.08% | 3.65% | 8.26% | 44.00% | ||
| Cost | $30,326,160 | $2,309,370 | $7,186,830 | $47,285,550 | $87,107,910 | |
| % cost change | 765.95% | -73.44% | -69.22% | 954.81% | 117.62% | |
| Numbers include broadcast television. CITE SOURCE OF DATA AS: Kantar Media/CMAG with analysis by the Wesleyan Media Project. Data from 2008 come from the Wisconsin Advertising Project. |
||||||
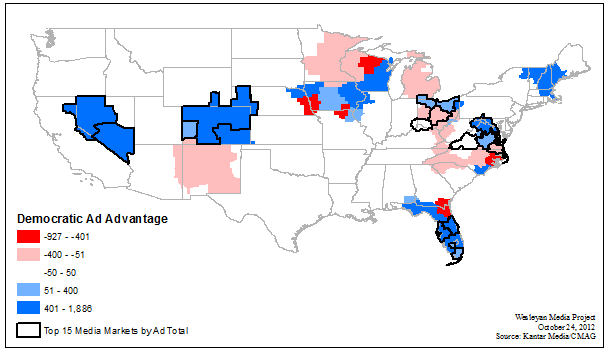
In fact, Obama had an ad advantage in October in 13 of the top 15 media markets (Table 2). Pro-Obama ads greatly outnumbered pro-Romney ads in several markets, including Denver, Las Vegas, Orlando, Washington, D.C., and Reno. The only markets in the top 15 in which Republican ads outnumber Democratic ads are Columbus, Ohio, and Norfolk, Virginia—and Romney’s advantage in those markets is slight.Figure 3 depicts in blue the media markets in which Obama and his allies have an ad advantage, while those in which Romney and his allies have had an ad advantage are shown in red. (See Table 13 at the end of the report for details on ad volumes in battleground state markets.)
Figure 3: Democratic/Republican Ad Advantage in Presidential Race (October 1-21)
“One reason Obama has been able to win the air war in most media markets is that his campaign is funding most of its own advertising, which entitles his campaign to the lowest rate charged by local television stations,” said Travis Ridout, co-director of the Wesleyan Media Project. “By contrast, many ads supporting Romney are paid for by outside groups, which must pay whatever the market will bear to get their ads on the air.”
Table 2: Top Media Markets by Volume in the Presidential Race (October 1 to 21)
| Market | Total | Obama | DNC | Dem Groups | Romney | RNC | GOP Groups | Dem Adv. |
|---|---|---|---|---|---|---|---|---|
| Denver | 9,950 | 4,122 | 0 | 1,676 | 1,677 | 373 | 2,102 | 1,646 |
| Las Vegas | 8,057 | 3,283 | 0 | 1,268 | 1,482 | 479 | 1,545 | 1,045 |
| Tampa | 7,992 | 3,905 | 0 | 312 | 1,394 | 480 | 1,901 | 442 |
| Cleveland | 7,961 | 3,180 | 0 | 903 | 1,626 | 527 | 1,725 | 205 |
| Orlando | 7,916 | 3,840 | 0 | 879 | 847 | 581 | 1,769 | 1,522 |
| Washington DC | 7,746 | 3,454 | 0 | 985 | 1,359 | 546 | 1,402 | 1,132 |
| Miami | 7,523 | 3,892 | 0 | 0 | 1,352 | 643 | 1,636 | 261 |
| Columbus, OH | 6,647 | 2,278 | 0 | 961 | 1,432 | 520 | 1,456 | -169 |
| Cincinnati | 6,488 | 2,715 | 0 | 549 | 1,320 | 544 | 1,360 | 40 |
| Norfolk | 6,489 | 2,657 | 0 | 557 | 1,692 | 271 | 1,312 | -61 |
| Richmond | 5,665 | 2,349 | 0 | 569 | 1,296 | 375 | 1,076 | 171 |
| Toledo | 5,491 | 2,050 | 0 | 761 | 1,235 | 557 | 888 | 131 |
| Roanoke | 5,403 | 2,147 | 0 | 560 | 1,300 | 266 | 1,130 | 11 |
| Grand Junction | 5,378 | 2,770 | 0 | 0 | 1,521 | 109 | 978 | 162 |
| Reno | 5,192 | 2,898 | 0 | 641 | 1,071 | 51 | 531 | 1,886 |
| Numbers include broadcast television. CITE SOURCE OF DATA AS: Kantar Media/CMAG with analysis by the Wesleyan Media Project. Party airings also include some candidate-party coordinated ads. |
||||||||
Table 3 shows the top 15 sponsors of ads in the presidential race since October 1. Obama continues to dominate the air war, having aired $65 million in ads to Romney’s $30 million. Obama is also on the air in seven more markets than Romney. American Crossroads is the third most active spender, with $28 million for over 26,000 ads. The difference in rates that candidates and groups pay for ads is somewhat apparent in the contrast between the Romney campaign ads and the American Crossroads ads. Both spent about the same amount in the last three weeks, but Romney aired 16,000 more ads. (Other factors can account for some of this difference too, including the time of day on which ads ran and average price per ad in different media markets.)Priorities USA was the fourth most active spender in the last three weeks, but this was the only pro-Obama group in the top 10. Planned Parenthood (which received an endorsement of sorts by Obama in the second debate, when he touted their contraceptive services and educational outreach) has spent over $1.5 million on 1,270 pro-Obama ads in the last three weeks.
Table 3: Top Spenders in Presidential Ad Race (October 1-21)
| Sponsor | Party | Est. Cost | Ads | # of markets |
|---|---|---|---|---|
| Barack Obama | Dem | $65,341,560 | 97,170 | 57 |
| Mitt Romney | Rep | $30,326,160 | 42,937 | 50 |
| American Crossroads | Rep | $28,532,910 | 26,798 | 48 |
| Priorities USA Action | Dem | $9,537,480 | 13,443 | 28 |
| RNC & Mitt Romney | Rep | $7,186,830 | 8,050 | 42 |
| Restore Our Future, Inc. | Rep | $7,910,480 | 6,653 | 32 |
| Republican National Committee | Rep | $2,309,370 | 3,557 | 18 |
| Americans for Job Security | Rep | $2,848,320 | 2,571 | 28 |
| American Future Fund | Rep | $1,597,730 | 1,520 | 11 |
| NRA Political Victory Fund | Rep | $814,270 | 1,514 | 16 |
| Republican Jewish Coalition | Rep | $2,796,300 | 1,511 | 4 |
| Planned Parenthood Action Fund | Dem | $1,575,410 | 1,270 | 4 |
| Special Ops OPSEC Education Fund | Rep | $293,200 | 468 | 3 |
| People for The American Way | Dem | $265,490 | 355 | 2 |
| League of Conservation Voters | Dem | $611,750 | 354 | 1 |
| Numbers include broadcast television and national cable advertising. CITE SOURCE OF DATA AS: Kantar Media/CMAG with analysis by the Wesleyan Media Project. |
||||
Table 4 expands the time frame to include the full general election. Obama’s campaign has spent over $238 million, targeting 62 markets with over 460,000 ads. Crossroads GPS and American Crossroads alone have combined to spend nearly the same as the Romney campaign on ads since he secured the nomination, though their ad totals are about 45,000 fewer than Romney. Restore Our Future, which is Romney’s super PAC, has spent over $42 million since the end of April.
Table 4: Top Spenders in Presidential Ad Race (General Election)
| Sponsor | Party | Est. Cost | Ads | # of markets |
|---|---|---|---|---|
| Obama, Barack | Dem | $238,982,260 | 460,536 | 62 |
| Romney, Mitt | Rep | $92,342,860 | 169,747 | 73 |
| Crossroads GPS | Rep | $41,981,990 | 69,097 | 67 |
| American Crossroads | Rep | $48,221,480 | 55,286 | 59 |
| Restore Our Future, Inc. | Rep | $42,741,920 | 47,819 | 99 |
| Priorities USA Action | Dem | $25,135,270 | 45,155 | 31 |
| Americans For Prosperity | Rep | $35,936,430 | 43,090 | 102 |
| RNC & Romney, Mitt | Rep | $23,262,460 | 31,918 | 42 |
| Republican National Committee | Rep | $20,438,010 | 29,627 | 69 |
| DNC & Obama, Barack | Dem | $15,309,090 | 7,210 | 53 |
| Americans For Job Security | Rep | $7,958,000 | 6,903 | 29 |
| American Future Fund | Rep | $5,524,960 | 5,449 | 41 |
| Republican Jewish Coalition | Rep | $4,641,910 | 3,134 | 4 |
| Concerned Women For America | Rep | $4,400,360 | 3,132 | 21 |
| Planned Parenthood Action Fund | Dem | $3,131,450 | 3,020 | 6 |
| Numbers include broadcast television and national cable advertising. CITE SOURCE OF DATA AS: Kantar Media/CMAG with analysis by the Wesleyan Media Project. |
||||
Tone of Presidential Race is Very Negative
One of the dominant features of the 2012 election has been the increase in negativity. This is apparent when you break down tone by sponsor over different points in the presidential general election. Table 5 shows tone of ads by candidates and outside groups in the first three weeks of October in 2012.In recent weeks, the Romney campaign has emphasized contrast ads—those that mention both candidates. Fully 52.1 percent of ads sponsored by the Romney campaign in October were contrast ads. Only 11 percent of Romney ads in the past three weeks have been positive (mentioning only the sponsoring candidate). The Obama compaign has been even more negative than the Romney campaign. Seventy-three percent of ads sponsored by the Obama campaign since October 1 have been negative (mentioning only Romney), with only 6.3 purely positive. Furthermore, pro-Romney attacks have almost universally focused on policy (96 percent) whereas the pro-Obama attacks have been using a mix of policy focused critiques (56 percent) and a combination of policy and personally focused critiques (44 percent).
Table 5: Tone of Presidential Race by Sponsor, 2012 (October 1-21)
| Positive % | Contrast % | Negative % | |
|---|---|---|---|
| Obama 2012 | 6.30% | 20.30% | 73.30% |
| Romney 2012 | 11.90% | 51.10% | 36.00% |
| Dem groups | 0.00% | 11.30% | 88.70% |
| Rep groups | 1.20% | 3.60% | 95.20% |
| Percentages are based on an analysis of broadcast television and national cable spots. Totals are based on ongoing Wesleyan Media Project coding of Kantar Media/CMAG presidential ad airings. |
|||
Table 6 compares the tone of advertising in the 2012 general election with the tone in 2004 and 2008. Data are shown for the June 1 to October 21 period. Percentage-wise, the Obama campaign in 2012 has been the most negative candidate campaign in the past three election cycles, barely eclipsing the 2004 Bush campaign in the percent of negative ads aired. (Totals for McCain in 2008 and both candidates in 2004 include spots coordinated with the party committees. These candidates relied heavily on party ads, while Obama and Romney have not. See again Table 1.)
Table 6: Tone of Presidential Race by Sponsor, 2000-2012 (June 1-October 21)*
| 2012 | |||
|---|---|---|---|
| Positive % | Contrast % | Negative % | |
| Obama 2012 | 14.4 | 27 | 58.5 |
| Romney 2012 | 20.4 | 30 | 49.2 |
| Dem groups | <1 | 21.7 | 78.2 |
| Rep groups | 2.9 | 8 | 89.2 |
| 2008 | |||
| Positive | Contrast | Negative | |
| Obama 2008 | 37 | 19.7 | 43.2 |
| McCain 2008* | 24 | 26.7 | 49.2 |
| Dem groups | 4 | 32.7 | 63.3 |
| Rep groups | 0.3 | 1 | 98.7 |
| 2004 | |||
| Positive | Contrast | Negative | |
| Kerry 2004* | 55.8 | 41.6 | 2.7 |
| Bush 2004* | 27.4 | 17 | 55.4 |
| Dem groups | 0.3 | 14.4 | 85.3 |
| Rep groups | 14.8 | 39.7 | 45.5 |
| Percentages are based on an analysis of broadcast television and national cable spots. Totals in 2012 are based on ongoing Wesleyan Media Project coding of Kantar Media/CMAG presidential ad airings. 2004 and 2008 totals are from the Wisconsin Advertising Project. *Coordinated party ads are included here |
|||
Ad Focus Shifting in Last Few Weeks
Since the Wesleyan Media Project’s September release, the focus of presidential advertising has changed. Table 7 shows that while pro-Romney ads continue to hammer on jobs (82 percent, down from 92 percent in September), they have broadened their focus to both the deficit (59 percent compared to 39 percent in September) and government spending (47 percent compared to 34 percent in September). Taxes remain a topic in more than one out of every three spots (36 percent), and discussion of the recession/economic stimulus now appears in one out of every four ads (25 percent compared to 10 percent in September). Mentions of China, however, have dropped substantially to fewer than one in ten spots (7 percent) from nearly four in ten in September (39 percent).The Obama campaign and allies continue to discuss taxes in half of their ads (49 percent), and despite the September unemployment numbers, the focus on jobs has declined noticeably (from 36 percent in September to 15 percent in the last three weeks). Instead pro-Obama ads have increased their discussion of economic disparity between citizens (up to 26 percent from 17 percent in September) and the deficit (21 percent in October compared to 16 percent in September). Health care remains steady in 15 percent of airings.
Table 7: Top Issue Mentions by Party in Presidential Ads (October 1-21)
| Pro-Obama Ads | Pro-Romney Ads | |||
|---|---|---|---|---|
| Taxes | 49.4% | Jobs | 81.8% | |
| Economic disparity | 25.8% | Deficit | 58.8% | |
| Deficit | 20.8% | Govt Spending | 47.2% | |
| Health care | 15.5% | Taxes | 35.7% | |
| Jobs | 14.6% | Recession/Econ Stimulus | 25.3% | |
| Education | 11.2% | Business | 10.9% | |
| Medicare | 7.4% | Energy Policy | 8.4% | |
| Business | 6.4% | China | 6.6% | |
| Women's Health | 5.7% | Economic disparity | 6.5% | |
| Govt Ethics | 5.7% | Health care | 5.7% | |
| China | 4.7% | Trade | 3.8% | |
| Trade | 4.2% | Welfare | 3.1% | |
| Prescription Drugs (Rx) | 3.9% | Poverty | 3.0% | |
| Energy Policy | 3.7% | Gun Control | 1.7% | |
| Housing | 3.3% | Foreign Policy | 1.4% | |
| Totals based on ongoing Wesleyan Media Project coding of Kantar Media/CMAG presidential ad airings. | ||||
As evidenced by Table 8, anger remains the top emotional appeal found in presidential advertising, with pro-Romney ads especially increasing the extent to which they rely on anger in these last three weeks (86 percent compared to 69 percent in Sept).
Table 8: Emotional Appeals in Presidential Ads (October 1-21, 2012)
| Pro-Obama ads | Pro-Romney ads | |
|---|---|---|
| Anger | 70% | 86.1% |
| Fear | 29.7% | 36% |
| Sadness | 47.3% | 32% |
| Enthusiasm | 23% | 25.3% |
| Pride | 15.1% | 4.2% |
| Totals based on ongoing Wesleyan Media Project coding of Kantar Media/CMAG presidential ad airings. | ||
Distribution of 2012 Federal Advertising for U.S. House and Senate Only
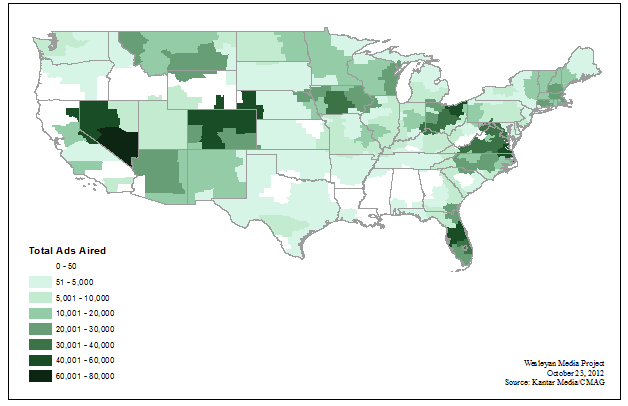
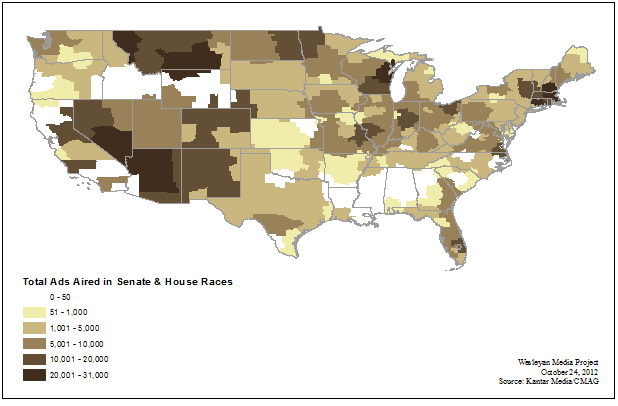
Figures 4 and 5 display the total number of ad airings for all federal races and for congressional (combining U.S. House and U.S. Senate) races across the country since June 6, respectively.
Figure 4: Total Ads Aired for Presidential, Senate & House Races (6/6 – 10/21/12)
A comparison of Figure 2 and Figure 5 indicates the much broader set of voters who are seeing congressional ads as opposed to presidential ads. In almost every market in the continental United States, voters have been exposed to some House or Senate ads.
Figure 5: Total Ads Aired in Senate & House Races (6/6 – 10/21/12)
Small Republican Advantage in Race for House and Senate
Pro-Republican sponsors, including candidates, parties and interest groups, have spent more than pro-Democratic sponsors in the race for the U.S. House and Senate (Table 9). Since June 1, Republicans have aired about 8,000 more ads than have Democrats. The Republican advantage in Senate races is greater, about 56,000 ads across all Senate races.
Table 9: Ad Spending in House and Senate Races (June 1-October 21, 2012)
| Democratic | Republican | |
|---|---|---|
| House | ||
| Ads | 195,420 | 203,477 |
| Est. Cost | $112.2 M | $124.3 M |
| Senate | ||
| Ads | 263,753 | 320,281 |
| Est. Cost | $146.5 M | $181.7 M |
| Numbers include broadcast television advertising. CITE SOURCE OF DATA AS: Kantar Media/CMAG with analysis by the Wesleyan Media Project. |
||
*Download tables of ad airings and costs for House and Senate races (PDF) (Excel)
Table 10 shows the top U.S. Senate races ranked by total spending from the October 1-21 period. Virginia’s race has been the most expensive, with over $14 million spent in just the past three weeks. A good chunk of that, almost 37 percent, has been spent by interest groups. Indiana’s Senate race is second, followed by races in Florida, Massachusetts and Ohio. Most races are closely matched in terms of spending, but there have been large disparities between Republican and Democratic spending in Connecticut, New York, Missouri and New Jersey.
Table 10: Top U.S. Senate Races by Spending (October 1-21, 2012)
| Race | Total (In Millions) | Dem (In Millions) | Rep (In Millions) | % IG |
|---|---|---|---|---|
| Virginia | $14.04 | $7.31 | $6.73 | 36.8% |
| Indiana | $10.58 | $4.94 | $5.64 | 54% |
| Florida | $10.42 | $4.96 | $5.46 | 47.70% |
| Massachusetts | $9.59 | $4.83 | $4.76 | 0% |
| Ohio | $9.48 | $5.13 | $4.36 | 28.2% |
| Arizona | $9.29 | $5.26 | $4.03 | 29.3% |
| Pennsylvania | $9.16 | $4.2 | $4.95 | 0.00% |
| Wisconsin | $8.49 | $4.5 | $3.99 | 38.3% |
| Connecticut | $8.41 | $2.19 | $6.22 | 8.4% |
| Nevada | $7.93 | $4.26 | $3.67 | 25.6% |
| New York | $4.71 | $4.23 | $0.48 | 10.2% |
| Missouri | $4.42 | $4.07 | $0.34 | 28% |
| New Jersey | $4.07 | $4.07 | $0 | 0% |
| Michigan | $3.45 | $2.96 | $0.49 | 0% |
| Montana | $3.27 | $1.65 | $1.63 | 35.8% |
| Numbers include broadcast television. CITE SOURCE OF DATA AS: Kantar Media/CMAG with analysis by the Wesleyan Media Project. |
||||
Ranked in terms of total ads aired, the Montana Senate race tops the list (Table 11) with over 25,000 ad airings. One reason Montana has seen so much advertising is the large number of media markets and low cost of advertising. Voters in Wisconsin, Indiana, Virginia and Ohio have also been inundated with advertising on their televisions.
Table 11: Top 20 U.S. Senate Races by Ad Counts (October 1-21, 2012)
| Race | Total ads | Dem ads | Rep ads | % IG |
|---|---|---|---|---|
| Montana | 25,211 | 11,396 | 13,815 | 25.6% |
| Wisconsin | 17,906 | 9,780 | 8,126 | 29.3% |
| Indiana | 12,922 | 6,131 | 6,791 | 41.60% |
| Virginia | 12,863 | 7,438 | 5,425 | 30% |
| Ohio | 12,371 | 6,687 | 5,684 | 19.2% |
| Nevada | 12,115 | 6,165 | 5,950 | 16.1% |
| Massachusetts | 11,558 | 4,943 | 6,615 | 0.00% |
| Florida | 10,321 | 6,689 | 3,632 | 28.1% |
| Arizona | 10,126 | 6,000 | 4,126 | 17.5% |
| Pennsylvania | 8,249 | 3,032 | 5,217 | 0% |
| Missouri | 7,270 | 6,842 | 428 | 17.6% |
| North Dakota | 7,050 | 3,846 | 3,204 | 28.9% |
| Maine | 5,909 | 1,601 | 2,816 | 15.50% |
| Connecticut | 5,448 | 2,245 | 3,203 | 8.8% |
| Michigan | 4,560 | 3,829 | 731 | 0% |
| Numbers include broadcast television. CITE SOURCE OF DATA AS: Kantar Media/CMAG with analysis by the Wesleyan Media Project. |
||||
There are also several highly competitive House races that have seen substantial advertising, as Table 12 shows. Topping the list is Georgia’s 12th Congressional district, which has seen 8,000 ad airings in just the past three weeks. Outside groups have been heavily involved in House races as well, airing over 30 percent of the total ads in many of these contests.
Table 12: Top U.S. House Races by Ad Counts and Cost (October 1-21, 2012)
| Dem Ads | GOP Ads | Dem$ (In Millions) | GOP$ (In Millions) | % IG Ads | |
|---|---|---|---|---|---|
| GA12 | 4,704 | 3,372 | $1.85 | $1.48 | 16.68% |
| CA24 | 2,504 | 3,970 | $0.43 | $0.90 | 30.99% |
| IL17 | 2,786 | 3,466 | $1.36 | $1.59 | 32.68% |
| CA52 | 2,524 | 2,903 | $2.33 | $2.61 | 22.72% |
| NY21 | 2,232 | 2,423 | $0.63 | $1.25 | 23.01% |
| CA36 | 2,650 | 1,971 | $0.60 | $0.43 | 11.19% |
| NY24 | 2,176 | 1,911 | $0.76 | $0.74 | 11.74% |
| TX23 | 2,329 | 1,744 | $2.58 | $1.70 | 32.02% |
| CA07 | 2,139 | 1,923 | $1.74 | $1.69 | 10.81% |
| NY27 | 2,665 | 1,272 | $1.10 | $0.81 | 24.1% |
| IL13 | 1,672 | 2,039 | $0.81 | $1.15 | 19.16% |
| UT04 | 2,031 | 1,604 | $1.22 | $0.82 | 23.93% |
| CO06 | 1,506 | 2,104 | $1.99 | $2.47 | 8.37% |
| NY19 | 1,677 | 1,840 | $0.66 | $0.75 | 30.48% |
| PA12 | 1,283 | 2,232 | $1.20 | $2.76 | 27.4% |
| KY06 | 1,767 | 1,714 | $0.90 | $0.95 | 3.05% |
| OH06 | 1,720 | 1,592 | $0.52 | $0.58 | 15.18% |
| FL18 | 1,343 | 1,825 | $1.35 | $1.43 | 32.19% |
| NV03 | 1,949 | 1,338 | $1.59 | $1.29 | 1.55% |
| AZ01 | 1,742 | 1,486 | $1.73 | $1.81 | 10.32% |
| Numbers include broadcast television. CITE SOURCE OF DATA AS: Kantar Media/CMAG with analysis by the Wesleyan Media Project. |
|||||
Table 13 shows the spending and activity of the top 15 groups in congressional races since October 1. Crossroads GPS tops the list with over 16,000 ads in 8 Senate races and 9 House races. Majority PAC, which is airing ads for Senate Democrats, has ramped up its presence on the airwaves. In the final three weeks of September the groups aired only 1,300 ads. In the three weeks since the beginning of October, the group has aired nearly 8,000. Of the top 15 groups, seven are airing ads in support of congressional Democrats.
Table 13: Spending and Ad Totals of Top 15 Outside Groups in U.S. House & U.S. Senate Races (October 1-21, 2012)
| Sponsor | Spending | Ads | Races |
|---|---|---|---|
| Crossroads GPS | $10.1 M | 16,269 | IN, ME, MT, ND, NV, OH, VA, WI Sen, CA21, IA03, IL12, IL17, IN02, NV04, NY01, NY19, NY25 |
| Majority PAC | $5.6 M | 7,895 | AZ, CT, IN, MO, MT, ND, NV, OH, VA, WI Sen |
| U.S. Chamber Of Commerce | $8.5 M | 7,341 | CT, FL, HI, ME, ND, NM, OH, VA Sen, CA07, CA09, CA10, CA24, CA52, GA12, IL10, IL11, IL12, IL13, IL17, MA06, NY21, NY24, NY25, NY27, UT04 |
| House Majority PAC | $8.7 M | 5,977 | AZ01, AZ02, AZ09, CA10, CA24, CO06, FL10, FL16, FL18, IA01, IL08, IL10, IL11, IL17, IN02, MN08, NH02, NV03, NV04, NY27, TN04, VA02, WA01 |
| AFSCME | $4.0 M | 2,994 | HI, IN, NV, VA, WI Sen, CA07, CA10, CA52, CO07, IL17, MN08, NV04, OH16, PA12, TX23 |
| Americans For Tax Reform | $2.3 M | 2,862 | CA52, CO03, GA12, KY16, NY18, NY21, OH06, PA12 |
| SEIU-COPE | $1.9 M | 2,421 | MO, MT, NV, WI Sen, CA52, CO07, FL18, IA04, IL08, IL17, NY19, OH16 |
| American Crossroads | $3.8 M | 2,148 | FL Sen |
| Patriot Majority USA | $1.7 M | 1,838 | MT, ND, NV Sen, FL02, GA12, UT04 |
| American Hospital Association | $0.9 M | 1,819 | CA24, IA01, LA03, NY19, NY22, NY23, WA05 |
| Club for Growth | $2.1 M | 1,467 | AZ, IN, OH Sen |
| YG Action Fund | $1.7 M | 1,366 | FL18, FL22, GA12, IL12, NC07, NC08, PA12, |
| Women Vote | $734,060 | 1,038 | H1, MO, NV, WI Sen, IL17 |
| American Action Network | $990,020 | 916 | CA10, IL13, NH01, NY26 |
| League of Conservation Voters | $838,520 | 862 | NY24, TX23 |
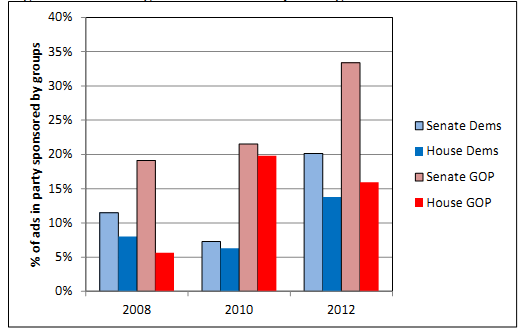
Figure 6 compares interest group ad counts in House and Senate races in 2008, 2010, and 2012, split by party. Republican groups account for a greater percentage of pro-GOP ads aired in 2012 than in 2010 and 2008 in Senate races, and the same is true of Democratic groups in House and Senate races. The only decline is for pro-Republican groups in House races this year. They have accounted for about 16 percent of ads aired on behalf of Republican House, down from 20 percent in 2010.Since June 1, fully one-third of all Senate ads that promoted Republican candidates have been sponsored by outside groups. That number is nowhere near anything comparable in recent congressional elections.
Figure 6: Percentage of Interest Group Airings in U.S. House and U.S. Senate Elections
Tables 14 and 15 give a breakdown of advertising by sponsor in the Montana and Wisconsin U.S. Senate races.
Table 14: Ads by Sponsor in Race for U.S. Senate in Montana (October 1-21, 2012)
| Sponsor | Est. Cost | Ads |
|---|---|---|
| Tester, Jon | 700,000 | 5,485 |
| Rehberg, Denny | 540,000 | 5,058 |
| National Republican Senatorial Committee | 408,000 | 42 |
| Crossroads Grassroots Policy Strategies | 600,000 | 3,809 |
| Democratic Senatorial Campaign Committee | 376,000 | 3,260 |
| Majority PAC | 452,000 | 2,020 |
| National Republican Senatorial Committee & Rehberg, Denny | 77,000 | 8 |
| SEIU | 110,000 | 582 |
| Patriot Majority USA | 11,000 | 49 |
| CITE SOURCE OF DATA AS: Kantar Media/CMAG with analysis by the Wesleyan Media Project. | ||
Table 15: Ads by Sponsor in Race for U.S. Senate in Wisconsin (October 1-21, 2012)
| Sponsor | Est. Cost (in 000's) | Ads |
|---|---|---|
| Baldwin, Tammy | 2,239 | 5,098 |
| Democratic Senatorial Campaign Committee | 1,109 | 2,866 |
| National Republican Senatorial Committee | 1,057 | 2,799 |
| Crossroads Grassroots Policy Strategies | 1,401 | 2,737 |
| Thompson, Tommy | 819 | 1,850 |
| AFSCME | 408 | 652 |
| Americans for Prosperity | 601 | 601 |
| Majority PAC | 373 | 436 |
| SEIU | 230 | 338 |
| Women Vote | 123 | 338 |
| Emergency Committee for Isreal | 112 | 139 |
| Baldwin, Tammy & Democratic Senatorial Campaign Committee | 16 | 52 |
| CITE SOURCE OF DATA AS: Kantar Media/CMAG with analysis by the Wesleyan Media Project. | ||
Table A1: Volume and Cost of Presidential Advertising in Battleground States (October 1-21, 2012)
| Market | Total | Pro-Obama | Pro-Romney | Dem Adv. | Est Dem Cost (Ms) | Est Rep Cost (Ms) |
|---|---|---|---|---|---|---|
| Colorado | ||||||
| Denver | 9,950 | 5,798 | 4,152 | 1,646 | 7.13 | 6.58 |
| Colo. Springs | 4,788 | 2,761 | 2,027 | 734 | 0.26 | 0.31 |
| Grand Junction | 5,378 | 2,770 | 2,608 | 162 | 0.86 | 0.74 |
| Florida | ||||||
| Tampa | 7,992 | 4,217 | 3,775 | 442 | 4.77 | 5.70 |
| Orlando | 7,916 | 4,719 | 3,197 | 1,522 | 4.99 | 4.77 |
| Ft. Myers | 4,464 | 2,659 | 1,805 | 854 | 4.61 | 6.81 |
| W. Palm Beach | 4,534 | 2,714 | 1,820 | 894 | 1.93 | 1.60 |
| Miami | 7,523 | 3,892 | 3,631 | 261 | 0.88 | 1.52 |
| Jacksonville | 4,506 | 2,021 | 2,485 | -464 | 1.16 | 0.92 |
| Tallahassee | 1,838 | 1,553 | 285 | 1,268 | 0.44 | 0.14 |
| Gainesville | 1,782 | 1,146 | 636 | 510 | 0.27 | 0.28 |
| Panama City | 602 | 602 | 0 | 602 | 0.12 | 0.00 |
| Dothan | 216 | 216 | 0 | 216 | 0.08 | 0.00 |
| Iowa | ||||||
| Davenport | 3,894 | 2,210 | 1,684 | 526 | 1.13 | 1.31 |
| Des Moines | 4,905 | 2,550 | 2,355 | 195 | 0.89 | 0.87 |
| Cedar Rapids | 4,335 | 2,539 | 1,796 | 743 | 1.41 | 1.31 |
| Sioux City | 3,385 | 1,976 | 1,409 | 567 | 0.66 | 0.59 |
| Rochester, MN | 3,234 | 1,477 | 1,757 | -280 | 0.38 | 0.40 |
| Omaha | 1,911 | 492 | 1,419 | -927 | 0.39 | 1.01 |
| Ottumwa | 1,122 | 329 | 793 | -464 | 0.10 | 0.15 |
| Quincy | 407 | 242 | 165 | 77 | 0.06 | 0.04 |
| North Carolina | ||||||
| Charlotte | 4,105 | 1,932 | 2,173 | -241 | 1.46 | 2.25 |
| Raleigh | 2,992 | 1,349 | 1,643 | -294 | 1.33 | 2.02 |
| Greensboro | 2,749 | 1,375 | 1,374 | 1 | 0.49 | 0.63 |
| Greenville, NC | 2,389 | 917 | 1,472 | -555 | 0.25 | 0.55 |
| Greenville, SC | 1,293 | 526 | 767 | -241 | 0.28 | 0.52 |
| Wilmington | 1,003 | 768 | 235 | 533 | 0.20 | 0.09 |
| New Hampshire | ||||||
| Burlington | 2,090 | 1,441 | 649 | 792 | 0.56 | 0.37 |
| Portland, ME | 1,822 | 1,231 | 591 | 640 | 0.53 | 0.36 |
| Boston | 1,409 | 912 | 497 | 415 | 1.51 | 1.18 |
| Manchester, NH | 1,403 | 814 | 589 | 225 | 0.52 | 0.45 |
| Nevada | ||||||
| Las Vegas | 8,057 | 4,551 | 3,506 | 1,045 | 3.65 | 4.15 |
| Reno | 5,192 | 3,539 | 1,653 | 1,886 | 0.85 | 0.48 |
| Ohio | ||||||
| Cleveland | 7,961 | 4,083 | 3,878 | 205 | 4.74 | 5.77 |
| Columbus, OH | 6,647 | 3,239 | 3,408 | -169 | 2.94 | 3.32 |
| Cincinnati | 6,488 | 3,264 | 3,224 | 40 | 2.16 | 2.93 |
| Toledo | 5,491 | 2,811 | 2,680 | 131 | 1.06 | 1.09 |
| Dayton | 4,328 | 2,082 | 2,246 | -164 | 1.06 | 1.51 |
| Youngstown | 3,917 | 2,177 | 1,740 | 437 | 0.95 | 0.86 |
| Charleston, WV | 1,854 | 862 | 992 | -130 | 0.34 | 0.34 |
| Lima | 1,206 | 405 | 801 | -396 | 0.16 | 0.14 |
| Wheeling | 1,334 | 630 | 704 | -74 | 0.09 | 0.14 |
| Zanesville | 817 | 388 | 429 | -41 | 0.23 | 0.14 |
| Parkersburg | 936 | 573 | 363 | 210 | 0.12 | 0.12 |
| Virginia | ||||||
| Washington, DC | 7,746 | 4,439 | 3,307 | 1,132 | 8.46 | 9.23 |
| Norfolk | 6,489 | 3,214 | 3,275 | -61 | 1.59 | 1.99 |
| Richmond | 5,665 | 2,918 | 2,747 | 171 | 1.29 | 1.65 |
| Roanoke | 5,403 | 2,707 | 2,696 | 11 | 0.80 | 1.12 |
| Charlottesville | 2,800 | 1,529 | 1,271 | 258 | 0.29 | 0.37 |
| Tri-Cities | 2,631 | 1,255 | 1,376 | -121 | 0.42 | 0.64 |
| Wisconsin | ||||||
| Milwaukee | 4,418 | 2,567 | 1,851 | 716 | 1.56 | 2.12 |
| Madison | 3,924 | 2,202 | 1,722 | 480 | 0.95 | 1.05 |
| Green Bay | 3,702 | 2,212 | 1,490 | 722 | 0.63 | 0.63 |
| La Crosse | 2,274 | 961 | 1,313 | -352 | 0.35 | 0.58 |
| Wausau | 1,716 | 655 | 1,061 | -406 | 0.18 | 0.41 |
| CITE SOURCE OF DATA AS: Kantar Media/CMAG with analysis by the Wesleyan Media Project. | ||||||
About This Report
Data reported here do not cover local cable buys, only broadcast television and national cable buys. All cost estimates are precisely that: estimates. Content information is based on ongoing Wesleyan Media Project coding of Kantar Media/CMAG video, which is 100 percent complete for presidential ads between 10/1 and 10/21/12 and 96.8 percent complete for the general election period from 4/25 through 10/21/12. Intercoder reliability checks on coding found 96 percent agreement between independent assessments of tone for a Kappa score of 0.87.
The Wesleyan Media Project provides real-time tracking and analysis of all political television advertising in real-time. Housed in Wesleyan’s Quantitative Analysis Center – part of the Allbritton Center for the Study of Public Life – the Wesleyan Media Project is the successor to the Wisconsin Advertising Project, which disbanded in 2009. It is directed by Erika Franklin Fowler, assistant professor of government at Wesleyan University, Michael M. Franz, associate professor of government at Bowdoin College and Travis N. Ridout, associate professor of political science at Washington State University. Laura Baum is the Project Manager.The Wesleyan Media Project is supported by grants from The John S. and James L. Knight Foundation, the Rockefeller Brothers Fund, and Wesleyan University. Data provided by Kantar Media/CMAG with analysis by the Wesleyan Media Project using Academiclip, a web-based coding tool.Periodic releases of data will be posted on the project’s website and dispersed via Twitter @wesmediaproject. To be added to our email update list, click here.
For more information contact:
Lauren Rubenstein at 860-685-3813, 203-644-7144 (cell) or lrubenstein at wesleyan.edu
Wesleyan University, in Middletown, Conn., is known for the excellence of its academic and co-curricular programs. More than 2,700 undergraduates and over 200 graduate students from around the world pursue their classroom studies, research projects, and co-curricular interests in ways that are demanding and intensely rewarding.
The John S. and James L. Knight Foundation supports transformational ideas that promote quality journalism, advance media innovation, engage communities and foster the arts. We believe that democracy thrives when people and communities are informed and engaged. For more, visit www.knightfoundation.org.The Rockefeller Brothers Fund advances social change that contributes to a more just, sustainable, and peaceful world. The Fund’s grantmaking is organized in three thematic programs that support work in the United States and at the global level: Democratic Practice, Sustainable Development, and Peacebuilding; and in three pivotal place programs that address these themes in specific contexts: New York City, Southern China, and the Western Balkans. For more, visit www.rbf.org.
