Photo Gage Skidmore/Flickr
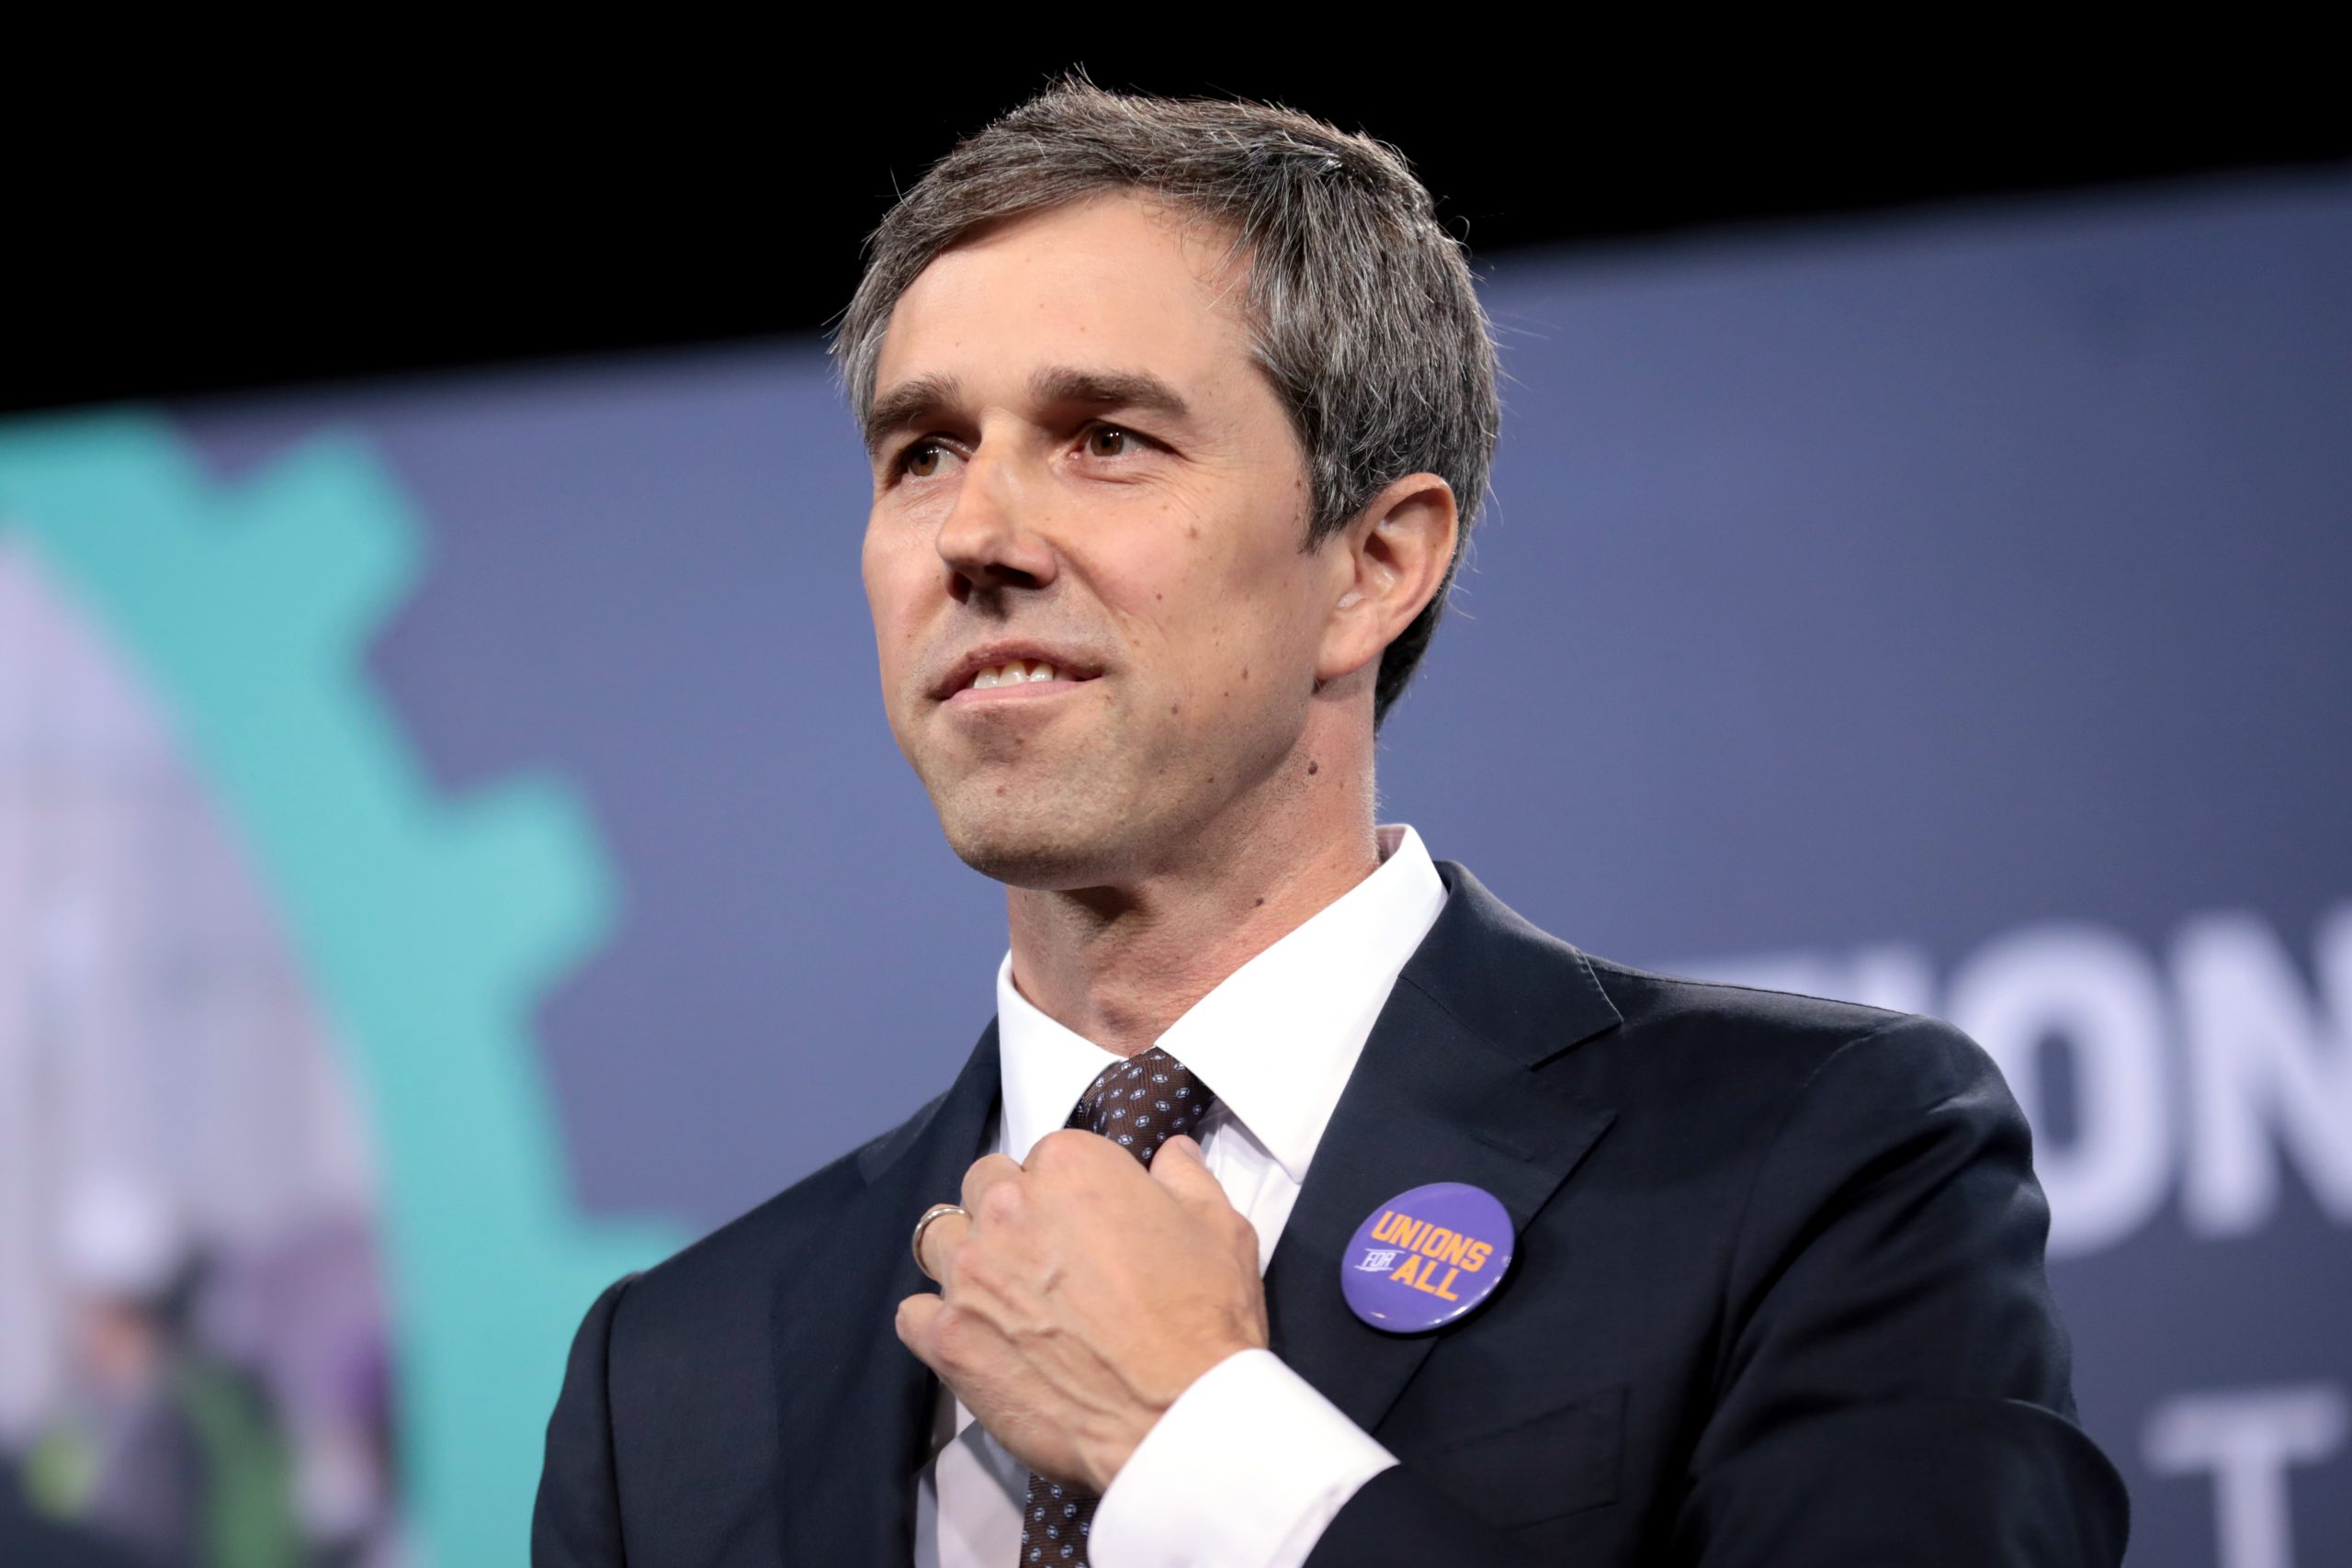
O’Rourke leads all candidates with over $5.5 million in digital ads;
Politicians hint at presidential runs with digital spending
![]()
![]()
(MIDDLETOWN, CT) October 18, 2018 – The Wesleyan Media Project’s latest analysis compares television ad spending with digital ad spending in Senate campaigns and competitive House races. Television estimates come from Kantar/CMAG, Facebook estimates come from Pathmatics, while Google spending comes from the company’s Transparency Report website. The analysis covers the period between May 31, when Google’s online archive of political advertising became available, and October 15. The analysis is not a comprehensive accounting of digital advertising, as it excludes digital ads on platforms other than Facebook or Google Ad Services, such as those paid for directly that are posted to websites or ads aired on streaming services like Hulu.
Table 1 shows the total digital and TV advertising for Senate candidates in the same time period, May 31 to October 15 (these tables exclude outside group and party spending). The table is sorted by digital spending in the race, from most to least. In total, Senate candidates have spent nearly $150 million on TV ads since May 31, compared to $17.5 million on digital advertising (with $11.5 million of that on Facebook). All told, 10.5 percent of spending was on digital. This 10:1 ratio is consistent with what the Wesleyan Media Project reported earlier in an analysis of a select number of Senate races.
![]()
Table 1: Digital and Television Spending by Senate Candidate
| Candidate | State | Facebook $s | Google $s | Digital $s | Digital $s (race) | TV $s | % digital |
|---|---|---|---|---|---|---|---|
| Beto O'Rourke | TX | 4,663,500 | 960,000 | 5,623,500 | 6,400,000 | 11,918,400 | 32.1% |
| Ted Cruz | TX | 625,400 | 157,700 | 783,100 | 6,400,000 | 5,000,440 | 13.5% |
| Elizabeth Warren | MA | 1,412,200 | 167,000 | 1,579,200 | 1,637,700 | 0 | 100.0% |
| Geoff Diehl | MA | 34,300 | 24,200 | 58,500 | 1,637,700 | 0 | 100.0% |
| Rick Scott | FL | 3,800 | 905,600 | 909,400 | 1,600,000 | 28,144,890 | 3.1% |
| Bill Nelson | FL | 243,200 | 412,800 | 656,000 | 1,600,000 | 6,607,670 | 9.0% |
| Kirsten Gillibrand | NY | 922,100 | 15,100 | 937,200 | 948,900 | 0 | 100.0% |
| Chele Farley | NY | 11,700 | 0 | 11,700 | 948,900 | 0 | 100.0% |
| Heidi Heitkamp | ND | 615,200 | 187,700 | 802,900 | 852,500 | 2,029,430 | 28.3% |
| Kevin Cramer | ND | 31,600 | 18,000 | 49,600 | 852,500 | 1,405,820 | 3.4% |
| Phil Bredesen | TN | 267,000 | 232,100 | 499,100 | 849,200 | 5,766,210 | 8.0% |
| Marsha Blackburn | TN | 32,000 | 318,100 | 350,100 | 849,200 | 3,237,430 | 9.8% |
| Claire McCaskill | MO | 195,600 | 430,000 | 625,600 | 749,800 | 8,191,000 | 7.1% |
| Josh Hawley | MO | 2,700 | 121,500 | 124,200 | 749,800 | 1,728,110 | 6.7% |
| Kyrsten Sinema | AZ | 140,300 | 252,400 | 392,700 | 559,600 | 5,696,410 | 6.4% |
| Martha McSally | AZ | 121,600 | 45,300 | 166,900 | 559,600 | 2,782,460 | 5.7% |
| Tammy Baldwin | WI | 139,400 | 311,100 | 450,500 | 498,000 | 5,507,820 | 7.6% |
| Leah Vukmir | WI | 1,800 | 45,700 | 47,500 | 498,000 | 889,150 | 5.1% |
| Jacky Rosen | NV | 142,800 | 170,200 | 313,000 | 468,100 | 5,263,010 | 5.6% |
| Dean Heller | NV | 71,700 | 83,400 | 155,100 | 468,100 | 2,932,960 | 5.0% |
| Debbie Stabenow | MI | 205,000 | 80,700 | 285,700 | 407,900 | 3,503,370 | 7.5% |
| John James | MI | 42,300 | 79,900 | 122,200 | 407,900 | 1,358,430 | 8.3% |
| Bernie Sanders | VT | 369,500 | 0 | 369,500 | 370,900 | 0 | 100.0% |
| Lawrence Zupan | VT | 1,400 | 0 | 1,400 | 370,900 | 11,230 | 11.1% |
| Karin Housley | MN-sp | 0 | 176,000 | 176,000 | 339,100 | 824,430 | 17.6% |
| Tina Smith | MN-sp | 70,400 | 92,700 | 163,100 | 339,100 | 1,980,490 | 7.6% |
| Bob Casey | PA | 153,300 | 162,300 | 315,600 | 330,800 | 3,906,410 | 7.5% |
| Lou Barletta | PA | 4,200 | 11,000 | 15,200 | 330,800 | 885,290 | 1.7% |
| Jon Tester | MT | 88,200 | 81,700 | 169,900 | 252,200 | 2,507,470 | 6.3% |
| Matt Rosendale | MT | 74,700 | 7,600 | 82,300 | 252,200 | 910,140 | 8.3% |
| Joe Donnelley | IN | 94,300 | 35,500 | 129,800 | 203,200 | 4,653,250 | 2.7% |
| Mike Braun | IN | 56,900 | 16,500 | 73,400 | 203,200 | 4,064,340 | 1.8% |
| Sherrod Brown | OH | 142,500 | 21,200 | 163,700 | 168,200 | 6,034,450 | 2.6% |
| Jim Renacci | OH | 3,400 | 1,100 | 4,500 | 168,200 | 38,170 | 10.5% |
| Martin Heinrich | NM | 51,000 | 78,600 | 129,600 | 131,900 | 1,423,820 | 8.3% |
| Mick Rich | NM | 600 | 1,700 | 2,300 | 131,900 | 0 | 100.0% |
| Chris Murphy | CT | 97,700 | 1,100 | 98,800 | 99,700 | 590,840 | 14.3% |
| Matthew Corey | CT | 900 | 0 | 900 | 99,700 | 0 | 100.0% |
| Tim Kaine | VA | 16,500 | 42,900 | 59,400 | 98,500 | 2,820,560 | 2.1% |
| Corey Stewart | VA | 35,800 | 3,300 | 39,100 | 98,500 | 58,310 | 40.1% |
| David Baria | MS | 84,900 | 0 | 84,900 | 97,200 | 88,920 | 48.8% |
| Roger Wicker | MS | 100 | 12,200 | 12,300 | 97,200 | 370,260 | 3.2% |
| Tom Carper | DE | 0 | 67,200 | 67,200 | 69,500 | 0 | 100.0% |
| Rob Arlett | DE | 2,300 | 0 | 2,300 | 69,500 | 0 | 100.0% |
| Joe Manchin | WV | 28,700 | 23,300 | 52,000 | 67,100 | 1,475,760 | 3.4% |
| Patrick Morrisey | WV | 5,300 | 9,800 | 15,100 | 67,100 | 332,890 | 4.3% |
| John Barasso | WY | 23,900 | 17,600 | 41,500 | 55,200 | 0 | 100.0% |
| Gary Trauner | WY | 8,500 | 5,200 | 13,700 | 55,200 | 0 | 100.0% |
| Bob Hugin | NJ | 21,900 | 20,800 | 42,700 | 51,200 | 9,812,110 | 0.4% |
| Bob Menendez | NJ | 8,500 | 0 | 8,500 | 51,200 | 444,640 | 1.9% |
| Amy Klobuchar | MN | 42,100 | 4,600 | 46,700 | 47,300 | 604,310 | 7.2% |
| Jim Newberger | MN | 600 | 0 | 600 | 47,300 | 0 | 100.0% |
| Bob Flanders | RI | 19,300 | 5,800 | 25,100 | 41,600 | 260,730 | 8.8% |
| Sheldon Whitehouse | RI | 16,500 | 0 | 16,500 | 41,600 | 775,290 | 2.1% |
| Cindy Hyde-Smith | MS-sp | 11,400 | 17,800 | 29,200 | 32,600 | 295,290 | 9.0% |
| Mike Espy | MS-sp | 3,400 | 0 | 3,400 | 32,600 | 0 | 100.0% |
| Mitt Romney | UT | 100 | 22,900 | 23,000 | 28,800 | 546,170 | 4.0% |
| Jenny Wilson | UT | 5,800 | 0 | 5,800 | 28,800 | 0 | 100.0% |
| Jane Raybould | NE | 17,400 | 0 | 17,400 | 27,400 | 454,670 | 3.7% |
| Deb Fischer | NE | 10,000 | 0 | 10,000 | 27,400 | 435,050 | 2.2% |
| Maria Cantwell | WA | 18,200 | 4,300 | 22,500 | 24,300 | 450,270 | 4.8% |
| Susan Hutchison | WA | 600 | 1,800 | 2,400 | 24,300 | 15,510 | 13.4% |
| Kevin de Leon | CA | 15,300 | 0 | 15,300 | 20,900 | 0 | 100.0% |
| Dianne Feinstein | CA | 5,000 | 600 | 5,600 | 20,900 | 0 | 100.0% |
| Eric Brakey | ME | 12,500 | 0 | 12,500 | 15,700 | 0 | 100.0% |
| Angus King | ME | 1,800 | 1,400 | 3,200 | 15,700 | 13,530 | 19.1% |
| Ron Curtis | HI | 1,100 | 0 | 1,100 | 1,300 | 0 | 100.0% |
| Mazie Hirono | HI | 200 | 0 | 200 | 1,300 | 103,840 | 0.2% |
| Ben Cardin | MD | 0 | 0 | 0 | 0 | 0 | |
| Tony Campbell | MD | 0 | 0 | 0 | 0 | 0 | |
| 11,551,900 | 5,967,000 | 17,518,900 | 149,151,450 | 10.5% | |||
| Figures cover the May 31 to October 15, 2018, time period. Estimates of Facebook spending come from Pathmatics, while Google spending was obtained from the Google Transparency Report. TV spending estimates come from Kantar/CMAG and include only local broadcast, national broadcast and national cable airings. |
|||||||
Figures cover the May 31 to October 15, 2018, time period. Estimates of Facebook spending come from Pathmatics, while Google spending was obtained from the Google Transparency Report. TV spending estimates come from Kantar/CMAG and include only local broadcast, national broadcast and national cable airings.
By far, the biggest spender on Facebook or Google advertising was Beto O’Rourke, Democratic candidate for Senate in Texas. He has spent $5.6 million on these ads, representing almost a third of his total spending. The only other candidate on the list to break $1 million in digital spending is Elizabeth Warren, who is running for re-election in Massachusetts. Other big digital spenders include Rick Scott in Florida, who has spent $900,000 (but most of it on Google with very little on Facebook), Heidi Heitkamp in North Dakota with $800,000 in digital spending, and Ted Cruz in Texas with $780,000 in digital spending. Heitkamp’s total amounts to about 28 percent of her combined TV and digital ad spending.
![]()
Hinting at a Presidential Run?
Table 2 shows digital spending since the end of May for several candidates who have been talked about as potential presidential candidates in 2020. Also included, for those who are currently U.S. Senators, is the percentage of their spending on Facebook (according to Pathmatics) that was in-state. A small percentage of spending in-state suggests that the candidate is more focused on building an email list and raising money in preparation for a presidential run than in running for re-election.
Donald Trump tops the list, having spent $5.8 million on Facebook and Google’s network. Senator Elizabeth Warren of Massachusetts has spent over $1.5 million on digital ads, but only 8 percent of the Facebook spending according to Pathmatics was in Massachusetts. Senator Kirsten Gillibrand of New York has spent almost $1 million on digital advertising in her re-election campaign, but only 9 percent of the Facebook spending was in her home state. Senator Kamala Harris of California, who does not face re-election until 2022, has spent over $850,000 on digital advertising since May 31. Twenty-seven percent of that was spent in her home state of California. Senator Bernie Sanders, facing token opposition in Vermont, has spent over $350,000 on digital advertising, while Senator Cory Booker has spent almost a quarter of a million on digital since the end of May. Booker is up for re-election to the Senate in 2020.
Senators Brown of Ohio and Klobuchar of Minnesota, by contrast, seem focused in their digital strategy on re-election to the Senate. Seventy-one percent of Brown’s Facebook ad spending occurred in Ohio, and 82 percent of Klobuchar’s spending occurred in Minnesota.
![]()
Table 2: Digital Spending by Potential Presidential Candidates
| Candidate | State | Facebook $s | % in-state | Google $s | Digital $s |
|---|---|---|---|---|---|
| Donald Trump | 4,419,400 | 1,410,400 | 5,829,800 | ||
| Elizabeth Warren | MA | 1,412,200 | 8.0% | 167,000 | 1,579,200 |
| Kirsten Gillibrand | NY | 922,100 | 9.0% | 15,100 | 937,200 |
| Kamala Harris | CA | 854,500 | 27.0% | 3,100 | 857,600 |
| Bernie Sanders | VT | 369,500 | 1.0% | 0 | 369,500 |
| Cory Booker | NJ | 238,800 | 7.0% | 0 | 238,800 |
| Sherrod Brown | OH | 142,500 | 71.0% | 21,200 | 163,700 |
| Amy Klobuchar | MN | 42,100 | 82.0% | 4,600 | 46,700 |
| Figures cover the May 31 to October 15, 2018, time period. Estimates of Facebook spending (and the percentage that is in-state) come from Pathmatics, while Google spending was obtained from the Google Transparency Report. |
|||||
![]()
Less Digital Spending in the House
Finally, we report Facebook and Google ad spending totals for candidates in the most competitive House campaigns, as determined by the Cook Political Report. These spending amounts are far lower than in the Senate. Pathmatics has captured about $1.1 million in spending on Facebook ads in these House races, while Google reports about $1 million in spending on ads on its platform. The races with the most digital spending are in California. About a third of the total spending in Table 3 comes from five districts in the Golden State. Proximity to the tech industry—and the high cost of broadcast television in large California media markets—may be drawing candidates there to digital platforms. Overall, 4.3 percent of total ad spending (Facebook, Google and broadcast television combined) is on the two digital platforms.
![]()
Table 3: Digital and Television Spending by House Candidates in Most Competitive Races
| FB (since May 31) | Google (since May 31) | Digital Total | Digital total (race) | TV | % digital | ||
|---|---|---|---|---|---|---|---|
| CA-10 | Jeff Denham | 18,200 | 43,100 | 61,300 | 321,800 | 517,410 | 10.6% |
| CA-10 | Josh Harder | 88,400 | 172,100 | 260,500 | 321,800 | 2,170,000 | 10.7% |
| CA-39 | Gil Cisneros | 52,000 | 148,100 | 200,100 | 210,300 | 22,450 | 89.9% |
| CA-39 | Young Kim | 5,700 | 4,500 | 10,200 | 210,300 | 0 | 100.0% |
| CA-48 | Dana Rohrabacher | 0 | 0 | 0 | 144,900 | 0 | 0.0% |
| CA-48 | Harley Rouda | 127,800 | 17,100 | 144,900 | 144,900 | 1,010,250 | 12.5% |
| NJ-03 | Tom MacArthur | 4,800 | 1,600 | 6,400 | 128,700 | 973,850 | 0.7% |
| NJ-03 | Andrew Kim | 100,600 | 21,700 | 122,300 | 128,700 | 908,140 | 11.9% |
| MI-08 | Mike Bishop | 900 | 5,200 | 6,100 | 119,600 | 1,039,940 | 0.6% |
| MI-08 | Elissa Slotkin | 92,600 | 20,900 | 113,500 | 119,600 | 2,372,810 | 4.6% |
| PA-01 | Brian Fitzpatrick | 2,300 | 54,000 | 56,300 | 102,700 | 340,460 | 14.2% |
| PA-01 | Scott Wallace | 23,700 | 22,700 | 46,400 | 102,700 | 3,526,620 | 1.30% |
| CA-25 | Steve Knight | 0 | 0 | 0 | 100,000 | 0 | 0.0% |
| CA-25 | Katie Hill | 9,400 | 90,600 | 100,000 | 100,000 | 1,210,290 | 7.6% |
| VA-07 | Dave Brat | 3,500 | 29,500 | 33,000 | 91,100 | 252,000 | 11.6% |
| VA-07 | Abigail Spanberger | 36,100 | 22,000 | 58,100 | 91,100 | 995,470 | 5.5% |
| KY-06 | Andy Barr | 20,100 | 15,800 | 35,900 | 88,400 | 1,503,250 | 2.3% |
| KY-06 | Amy McGrath | 51,700 | 800 | 52,500 | 88,400 | 1,267,390 | 4.0% |
| NY-22 | Claudia Tenney | 0 | 1,500 | 1,500 | 87,500 | 531,590 | 0.3% |
| NY-22 | Anthony Brindisi | 66,500 | 19,500 | 86,000 | 87,500 | 1,216,190 | 6.6% |
| WA-08 | Dino Rossi | 4,900 | 32,400 | 37,300 | 68,600 | 562,330 | 6.2% |
| WA-08 | Kim Schrier | 21,100 | 10,200 | 31,300 | 68,600 | 1,975,110 | 1.6% |
| IL-06 | Peter Roskam | 14,700 | 29,300 | 44,000 | 67,600 | 560,290 | 7.3% |
| IL-06 | Sean Casten | 7,700 | 15,900 | 23,600 | 67,600 | 818,730 | 2.8% |
| KS-02 | Kevin Yoder | 21,700 | 9,800 | 31,500 | 66,300 | 765,700 | 4.0% |
| KS-02 | Sharice Davids | 34,800 | 0 | 34,800 | 66,300 | 1,182,730 | 2.9% |
| CA-45 | Mimi Walters | 4,300 | 2,000 | 6,300 | 63,300 | 334,970 | 1.8% |
| CA-45 | Katie Porter | 26,000 | 31,000 | 57,000 | 63,300 | 678,210 | 7.8% |
| VA-02 | Scott Taylor | 40,900 | 0 | 40,900 | 55,500 | 323,280 | 11.2% |
| VA-02 | Elaine Luria | 9,800 | 4,800 | 14,600 | 55,500 | 740,990 | 1.9% |
| NY-19 | John Faso | 9,500 | 24,400 | 33,900 | 53,500 | 343,680 | 9.0% |
| NY-19 | Antonio Delgado | 17,000 | 2,600 | 19,600 | 53,500 | 1,868,730 | 1.0% |
| OH-01 | Steve Chabot | 0 | 0 | 0 | 47,800 | 542,110 | 0.0% |
| OH-01 | Aftab Pureval | 30,100 | 17,700 | 47,800 | 47,800 | 1,189,690 | 3.9% |
| IA-03 | David Young | 24,900 | 4,000 | 28,900 | 47,200 | 678,800 | 4.1% |
| IA-03 | Cindy Axne | 11,800 | 6,500 | 18,300 | 47,200 | 1,245,690 | 1.4% |
| NJ-07 | Leonard Lance | 1,000 | 0 | 1,000 | 43,300 | 0 | 100.0% |
| NJ-07 | Tom Malinowski | 27,700 | 14,600 | 42,300 | 43,300 | 0 | 100.0% |
| MN-08 | Joe Radinovich | 5,300 | 3,800 | 9,100 | 41,700 | 600,630 | 1.5% |
| MN-08 | Pete Stauber | 100 | 32,500 | 32,600 | 41,700 | 66,220 | 33.0% |
| IL-12 | Mike Bost | 2,800 | 20,000 | 22,800 | 33,400 | 555,000 | 3.9% |
| IL-12 | Brendan Kelly | 10,600 | 0 | 10,600 | 33,400 | 1,485,510 | 0.7% |
| NM-02 | Xochitl Torres Small | 33,200 | 0 | 33,200 | 33,300 | 721,010 | 4.4% |
| NM-02 | Yvette Herrell | 100 | 0 | 100 | 33,300 | 266,140 | 0.0% |
| NC-13 | Ted Budd | 1,400 | 0 | 1,400 | 28,000 | 324,250 | 0.4% |
| NC-13 | Kathy Manning | 19,500 | 7,100 | 26,600 | 28,000 | 703,670 | 3.6% |
| TX-07 | John Culberson | 6,400 | 0 | 6,400 | 24,000 | 875,680 | 0.7% |
| TX-07 | Lizzie Pannill Fletcher | 12,300 | 5,300 | 17,600 | 24,000 | 1,634,250 | 1.1% |
| NC-09 | Dan McCready | 2,800 | 17,800 | 20,600 | 22,600 | 1,136,460 | 1.8% |
| NC-09 | Mark Harris | 700 | 1,300 | 2,000 | 22,600 | 0 | 100.0% |
| UT-04 | Mia Love | 1,600 | 0 | 1,600 | 18,700 | 584,290 | 0.3% |
| UT-04 | Ben McAdams | 17,100 | 0 | 17,100 | 18,700 | 1,012,360 | 1.7% |
| FL-27 | Donna Shalala | 4,100 | 14,100 | 18,200 | 18,200 | 576,910 | 3.1% |
| FL-27 | Maria Salazar | 0 | 0 | 0 | 18,200 | 316,240 | 0.0% |
| MN-01 | Dan Feehan | 300 | 3,400 | 3,700 | 17,900 | 315,610 | 1.2% |
| MN-01 | Jim Hagedorn | 3,300 | 10,900 | 14,200 | 17,900 | 0 | 100.00% |
| ME-02 | Bruce Poliquin | 200 | 0 | 200 | 13,200 | 942,720 | 0.0% |
| ME-02 | Jared Golden | 9,500 | 3,500 | 13,000 | 13,200 | 1,243,600 | 1.0% |
| TX-32 | Pete Sessions | 0 | 0 | 0 | 11,800 | 542,730 | 0.0% |
| TX-32 | Colin Allred | 11,800 | 0 | 11,800 | 11,800 | 1,189,460 | 1.0% |
| Total | 1,155,300 | 1,015,600 | 2,170,900 | 48,761,890 | 4.3% | ||
| Figures cover the May 31 to October 15, 2018, time period. Estimates of Facebook spending come from Pathmatics, while Google spending was obtained from the Google Transparency Report. TV spending estimates come from Kantar/CMAG and include only local broadcast, national broadcast and national cable airings. |
|||||||
About This Report
Data reported here from Kantar Media/CMAG do not cover local cable buys, only broadcast television, national network and national cable buys. Spending on Facebook advertising comes from estimates generated by Pathmatics, a market intelligence firm. The company tracks paid advertising in the mobile Facebook newsfeeds of their opt-in panel, which consists of hundreds of thousands of users who reflect the diversity of active Facebook users. Data on Google Ad Services comes from their Transparency Report.
The Wesleyan Media Project (WMP) provides real-time tracking and analysis of political advertising in an effort to increase transparency in elections. Housed in Wesleyan’s Quantitative Analysis Center – part of the Allbritton Center for the Study of Public Life – the Wesleyan Media Project is the successor to the Wisconsin Advertising Project, which disbanded in 2009. It is directed by Erika Franklin Fowler, associate professor of government at Wesleyan University, Michael M. Franz, professor of government at Bowdoin College and Travis N. Ridout, professor of political science at Washington State University. WMP staff include Laura Baum (Project Manager), Dolly Haddad (Project Coordinator) and Matthew Motta (Research Associate).
The Wesleyan Media Project is supported by Wesleyan University and the John S. and James L. Knight Foundation. Data are provided by Kantar Media/CMAG with analysis by the Wesleyan Media Project. WMP is partnering again this year with the Center for Responsive Politics, to provide added information on outside group disclosure.
Periodic releases of data will be posted on the project’s website and dispersed via Twitter @wesmediaproject. To be added to our email update list, click here.
For more information contact:
mediaproject@wesleyan.edu
About Wesleyan University
Wesleyan University, in Middletown, Conn., is known for the excellence of its academic and co-curricular programs. With more than 2,900 undergraduates and 200 graduate students, Wesleyan is dedicated to providing a liberal arts education characterized by boldness, rigor and practical idealism. For more, visit wesleyan.edu.
About the John S. and James L. Knight Foundation
Knight Foundation is a national foundation with strong local roots. We invest in journalism, in the arts, and in the success of cities where brothers John S. and James L. Knight once published newspapers. Our goal is to foster informed and engaged communities, which we believe are essential for a healthy democracy.


