Trump Backed by Groups but is Still Out-Aired 2:1
(MIDDLETOWN, CT) May 23, 2024 – Advertising for the presidential general election has started, with about $25 million spent to-date on local broadcast and national television since March 6, the day both Joe Biden and Donald Trump had effectively secured their respective parties’ nominations. The bulk of that money has come from the Biden campaign, with $13.6 million in ad spending, backed by another $2.9 million in spending by pro-Biden groups. The Trump campaign has yet to spend a penny on broadcast or national cable television advertising during the general election period (since March 6), but pro-Trump groups have bought $8 million in advertising, totaling nearly 11,000 airings.
Table 1: Presidential Ads, Since Super Tuesday (General Election)
| Sponsor Type | Ad airings | Est Cost (in $Ms) |
|---|---|---|
| Biden | 19,899 | 13.6 |
| Democratic Party | 0 | 0 |
| Pro-Biden or Anti-Trump groups | 1,856 | 2.9 |
| Trump | 0 | 0 |
| Republican Party | 0 | 0 |
| Pro-Trump or Anti-Biden groups | 10,989 | 8.0 |
| Total | 32,744 | 24.5 |
| Figures are from March 6 to May 19, 2024. Numbers include broadcast and national cable television for all sponsors. CITE SOURCE OF DATA AS: Vivvix CMAG with analysis by the Wesleyan Media Project. |
||
Table 2 shows where those dollars have been spent. Biden’s campaign has been spending most heavily in Pennsylvania, Michigan and Arizona, while Make America Great Again, Inc.–a super PAC supporting Trump–has focused its spending in Pennsylvania, with smaller amounts being spent in Georgia and on national cable.
Another big player in the presidential race is the American Fuel and Petrochemical Manufacturers, which has been running “issue ads” that criticize the Biden administration for moving too fast on the transition away from fossil fuels.
Table 2. Broadcast TV Volume and Spending by State for Biden and by Top Pro-Trump (or anti-Biden) Groups (General Election)
| Sponsor | State | Est Cost (in $Ms) | Ad Airings |
|---|---|---|---|
| Joe Biden | Arizona | 1.9 | 3,170 |
| Joe Biden | Nevada | 0.6 | 1,407 |
| Joe Biden | Wisconsin | 1.3 | 3,083 |
| Joe Biden | Georgia | 1.4 | 1,432 |
| Joe Biden | North Carolina | 0.5 | 1,174 |
| Joe Biden | Michigan | 3.3 | 4,341 |
| Joe Biden | National Network | 0.3 | 4 |
| Joe Biden | Pennsylvania | 4.0 | 5,215 |
| Joe Biden | National Cable | 0.5 | 54 |
| Make America Great Again, Inc | National Cable | 0.5 | 33 |
| Make America Great Again, Inc | Georgia | 0.2 | 970 |
| Make America Great Again, Inc | Pennsylvania | 5.6 | 7,787 |
| American Fuel and Petrochemical Manufacturers | Michigan | 0.6 | 1,120 |
| American Fuel and Petrochemical Manufacturers | Wisconsin | 0.1 | 108 |
| American Fuel and Petrochemical Manufacturers | Nevada | 0.1 | 234 |
| American Fuel and Petrochemical Manufacturers | Pennsylvania | 0.1 | 102 |
| Building America's Future | National Cable | 0.6 | 7 |
| Unleash Prosperity Now | National Cable | 0.01 | 9 |
| Figures are from March 6 to May 19, 2024. Numbers include broadcast television for all sponsors. CITE SOURCE OF DATA AS: Vivvix CMAG with analysis by the Wesleyan Media Project. |
|||
Candidates and groups sometimes pre-book airtime for future dates during in the general election campaign, locking in certain ad rates. A review of pre-booked ad time in the presidential race reveals little to-date from the candidates–and none from the Trump campaign. This means that the Trump campaign has spent $0 on television advertising in the general election period to-date and has no advertising pre-purchased for the coming weeks, though Make America Great Again has about $600,000 in pre-booked ad time through the end of May.
President Biden has pre-booked about $1.1 million in ads (for broadcast stations, local cable, and radio) in many battleground states through only May 27. FF PAC, a super PAC that supports Biden, has over $130 million in advertising pre-booked for broadcast and local cable television starting right after the Democratic National Convention.
President Ad Volumes Down
The volume of presidential ads, more generally, is down from the past two presidential election cycles, as Figure 1 shows.
“We’re not seeing as many presidential ads as in past cycles, in part, because of relatively uncompetitive nomination races on both the Democratic and Republican sides,” said Travis Ridout, co-director of the Wesleyan Media Project. “Moreover, the campaigns are largely holding back on their television advertising so far from the general election, which is still almost 6 months away.”
Figure 1. Volume of Presidential Ad Airings by Year (Cycle to Date Totals)
Figures are from January 1 of the off-year to May 19 of the election year.
Numbers include broadcast television for all sponsors.
CITE SOURCE OF DATA AS: Vivvix CMAG with analysis by the Wesleyan Media Project.
Examining just the past six weeks (Figure 2), we see that while pro-Biden airings have increased from 2020, the number of pro-Trump airings is down. Considerably more pro-Biden ads have appeared on television during the general election in 2024 than pro-Trump ads (and the pro-Biden airings this cycle are comparable in number to what was airing by or on behalf of Trump in 2020).
Figure 2. Volume of General Election Presidential Ad Airings by Party and Year (April 8 to May 19)
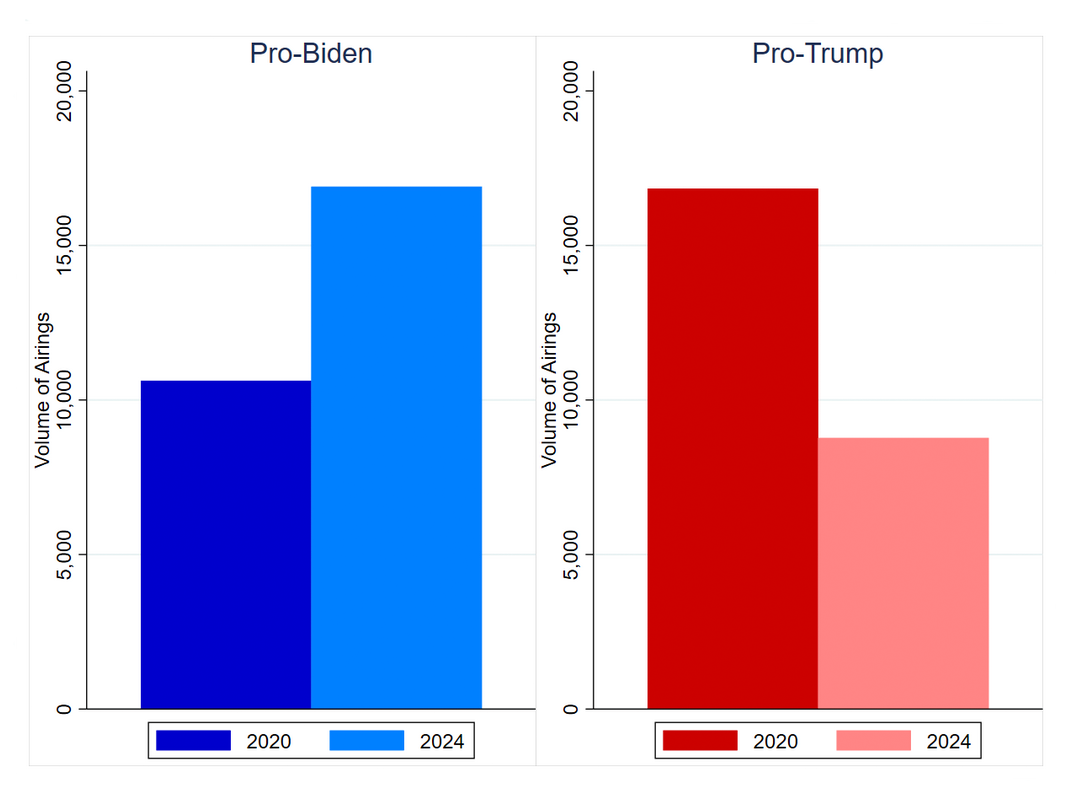
Figures are from April 8 to May 19 of each election year. We use April 8 rather than March 6 here because it was the date in 2020 when Biden effectively secured the Democratic nomination and therefore the beginning of the general election period in that cycle. Starting April 8 therefore ensures a more equal comparison of the two cycles.
Numbers include broadcast television for all sponsors.
CITE SOURCE OF DATA AS: Vivvix CMAG with analysis by the Wesleyan Media Project.
We also looked at the tone of ads in the presidential campaign during the general election period, and these are broken down by week in Figure 3. Neither pro-Biden nor pro-Trump sponsors have invested any significant spending on purely promotional ads. However, there are clear differences between the parties. Biden and his allies have devoted the vast majority of their ad spending to contrasts between him and Donald Trump. Pro-Trump allies, in contrast, have spent proportionately more on direct attacks on Biden, with contrast spots more frequent only in the last week of the data.
“The fact that nearly every ad so far in the presidential rematch between Biden and Trump contains an attack is not a surprise,” said Erika Franklin Fowler, co-director of the Wesleyan Media Project. “The American public is well acquainted with both candidates, and so neither campaign is spending time on the typical biographical spot that would typically be aired after securing the nomination. However, the fact that Biden and Trump are using different types of negativity is interesting and will be something to watch.”
Figure 3. Tone of General Election Presidential Ad Airings by Party and Year (March 6 to May 19)
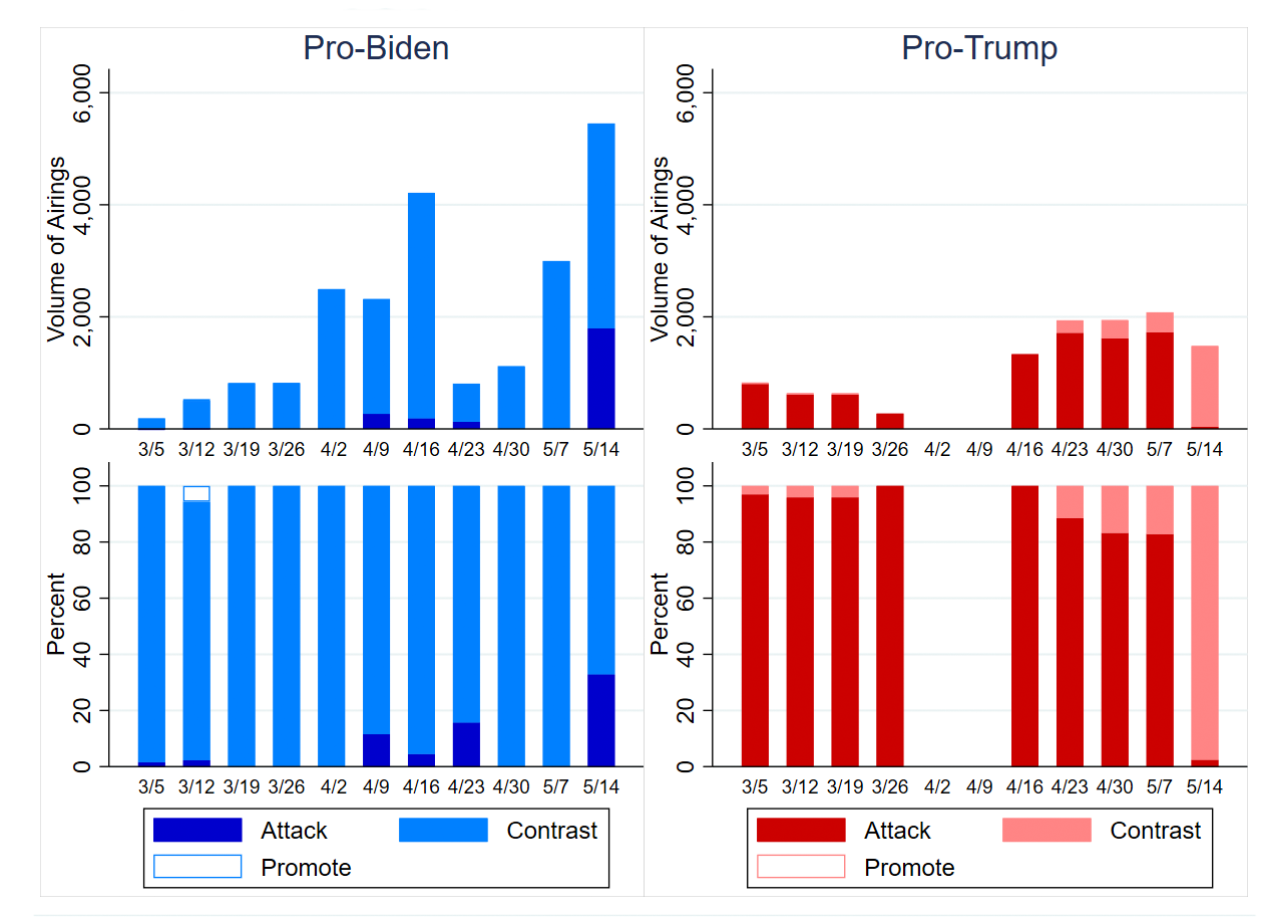
Figures are from March 6 to May 19, 2024.
Numbers include broadcast television for all sponsors.
CITE SOURCE OF DATA AS: Vivvix CMAG with analysis by the Wesleyan Media Project.
Nearly $300 Million in TV Ads for Congressional Races in the Cycle to Date
Turning our attention to the U.S. Senate (Table 3), we see that, across the entire 2023-24 election cycle, about $172 million has been spent on broadcast and national television ads, amounting to almost 340,000 ad airings. There has been greater spending on pro-Democratic than pro-Republican advertising, though that does not necessarily predict greater Democratic spending in the general election, as much of the spending to this point was in competitive intra-party nomination contests, such as in the California top-two primary on March 5, where the Adam Schiff faced off against Katie Porter for the right to advance to the general election. In Maryland, David Trone aired over 30,000 spots in his losing campaign against Angela Alsobrooks (who aired 4,600) to secure the Democratic Party nomination for the open Senate seat.
One important observation, however, is that while candidate-sponsored ads dominated on the Democratic side (82 percent versus 18 percent from outside groups), groups account for over 35 percent of the pro-GOP ad airings. We talk more about group spending in federal races later in this report.
Table 3. Volume and Spending on U.S. Senate Ads (Cycle to Date)
| Candidates | Groups | Parties | Coordinated | Total | |
|---|---|---|---|---|---|
| Pro-Democratic | |||||
| Ads aired | 156,325 | 34,408 | 0 | 0 | 190,733 |
| Est cost (in $Ms) | 72.6 | 26.6 | 0 | 0 | 99.2 |
| % ads aired (row) | 82.0% | 18.0% | 0.0% | 0.0% | |
| Pro- Republican | |||||
| Ads aired | 82,623 | 52,555 | 0 | 12,135 | 147,313 |
| Est cost (in $Ms) | 30.1 | 38.5 | 0 | 3.9 | 72.5 |
| % ads aired (row) | 56.1% | 35.7% | 0.0% | 8.2% | |
| Figures are from January 1, 2023, to May 19, 2024. Numbers include broadcast television for all sponsors. CITE SOURCE OF DATA AS: Vivvix CMAG with analysis by the Wesleyan Media Project. |
|||||
In U.S. House races (Table 4), by contrast, have been more pro-Republican ads (160,000) than pro-Democratic ones (85,000) on broadcast and national television. And in contrast to Senate races, Democrats have been far more reliant than Republicans on outside group spending, with 57 percent of pro-Democratic ads being sponsored by groups. A total of $122 million has been spent on advertising in House races to this point.
Table 4. Volume and Spending on U.S. House Ads (Cycle to Date)
| Candidates | Groups | Parties | Coordinated | Total | |
|---|---|---|---|---|---|
| Pro-Democratic | |||||
| Ads aired | 31,041 | 48,335 | 1,234 | 4,900 | 85,510 |
| Est cost (in $Ms) | 12.2 | 34.9 | 3.0 | 1.3 | 51.5 |
| % ads aired (row) | 36.3% | 56.5% | 1.4% | 5.7% | |
| Pro- Republican | |||||
| Ads aired | 110,200 | 48,260 | 169 | 2,298 | 160,927 |
| Est cost (in $Ms) | 32.5 | 36.3 | 0.4 | 0.8 | 70.1 |
| % ads aired (row) | 68.5% | 30.0% | 0.1% | 1.4% | |
| Figures are from January 1, 2023, to May 19, 2024. Numbers include broadcast television for all sponsors. CITE SOURCE OF DATA AS: Vivvix CMAG with analysis by the Wesleyan Media Project. |
|||||
Figure 4 shows that the volume of ad airings in Senate and House races is approaching 600,000, which is almost on par with the 2021-2022 election cycle to the same point and well above ad volumes in previous election cycles.
“Television advertising remains very attractive to congressional campaigns,” said Michael Franz, co-director of the Wesleyan Media Project. “And although this has been true in the past, the stakes remain high this year, as control of both the House and the Senate could easily flip in 2024.”
Figure 4. Volume of U.S. House and U.S. Senate Ad Airings by Year (Cycle to Date Totals)
Figures are from January 1 of the off-year (with the exception of the 2021-2022 cycle, which starts January 7, due to the Georgia runoff elections) to May 19 of the election year.
Numbers include broadcast television for all sponsors.
CITE SOURCE OF DATA AS: Vivvix CMAG with analysis by the Wesleyan Media Project.
Ohio, California, Maryland Top Spending Senate Races
Table 5 shows the top Senate races by ad spending for the full election cycle. Ohio, California and Maryland top the list, with Montana–a low-population state with cheap advertising–placing fourth. Indeed, in terms of ad airings, Montana’s Senate race sits at the top.
Table 5. Ad Spending in U.S. Senate Races by State (Cycle to Date)
| Est. Spending (in $Ms) | Ad airings | |
|---|---|---|
| Ohio | 39.2 | 54,836 |
| California | 31.6 | 50,872 |
| Maryland | 28.7 | 40,964 |
| Montana | 22.5 | 95,190 |
| Wisconsin | 9.6 | 19,612 |
| West Virginia | 7.5 | 17,742 |
| Pennsylvania | 6.0 | 9,899 |
| Utah | 4.6 | 8,060 |
| Florida | 4.3 | 2,336 |
| Nevada | 4.1 | 10,703 |
| Michigan | 3.6 | 3,765 |
| Texas | 3.2 | 4,662 |
| Arizona | 3.1 | 5,127 |
| Indiana | 1.8 | 3,235 |
| Mississippi | 1.7 | 9,328 |
| Nebraska | 0.44 | 1,695 |
| Missouri | 0.19 | 13 |
| Vermont | 0.002 | 7 |
| Figures are from January 1, 2023, to May 19, 2024. Numbers include broadcast television for all sponsors. CITE SOURCE OF DATA AS: Vivvix CMAG with analysis by the Wesleyan Media Project. |
||
Table 6 provides more detail on Senate ad sponsors in each state. Almost $40 million has been spent on ads in the Ohio Senate race this election cycle, boosted by heavy spending in the Republican primary. Matt Dolan spent $6.2 million on political ads, while the pro-Dolan Buckeye Leadership Fund spent $4.3 million. Bernie Moreno, who won the Republican nomination, spent $5.2 million. A third Republican, Frank LaRose, was backed by the Leadership for Ohio Fund to the tune of $4.1 million. Incumbent Democrat Sherrod Brown has already spent $7.6 million on ads.
In California, much of the ad spending took place during the top-two primary race, with two U.S. House members, Adam Schiff and Katie Porter, accounting for the bulk of the spending.
Spending in Maryland was dominated by David Trone, who was seeking the Democratic nomination for Senate. In spite of spending over $22 million on ads, Trone (as noted earlier) ended up losing the nomination to Angela Alsobrooks, whose campaign spent around $3 million on ads.
Table 6. Ad Spending by Sponsor in Top U.S. Senate Races (Cycle-to-Date)
| State | Party | Est. Spend (in $Ms) | Ad Airings | |
|---|---|---|---|---|
| Arizona | ||||
| Change For Arizona 2024 PAC | Democrat | 0.03 | 78 | |
| Gallego, Ruben | Democrat | 2.88 | 4773 | |
| Lake, Kari | Republican | 0.01 | 15 | |
| Lake, Kari & NRSC | Republican | 0.14 | 261 | |
| California | ||||
| Early, Eric | Republican | 0.02 | 16 | |
| Fairshake | Democrat | 5.75 | 5664 | |
| Porter, Katie | Democrat | 7.80 | 11765 | |
| Schiff, Adam | Democrat | 13.38 | 25899 | |
| She Speaks for Me | Democrat | 0.76 | 676 | |
| Standing Strong PAC | Democrat | 3.93 | 6852 | |
| Florida | ||||
| Campbell, Stanley | Democrat | 0.01 | 19 | |
| Scott, Rick | Republican | 4.21 | 1906 | |
| VoteVets Action Fund | Democrat | 0.10 | 411 | |
| Indiana | ||||
| Club For Growth Action | Republican | 0.21 | 298 | |
| Defend American Jobs | Republican | 1.46 | 2725 | |
| Rust, John | Republican | 0.10 | 212 | |
| Maryland | ||||
| Alsobrooks, Angela | Democrat | 2.96 | 4624 | |
| Ficker, Robin | Republican | 1.22 | 2318 | |
| Hogan, Larry & NRSC | Republican | 0.86 | 1756 | |
| Trone, David | Democrat | 22.03 | 31156 | |
| Women Vote | Democrat | 1.61 | 1110 | |
| Michigan | ||||
| American Fuel & Petrochemical Manufacturers | Republican | 1.20 | 1493 | |
| GLCF, Inc. | Republican | 1.56 | 1273 | |
| Pensler, Sandy | Republican | 0.83 | 999 | |
| Missouri | ||||
| America Next | Republican | 0.18 | 13 | |
| Mississippi | ||||
| America First Priorities PAC | Republican | 0.01 | 25 | |
| American Chemistry Council | Republican | 0.10 | 183 | |
| Burton, Ghannon | Republican | 0.01 | 41 | |
| Elect Principled Veterans Fund | Republican | 0.18 | 669 | |
| Wicker, Roger | Republican | 1.43 | 8410 | |
| Montana | ||||
| Last Best Place PAC | Democrat | 8.96 | 14914 | |
| Montana Policy Action | Republican | 0.25 | 388 | |
| More Jobs Less Government | Republican | 1.75 | 3258 | |
| One Nation | Republican | 2.79 | 4093 | |
| Sheehy, Tim | Republican | 2.62 | 23137 | |
| Sheehy, Tim & NRSC | Republican | 0.61 | 4973 | |
| Tester, Jon | Democrat | 5.06 | 42992 | |
| Veterans On Duty, Inc. | Republican | 0.48 | 1434 | |
| Nevada | ||||
| American Fuel & Petrochemical Manufacturers | Republican | 0.56 | 773 | |
| Brown, Sam & NRSC | Republican | 0.43 | 1100 | |
| Gunter, Jeff | Republican | 1.02 | 3095 | |
| Rosen, Jacky | Democrat | 1.84 | 5735 | |
| Ohio | ||||
| American Fuel & Petrochemical Manufacturers | Republican | 0.50 | 836 | |
| Brown, Sherrod | Democrat | 7.63 | 13594 | |
| Buckeye Leadership Fund | Republican | 4.28 | 4483 | |
| Buckeye Values PAC | Republican | 0.98 | 896 | |
| Citizens For Sanity | Republican | 0.73 | 488 | |
| Club For Growth Action | Republican | 4.79 | 5129 | |
| Defend Ohio Values PAC | Republican | 1.38 | 1394 | |
| Dolan, Matt | Republican | 6.22 | 10008 | |
| Duty And Country | Democrat | 2.67 | 2857 | |
| Leadership for Ohio Fund | Republican | 4.07 | 3650 | |
| Moreno, Bernie | Republican | 5.22 | 10711 | |
| Save America Fund | Democrat | 0.00 | 2 | |
| Win It Back PAC | Republican | 0.71 | 788 | |
| Pennsylvania | ||||
| Casey, Bob | Democrat | 2.99 | 4462 | |
| Keystone Renewal PAC | Republican | 0.72 | 1392 | |
| McCormick, Dave & NRSC | Republican | 2.27 | 4045 | |
| Texas | 0.00 | |||
| Allred, Colin | Democrat | 3.15 | 4639 | |
| Andrus, Tracy | Democrat | 0.00 | 23 | |
| Utah | ||||
| Conservative Outsider PAC | Republican | 1.30 | 2246 | |
| Conservative Values for Utah | Republican | 1.79 | 2924 | |
| Curtis, John | Republican | 0.31 | 787 | |
| Walton, Jason | Republican | 0.13 | 408 | |
| Wilson, Brad | Republican | 0.70 | 1695 | |
| Wisconsin | ||||
| American Fuel & Petrochemical Manufacturers | Republican | 0.09 | 4 | |
| Baldwin, Tammy | Democrat | 2.70 | 5844 | |
| Fix Washington PAC | Republican | 0.98 | 1278 | |
| Growth Energy | Democrat | 0.00 | 26 | |
| Hovde, Eric | Republican | 3.84 | 10148 | |
| WinSenate | Republican | 1.95 | 2312 | |
| West Virginia | ||||
| Blankenship, Don | Democrat | 0.18 | 800 | |
| Club For Growth Action | Republican | 0.91 | 1603 | |
| Conservative Americans PAC | Republican | 0.60 | 993 | |
| Defend American Jobs | Republican | 1.92 | 2732 | |
| Duty And Honor | Democrat | 0.88 | 1818 | |
| Justice, Jim | Republican | 0.56 | 3234 | |
| Mooney, Alex | Republican | 0.79 | 3781 | |
| One Nation | Republican | 1.18 | 2022 | |
| Protect West Virginia Values | Republican | 0.47 | 759 | |
| Figures are from January 1, 2023, to May 19, 2024. Numbers include broadcast television for all sponsors. CITE SOURCE OF DATA AS: Vivvix CMAG with analysis by the Wesleyan Media Project. |
||||
Top Groups Include Mix of Types
In collaboration with OpenSecrets, we examined the top 20 groups active in the cycle-to-date, with a focus on their classification by type and donor transparency (Table 7). We show these in Table 7. All told, these 20 groups account for 195,000 spots and $219 million. The top 3 groups were ones active in the presidential race, including SFA Fund (which backed Nikki Haley) and Never Back Down (which supported Ron DeSantis). Of these top 20 groups, twelve were identified as Super PACs, four were so-called Carey PACs (that separately maintain a Super PAC fund and a traditional PAC account), and four were 501c non-profit groups.
Super PACs and Carey PACs are generally fully transparent about their donors, but OpenSecrets labels a group as partially transparent if it also reports accepting significant donations from 501c (or other non-transparent) groups. This applies to two groups on the list, Best of America PAC and House Majority PAC. The former received $3 million from an LLC called Farrington Rocket, and the latter accepted millions of dollars from its own affiliated non-profit, House Majority Forward. One other group, Last Best Place PAC, was labeled as non-disclosing despite being a super PAC because it received all of its funding from House Majority Forward.
Table 7. Top 20 Groups in Federal Elections (Cycle-to-Date)
| Sponsor | First on air | Last airing (as of 5/19) | Ads aired | Est. Cost (in $Ms) | Airings in Pres. race | Airings in Sen. races | Airings in Hou. races | Disclose Donors to FEC? | Group type |
|---|---|---|---|---|---|---|---|---|---|
| Make America Great Again Inc. | 3/31/23 | 5/19/24 | 26919 | 40.7 | 26919 | 0 | 0 | Yes | SuperPAC |
| SFA Fund, Inc. | 8/1/23 | 2/24/24 | 25375 | 38.1 | 25375 | 0 | 0 | Yes | Carey |
| Never Back Down | 4/16/23 | 12/11/23 | 20578 | 34.6 | 20578 | 0 | 0 | Yes | SuperPAC |
| Club For Growth Action* | 1/15/23 | 5/19/24 | 15174 | 10.1 | 0 | 7030 | 3583 | Yes | SuperPAC |
| Last Best Place PAC | 9/12/23 | 5/19/24 | 14914 | 7.6 | 0 | 14914 | 0 | No | SuperPAC |
| Defend American Jobs | 1/22/24 | 5/19/24 | 8114 | 4.4 | 0 | 5457 | 2657 | Yes | SuperPAC |
| Future Forward USA Action & Climate Power | 6/8/23 | 11/16/23 | 7326 | 2.9 | 7326 | 0 | 0 | No | 501c4 |
| American Action Network | 3/4/23 | 5/19/24 | 7325 | 6.5 | 163 | 0 | 7162 | No | 501c4 |
| American Fuel & Petrochemical Manufacturers | 2/12/24 | 5/19/24 | 6986 | 4.9 | 3880 | 3106 | 0 | No | 501c6 |
| Standing Strong PAC | 2/20/24 | 5/19/24 | 6852 | 3.9 | 0 | 6852 | 0 | Yes | SuperPAC |
| Win It Back PAC | 7/11/23 | 5/19/24 | 6375 | 5.5 | 5386 | 788 | 201 | Yes | SuperPAC |
| One Nation | 4/19/23 | 5/3/24 | 6115 | 3.6 | 0 | 6115 | 0 | No | 501c4 |
| Best Of America PAC | 7/26/23 | 11/5/23 | 6011 | 11.9 | 6011 | 0 | 0 | Partial | SuperPAC |
| Fight Right Inc. | 11/23/23 | 1/15/24 | 5934 | 8.0 | 5934 | 0 | 0 | Yes | SuperPAC |
| Fairshake | 9/30/23 | 3/5/24 | 5884 | 5.3 | 0 | 5664 | 220 | Yes | SuperPAC |
| House Majority PAC | 1/23/24 | 3/5/24 | 5513 | 4.8 | 0 | 0 | 5513 | Partial | Carey |
| Trust In the Mission PAC | 6/2/23 | 11/3/23 | 5243 | 6.0 | 5243 | 0 | 0 | Yes | Carey |
| United Democracy Project | 2/6/24 | 5/19/24 | 5103 | 5.4 | 0 | 0 | 5103 | Yes | SuperPAC |
| America Leads Action Inc. | 2/6/24 | 5/19/24 | 5029 | 2.1 | 0 | 0 | 5029 | Yes | SuperPAC |
| Future Forward USA Action | 2/8/23 | 11/12/23 | 4722 | 12.8 | 4722 | 0 | 0 | Partial | Carey |
| Figures are from January 1, 2023, to May 19, 2024. Numbers include broadcast television for all sponsors. CITE SOURCE OF DATA AS: Vivvix CMAG with analysis by the Wesleyan Media Project. Group classifications provided by OpenSecrets. *Some Club for Growth ads in the total column include ads in gubernatorial races. No other group in this table aired ads in gubernatorial races to-date. |
|||||||||
Immigration Sits Atop Republican Issue Agenda
The issue agenda in the presidential race is quite different across parties. Table 8 shows the top five issues mentioned by the Biden campaign in its advertising and the top five issues mentioned by MAGA, Inc., the Trump-supporting super PAC, since March 5. Recall that the Trump campaign has not aired any television ads since that time. Biden remains focused on traditional Democratic-owned issues, such as abortion, prescription drugs, women’s rights and healthcare. Ads from MAGA, Inc., by contrast are focusing primarily on immigration and public safety, with some discussion of inflation, the energy/environment and the economy.
Table 8. Top Issues in Presidential Race (General Election)
| Biden | MAGA, Inc | ||
|---|---|---|---|
| Abortion | 67.5% | Immigration | 84.1% |
| Prescription Drugs | 55.9% | Public Safety | 73.0% |
| Women's Rights | 46.3% | Inflation | 26.7% |
| Healthcare | 41.5% | Energy/Environment | 26.7% |
| Senior Issues | 27.3% | Economy | 26.7% |
| Figures are from March 6 to May 19, 2024. Numbers include broadcast and national cable television for the Biden campaign and Make American Great Again, Inc. only. CITE SOURCE OF DATA AS: Vivvix CMAG with analysis by the Wesleyan Media Project. |
|||
In the Senate (Table 9), the issue agenda is much more scattered, with pro-Democratic ads placing the most emphasis on prescription drug coverage, housing and healthcare. Pro-Republican ads have focused on immigration, the budget and public safety.
Table 9. Top Issues in U.S. Senate Races by Party (Cycle-to-Date)
| Pro-Dem Ads | Pro-Rep Ads | ||
|---|---|---|---|
| Prescription Drugs | 35.8% | Immigration | 45.6% |
| Housing | 26.3% | Budget | 24.3% |
| Healthcare | 19.2% | Public Safety | 20.7% |
| Economy | 15.0% | Jobs | 19.7% |
| Jobs | 14.9% | Drugs | 18.7% |
| Drugs | 14.4% | National Defense | 17.7% |
| Energy/Environment | 13.5% | Taxes | 15.7% |
| Inflation | 12.3% | International Affairs | 14.4% |
| Opioids | 12.3% | Prescription Drugs | 12.0% |
| Campaign Finance | 12.1% | China | 11.9% |
| Figures are from January 1, 2023 to May 19, 2024. Numbers include broadcast television for all sponsors. CITE SOURCE OF DATA AS: Vivvix CMAG with analysis by the Wesleyan Media Project. |
|||
While abortion was rarely mentioned in Senate ads, it is the top mentioned issue in pro-Democratic ads in the House (Table 10). That is followed by healthcare and taxes. Pro-Republican ads, meanwhile, have stressed immigration, the budget and public safety.
Table 10. Top Issues in U.S. House Races by Party (Cycle-to-Date)
| Pro-Dem Ads | Pro-Rep Ads | ||
|---|---|---|---|
| Abortion | 42.5% | Immigration | 67.1% |
| Healthcare | 39.2% | Budget | 28.9% |
| Taxes | 20.3% | Public Safety | 28.4% |
| Women's Rights | 18.5% | International Affairs | 17.8% |
| Budget | 18.3% | Drugs | 15.3% |
| Public Safety | 18.1% | Economy | 14.7% |
| Prescription Drugs | 17.9% | Taxes | 13.8% |
| Economy | 14.0% | Inflation | 12.2% |
| Medicare | 12.3% | Gun Control | 8.6% |
| Housing | 12.3% | Jobs | 8.5% |
| Figures are from January 1, 2023 to May 19, 2024. Numbers include broadcast television for all sponsors. CITE SOURCE OF DATA AS: Vivvix CMAG with analysis by the Wesleyan Media Project. |
|||
For more on spending and content on digital advertising, click here.
About the Data
Television ad totals reported here are from Vivvix CMAG (unless otherwise specified) and refer to broadcast television. All cost estimates for television are precisely that: estimates.
About this Report
The Wesleyan Media Project provides real-time tracking and analysis of all political television advertising in an effort to increase transparency in elections. Housed in Wesleyan’s Quantitative Analysis Center – part of the Allbritton Center for the Study of Public Life – the Wesleyan Media Project is the successor to the Wisconsin Advertising Project, which disbanded in 2009. It is directed by Erika Franklin Fowler, professor of government at Wesleyan University, Michael M. Franz, professor of government at Bowdoin College and Travis N. Ridout, professor of political science at Washington State University. WMP personnel include Breeze Floyd (Program Manager), Pavel Oleinikov (Associate Director, QAC), Furkan Cakmak (Post-Doctoral Fellow), Natália de Paula Moreia (Post-Doctoral Fellow) and Meiqing Zhang (Post-Doctoral Fellow).
The Wesleyan Media Project’s real-time tracking in 2024 is supported by Wesleyan University and the John S. and James L. Knight Foundation. The Wesleyan Media Project is partnering again this year with OpenSecrets, to provide added information on outside group disclosure and candidate status.
Periodic releases of data will be posted on the project’s website and dispersed via LinkedIn, Bluesky @wesmediaproject.bsky.social and Twitter @wesmediaproject. To be added to our email update list, click here.
For more information contact: media@wesleyan.edu.
About Wesleyan University
Wesleyan University, in Middletown, Conn., is known for the excellence of its academic and co-curricular programs. With more than 2,900 undergraduates and 200 graduate students, Wesleyan is dedicated to providing a liberal arts education characterized by boldness, rigor and practical idealism. For more, visit www.wesleyan.edu.
About the John S. and James L. Knight Foundation
We are social investors who support democracy by funding free expression and journalism, arts and culture in community, research in areas of media and democracy, and in the success of American cities and towns where the Knight brothers once had newspapers. Learn more at kf.org and follow @knightfdn on social media.