Banner Year for Broadcast Ad Volume in Spite of Increased Digital Ad Spend
(MIDDLETOWN, CT) September 17, 2026 – Over the past month, advertisers have spent more on pro-Republican ads than pro-Democratic ads in nine of the top ten Senate races, with Georgia the only state breaking that trend, as Table 1 shows.
“The political winds may favor Democrats this year, but in almost all of the top Senate races in the last several weeks, Republicans have benefitted from more spending,” said Travis Ridout, co-director of the Wesleyan Media Project. “The one upside for Democrats is that a greater percentage of their spending tends to come from candidates as opposed to groups. This matters because television stations must provide candidates the lowest unit rate to candidate ad sponsors—and now, thanks to a recent Supreme Court decision—candidate spending that is coordinated with parties.”
Atop the list of most expensive races over the past month is Ohio. Almost $100 million has been spent in the state’s Senate race since August 10, far more spending than in any other state, and three quarters of that spending has come from outside groups as opposed to candidates and parties. The contest, between incumbent Republican Jon Husted and former Democratic Senator Sherrod Brown, is extremely close in the polls. Overall, just over $40 million of that spending favored Brown (about 42 percent), while $57 million favored Husted. And yet, the Brown campaign is heavily out-spending the Husted campaign, meaning outside groups on behalf of Husted are having a huge impact on the ad spending balance in that race.
Well behind the Ohio Senate race in spending but clocking in at almost $60 million over the past month is the Texas Senate race between Republican Ken Paxton and Democrat James Talarico. Talarico has spent considerably more on ads than Paxton, whose campaign spent less than half a million over the past month. But groups accounted for the vast majority of spending in Texas, just over two-thirds, and much of that spending benefitted Paxton. Overall, there was about $21 million in spending favoring Talarico versus about $38 million in spending that favored Paxton. Lone Star Liberty PAC, a pro-Paxton Super PAC, has sponsored over $19 million in ads over the last month.
Perhaps even more impressive, given the state’s population of less than 1.5 million, is spending in the Maine Senate race, which has totaled over $50 million in the August 10 to September 13 period. The campaign of Democrat Troy Jackson has outspent the campaign of Republican Susan Collins by a considerable margin: $6.5 million to $2.8 million. But here again, as in Ohio and Texas, almost 80 percent of advertising has come from outside groups. And overall spending benefits the Republican candidate, with $30 million in ads favoring Collins and $20 million favoring Jackson.
In every Senate race in Table 1, except for Arkansas, outside groups have accounted for the majority of ad spending in the last month. In most cases, groups make up 60 percent or more of the spending in the race.
Table 1: Most Expensive Races for U.S. Senate (8/10/26-9/13/26)
(in $Ms) | (in $Ms) | (in $Ms) | (in $Ms) | |||
|---|---|---|---|---|---|---|
| OH | $97.22 | $14.81 | $1.74 | $72.93 | 75 | 41.6 |
| TX | $59.10 | $17.91 | $0.46 | $40.72 | 68.9 | 35.9 |
| ME | $50.95 | $6.47 | $2.77 | $40.20 | 78.9 | 40.5 |
| MI | $47.74 | $9.88 | $0.68 | $31.13 | 65.2 | 45 |
| GA | $43.51 | $18.70 | $1.59 | $23.22 | 53.4 | 58.8 |
| IA | $39.89 | $5.54 | $1.36 | $31.48 | 78.9 | 40.9 |
| NC | $37.78 | $5.83 | $3.20 | $27.88 | 73.8 | 45.7 |
| AK | $25.07 | $3.70 | $0.81 | $19.66 | 78.4 | 38.8 |
| NH | $15.22 | $2.65 | $0.19 | $8.14 | 53.5 | 35.2 |
| SC | $13.59 | $2.19 | $2.29 | $8.68 | 63.9 | 16.5 |
| NE | $8.44 | $2.68 | $5.48 | 64.9 | 13.6** | |
| MA | $6.23 | $2.03 | $0.01 | $4.19 | 67.3 | 99.7 |
| KS | $5.81 | $1.69 | $0.50 | $3.62 | 62.3 | 43.9 |
| FL | $4.98 | $0.86 | $0.01 | $4.12 | 82.7 | 18.2 |
| AR | $2.32 | $0.01 | $1.71 | $0.60 | 25.7 | 0 |
| MN | $1.50 | $0.37 | $0.24 | $0.89 | 59.6 | 79.9 |
| MS | $1.41 | $0.06 | $0.09 | $1.26 | 89.3 | 90.2 |
| Totals include broadcast, local cable, connected TV (CTV), digital (including Meta, Google, Snapchat and X), network cable, radio, satellite, and network broadcast. *Total spending will in some rows be greater than the sum of candidate and group spending, as the total includes any spending on party coordinated ads with candidates. **This percentage is the Democratic percentage of total Democratic and Republican spending. It does not take into account spending on behalf of the independent candidate. CITE SOURCE OF DATA AS: AdImpact with analysis by the Wesleyan Media Project. |
||||||
Figure 1 shows that the number of Senate ads on broadcast television this year is on pace with previous years, and in many weeks exceeded the number in 2022 and 2024. Indeed, there has been a spike in such ads over the past few weeks, with volumes reaching over 60,000 per week. Traditionally, political ads have aired most often on local broadcast stations. While ad sponsors today allocate more dollars to digital platforms (we discuss the breakdown cycle-to-date later in this report), they are not doing so at the expense of local broadcast spot volume.
Figure 1: Volume of Senate Ads on Broadcast Television (2022-2026)
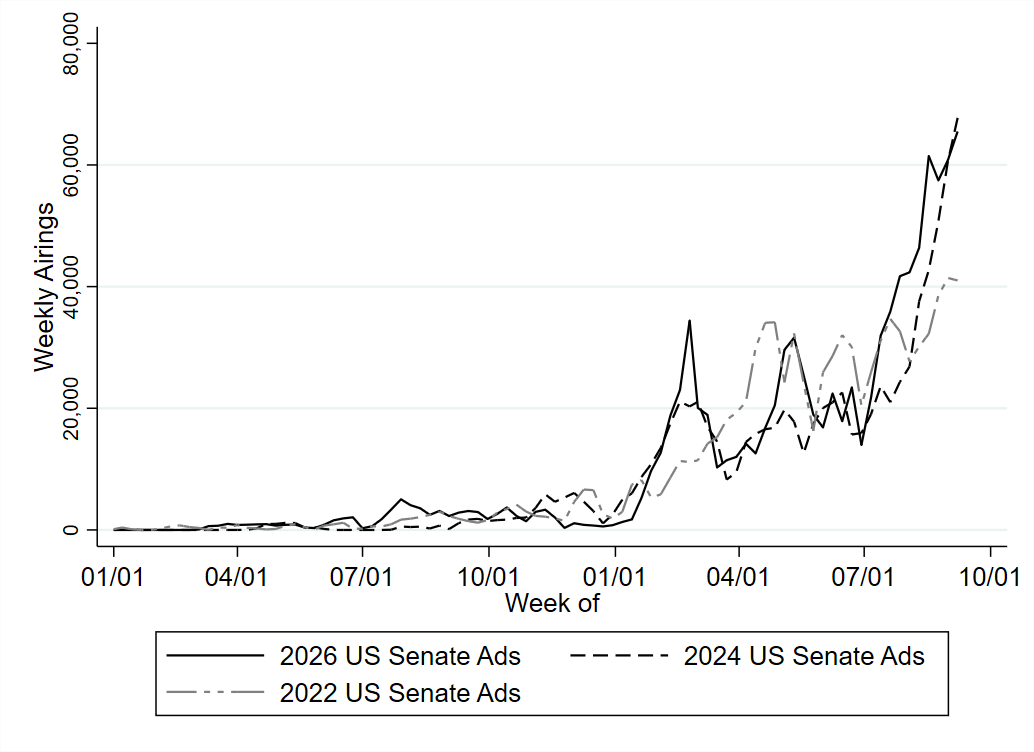
Airings from January 1 of the off-year through September 13 of the election year for each cycle.
CITE SOURCE OF DATA AS: Vivvix/CMAG and AdImpact with analysis by the Wesleyan Media Project
Figure 2 shows spending geographically and allows users to filter by race for different offices, sponsor type, and party. Spending is for the period between August 10 of this year and September 13.
Figure 2: TV Ad Spending by Geography, Sponsor Type, and Party (8/10/26-9/13/26)
Totals include broadcast television spending only.
CITE SOURCE OF DATA AS: AdImpact with analysis by the Wesleyan Media Project.
Record-Breaking House Ad Volumes
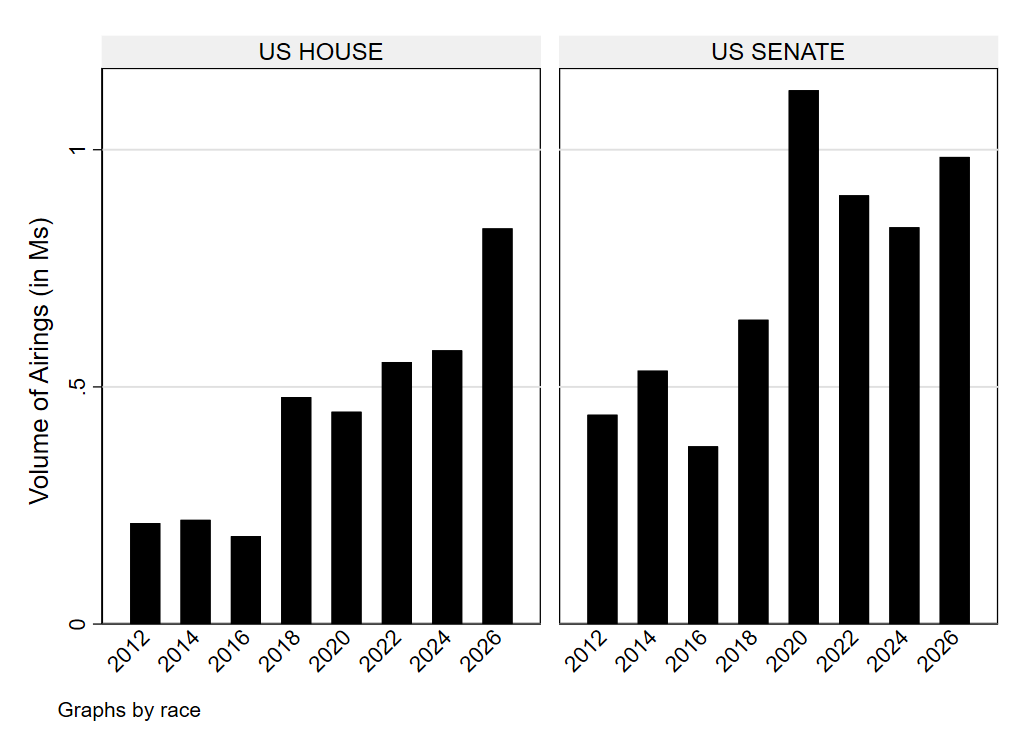
Broadcast ad volumes in House races this year (through September 13) are higher than in any of the previous seven election cycles, as shown by Figure 3. The number of House ads in 2026 is up 44.5 percent over 2024.
Although the volume of broadcast TV ads in the Senate is not record-breaking, it is still higher than every cycle but for 2020, the last time that the same Senate Class II seats were on the ballot.
Figure 3: Volume of Broadcast Television Airings in U.S. House and Senate Races by Cycle
Airings from January 1 of the off-year through September 13 of the election year for each cycle.
CITE SOURCE OF DATA AS: Vivvix/CMAG and AdImpact with analysis by the Wesleyan Media Project.
“2026 is shaping up to be a banner year for volume of broadcast television airings,” said Erika Franklin Fowler, co-director of the Wesleyan Media Project. “U.S. House and gubernatorial airings are at record highs, and Senate advertising is higher than any other year except 2020. The rise of digital advertising options and spending has not slowed the pace of growth in broadcast airings in spite of all predictions. In fact, the total volume of federal advertising in 2026 House and Senate contests is nearly double what it was in 2012, which was a record-pulverizing year at the time.”
Five Gubernatorial Campaigns with More Than $20M in Last Month
As with the Senate races, spending has advantaged Republicans in many of the top races for governor, with pro-Republican spending larger than pro-Democratic spending in 7 of the top 10 races (Table 2). Spending favors Democrats in Iowa, Arizona and Pennsylvania.
Ohio again tops the list of most expensive races. Over $38 million has been spent in that race over roughly the past month. Republican candidate Vivek Ramaswamy’s campaign spent over $11 million in that time frame, while the campaign of Democrat Amy Acton has spent over $5 million. The bulk of spending, $21 million, has come from groups, but overall, three-quarters of ad spending has benefitted Ramaswamy.
The race for governor in Georgia has also been an expensive one, chalking up almost $34 million in spending since August 10, but here candidate money predominates. The campaign of Republican Rick Jackson has spent over $30 million on the campaign versus just $60,000 from the campaign of Democrat Keisha Lance Bottoms. (Bottoms has spent over $3.5 million in ads in coordination with her state leadership committee, Project Battleground.) Almost 90 percent of ad spending in the race has favored the Republican candidate.
The Texas gubernatorial race has also seen more than $30 million in spending, but almost all of that has supported Republican nominee Greg Abbott.
Table 2: Most Expensive Races for Governor (8/10/26-9/13/26)
(in $Ms)* | (in $Ms) | (in $Ms) | (in $Ms) | |||
|---|---|---|---|---|---|---|
| OH | $38.69 | $5.39 | $11.68 | $21.62 | 55.9 | 24.1 |
| GA | $33.88 | $0.06 | $30.14 | $0.03 | 0.1 | 10.8 |
| TX | $30.31 | $2.30 | $27.64 | $0.37 | 1.2 | 7.8 |
| WI | $24.67 | $2.98 | $8.83 | $12.86 | 52.1 | 46.1 |
| FL | $23.85 | $0.86 | $0.26 | $19.02 | 79.7 | 3.6 |
| IA | $16.09 | $8.21 | $7.87 | $0.01 | 0.1 | 51.2 |
| MI | $16.07 | $3.11 | $0.23 | $12.73 | 79.2 | 33 |
| AZ | $10.36 | $0.72 | $0.46 | $0.56 | 5.4 | 88.6 |
| PA | $10.18 | $9.95 | $0.22 | $0.01 | 0.1 | 97.8 |
| OK | $9.17 | $2.83 | $6.34 | 69.1 | 0 | |
| NV | $8.22 | $1.33 | $2.24 | $4.65 | 56.5 | 31.3 |
| OR | $8.08 | $4.64 | $3.44 | $0.00 | 0 | 57.6 |
| NY | $6.46 | $2.66 | $3.22 | $0.58 | 9 | 48.8 |
| MA | $5.72 | $0.32 | $4.37 | $0.32 | 5.6 | 22.1 |
| IL | $5.30 | $5.27 | $0.01 | $0.02 | 0.5 | 99.3 |
| MN | $5.07 | $1.43 | $0.98 | $2.30 | 45.3 | 45.7 |
| KS | $4.70 | $0.10 | $0.00 | $4.59 | 97.7 | 2.4 |
| CT | $3.81 | $0.95 | $2.86 | $0.00 | 0.1 | 25.2 |
| NE | $2.63 | $0.78 | $1.35 | $0.50 | 19.1 | 45.3 |
| RI | $2.26 | $1.55 | $0.00 | $0.69 | 30.4 | 100 |
| WY | $1.64 | $0.38 | $1.26 | 76.6 | 0 | |
| TN | $1.64 | $0.00 | $0.02 | $0.02 | 1 | 6.7** |
| NH | $1.63 | $0.01 | $1.61 | 0 | 0 | |
| AL | $1.09 | $0.66 | $0.43 | $0.00 | 0 | 60.9 |
| Totals include broadcast, local cable, connected TV (CTV), digital (including Meta, Google, Snapchat and X), network cable, radio, satellite, and network broadcast. *Total spending will in some rows be greater than the sum of candidate and group spending, as the total includes any spending on party coordinated ads with candidates. There has been notable coordinated spending in the AZ and GA races. **This percentage is the Democratic percentage of total Democratic and Republican spending. It does not take into account spending on behalf of the independent candidate. CITE SOURCE OF DATA AS: AdImpact with analysis by the Wesleyan Media Project. |
||||||
Gubernatorial Ad Volume Sets Records
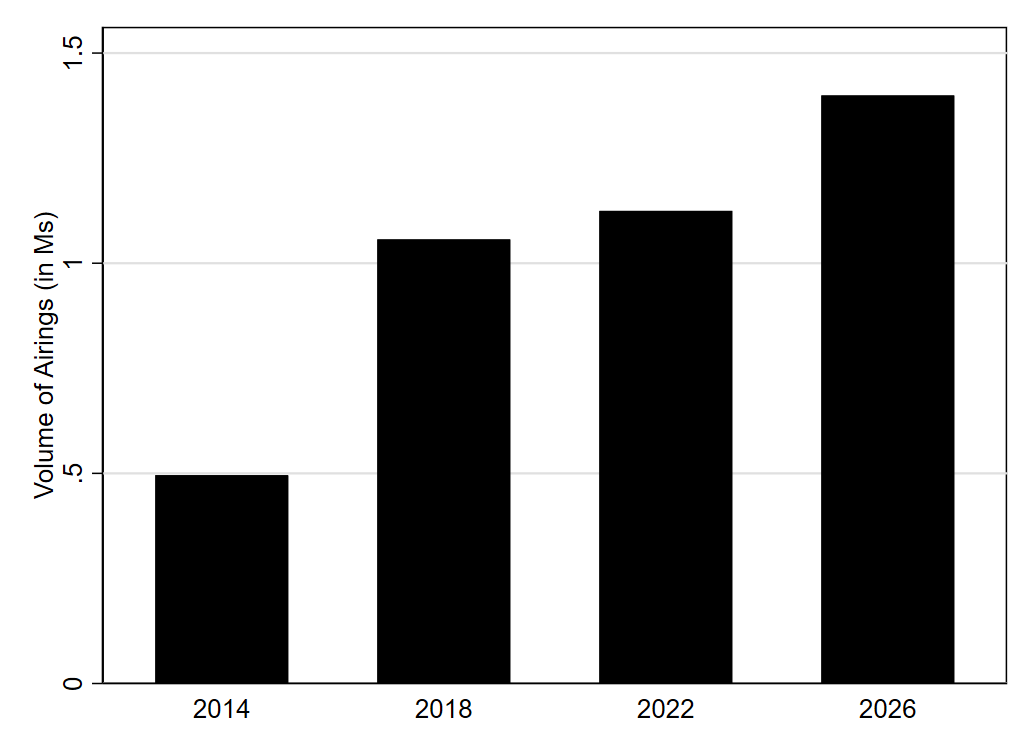
In terms of the volume of ad airings, the races for governor have been the most intense in recent years. Figure 4 compares the number of ad airings on broadcast television in the current year and in each of the previous three years in which the same races were on the ballot (2022, 2018 and 2014). So far, there have been more ads on broadcast television in 2026 than in any of the previous elections—this in spite of the fact that campaigns are allocating a much greater percentage of their ad spending to digital and social media platforms, streaming and CTV (types of ads that do not get included in these totals). Broadcast airings in gubernatorial races are up 24 percent over the 2022 midterm totals.
Figure 4: Volume of Ads in Governor Races over Time
Airings from January 1 of the off-year through September 13 of the election year for each cycle.
CITE SOURCE OF DATA AS: Vivvix/CMAG and AdImpact with analysis by the Wesleyan Media Project.
Iowa House Races Among Most Expensive
In the House, two races in Iowa have been inundated with advertising: Iowa-1 and Iowa-3. In Iowa’s first congressional district, $10.3 million has been spent on advertising in the past month, with about 60 percent benefitting incumbent Mariannette Miller-Meeks and 40 percent favoring Democratic challenger Christina Bohannan. Next door, in Iowa’s 3rd congressional district, $7.6 million has been spent on advertising during the same period, with two-thirds of that favoring Republican incumbent Zach Nunn, who faces a challenge from Democrat Sarah Trone Garriott. Other expensive races are in New Hampshire’s first congressional district, which wrapped up a multi-candidate Democratic primary on September 8, and in New York’s 17th congressional district where Democrat Cait Conley is challenging Republican incumbent Mike Lawler.
In many of these House races, outside groups account for more than half the total ad spending (see Table 3).
Table 3: Most Expensive Races for U.S. House (8/10/26-9/13/26)
(in $Ms)* | (in $Ms) | (in $Ms) | (in $Ms) | |||
|---|---|---|---|---|---|---|
| IA01 | $10.31 | $2.56 | $0.92 | $5.96 | 57.8 | 40.9 |
| NH01 | $9.16 | $1.18 | $0.86 | $7.04 | 76.9 | 89.7 |
| NY17 | $9.03 | $1.74 | $1.21 | $5.85 | 64.8 | 30.5 |
| IA03 | $7.64 | $1.81 | $1.66 | $3.79 | 49.7 | 33.5 |
| PA08 | $7.10 | $2.05 | $0.65 | $3.33 | 46.9 | 43.8 |
| WI03 | $6.93 | $2.74 | $0.97 | $2.49 | 35.9 | 52.9 |
| AZ06 | $6.89 | $1.63 | $1.47 | $3.41 | 49.4 | 42.8 |
| WA03 | $6.34 | $1.78 | $0.04 | $3.79 | 59.7 | 51.9 |
| CA22 | $6.23 | $1.10 | $0.80 | $3.79 | 60.9 | 44.9 |
| TX34 | $5.76 | $0.59 | $0.48 | $4.24 | 73.6 | 49.7 |
| NC01 | $5.50 | $0.96 | $0.03 | $3.71 | 67.5 | 58.4 |
| OH09 | $5.48 | $0.96 | $0.05 | $3.91 | 71.5 | 38.3 |
| NJ07 | $5.44 | $0.46 | $0.36 | $3.46 | 63.5 | 22.9 |
| CO08 | $5.26 | $0.65 | $0.01 | $4.20 | 79.8 | 33.1 |
| VA01 | $4.75 | $0.81 | $0.95 | $2.99 | 63 | 74.2 |
| PA07 | $4.75 | $0.23 | $0.03 | $4.22 | 88.8 | 22.6 |
| NM02 | $4.55 | $1.36 | $0.02 | $2.44 | 53.5 | 45.7 |
| PA10 | $4.47 | $1.01 | $0.61 | $2.67 | 59.6 | 36.9 |
| VA02 | $4.36 | $1.85 | $0.87 | $1.38 | 31.6 | 59.7 |
| TX15 | $4.29 | $1.15 | $1.13 | $2.00 | 46.7 | 35.7 |
| MI04 | $4.28 | $0.30 | $0.23 | $3.51 | 82 | 54.8 |
| TX28 | $4.11 | $0.19 | $0.37 | $3.03 | 73.7 | 40.4 |
| IA02 | $3.71 | $0.68 | $0.36 | $2.67 | 71.8 | 84.4 |
| MA06 | $3.64 | $3.12 | $0.52 | 14.3 | 100 | |
| FL22 | $3.59 | $2.30 | $1.26 | 35.2 | 0 | |
| NY21 | $3.18 | $1.58 | $1.60 | 0 | 49.4 | |
| WI01 | $3.00 | $0.09 | $0.99 | $1.92 | 64 | 3.6 |
| MI07 | $2.94 | $0.07 | $0.69 | $2.01 | 68.5 | 11.5 |
| WY01 | $2.86 | $0.82 | $2.04 | 71.4 | 0 | |
| FL19 | $2.66 | $1.33 | $1.33 | 50 | 0 | |
| NV03 | $2.65 | $0.55 | $0.79 | $1.02 | 38.5 | 45.3 |
| OH07 | $2.63 | $0.39 | $0.62 | $1.42 | 53.9 | 68.2 |
| CO05 | $2.39 | $0.94 | $0.55 | $0.90 | 37.5 | 49 |
| NC11 | $2.26 | $0.66 | $1.42 | 62.8 | 37.8 | |
| PA01 | $2.18 | $0.04 | $1.40 | $0.73 | 33.6 | 19.5 |
| NE02 | $2.06 | $0.93 | $0.22 | $0.56 | 27 | 65.1 |
| FL24 | $2.05 | $0.16 | $1.89 | 92.1 | 100 | |
| OH01 | $2.03 | $0.90 | $0.01 | $0.69 | 34 | 48.1 |
| FL25 | $1.91 | $0.80 | $0.32 | $0.80 | 41.6 | 47.6 |
| AK01 | $1.86 | $0.39 | $0.94 | 50.7 | 1.6 | |
| CA14 | $1.80 | $0.01 | $1.79 | 99.3 | 100 | |
| FL09 | $1.62 | $0.29 | $0.83 | $0.50 | 30.7 | 43 |
| OR05 | $1.34 | $0.06 | $1.27 | 95.3 | 100 | |
| MA01 | $1.21 | $1.06 | 0 | 100 | ||
| FL14 | $1.20 | $0.60 | $0.49 | $0.11 | 9.4 | 49.4 |
| NY19 | $1.20 | $0.58 | $0.07 | $0.55 | 45.6 | 51 |
| CA13 | $1.12 | $0.10 | $0.95 | 84.8 | 1.1 | |
| FL06 | $1.03 | $0.03 | $0.48 | $0.52 | 50.5 | 3.2 |
| FL02 | $1.02 | $0.11 | $0.41 | $0.50 | 48.9 | 11.2 |
| Totals include broadcast, local cable, connected TV (CTV), digital (including Meta, Google, Snapchat and X), network cable, radio, satellite, and network broadcast. *Total spending will in some rows be greater than the sum of candidate and group spending, as the total includes any spending on party coordinated ads with candidates. CITE SOURCE OF DATA AS: AdImpact with analysis by the Wesleyan Media Project. |
||||||
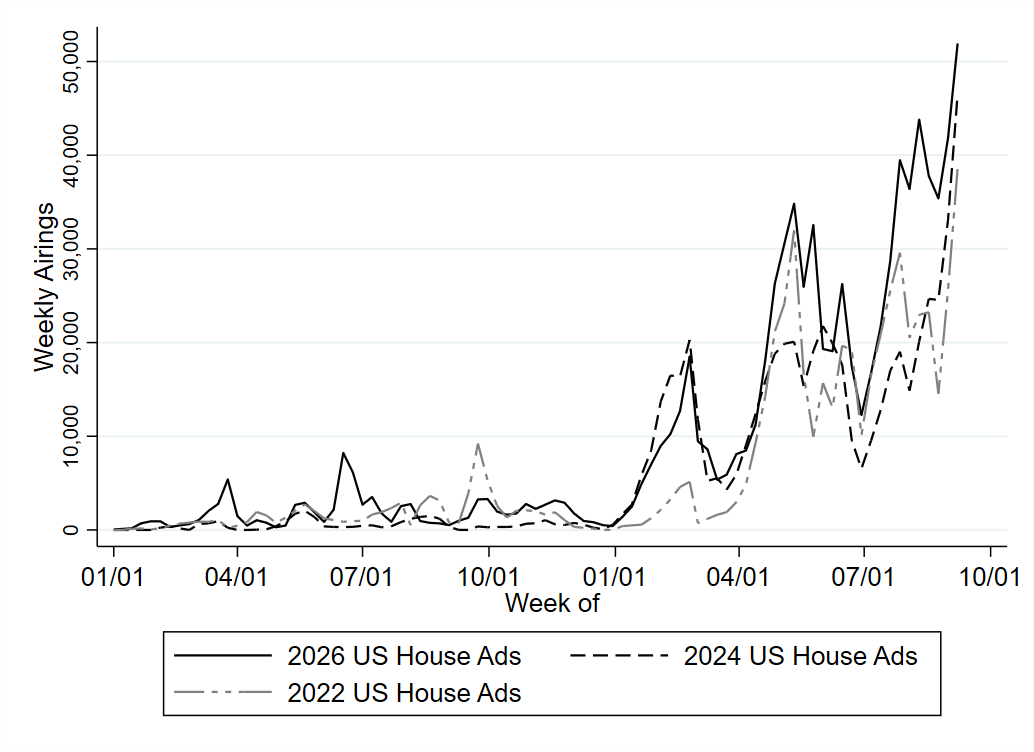
Figure 5 plots the weekly totals for U.S. House races over the past three cycles, showing in particular that television broadcast airings in congressional contests were particularly heavy at multiple points over the past year, matching 2024 activity early on and matching 2022 activity in late spring. Ads were especially numerous in mid-July and August this year, far outpacing ad volumes in 2022 or 2024. In the most recent week, House airings in 2026 totaled nearly 52,000.
Figure 5: Volume of Broadcast TV Airings by Week in U.S. House Races
$4 Billion in Ad spending Cycle-to-Date, with $1 Billion in the Last Month
In our last release, we reported that gubernatorial and congressional ad spending had totaled about $3 billion in the cycle to-date to August 9th. Updated numbers in Table 4 bring that total to nearly $4 billion, meaning that ad spending has accelerated significantly in the last month. About half of the spending in the last month, $500 million, was in Senate races.
Groups continue to heavily out-spend candidates in congressional races, and the percentage of spending on local broadcast has ticked up to 47 percent from 45.5 percent in our last release. About $1 for every $4 on political ads is for ads on streaming platforms and CTV devices.
“This cycle is shaping up to be perhaps the most expensive midterm on record,” said Michael Franz, co-director of the Wesleyan Media Project. “Outside groups have been heavily active throughout the cycle, and we are seeing a slight uptick in coordinated spending in the last month compared to earlier in the cycle. We expect to see more candidate/party coordinated spending in the next 6 weeks, as party committees ramp up their efforts. It’s all hands on deck from now to November 3rd.”
Table 4: Spending by Office, Sponsor Type and Media Channel (1/1/25 to 9/13/26)
| Office | Advertiser Type | Local Broadcast (in $Ms) | CTV (in $Ms) | Digital (in $Ms) | Local Cable (in $Ms) | Other* (in $Ms) | Total (in $Ms) |
|---|---|---|---|---|---|---|---|
| Governor | Candidate | 476.24 | 273.17 | 117.52 | 113.08 | 29.13 | 1009.14 |
| Issue Group | 252.29 | 162.04 | 57.32 | 66.67 | 11.76 | 550.07 | |
| Coordinated | 16.02 | 11.37 | 1.45 | 2.25 | 0.35 | 31.44 | |
| Senate | Candidate | 166.23 | 114.38 | 103.24 | 32.67 | 9.43 | 425.95 |
| Issue Group | 465.25 | 268.17 | 106.87 | 76.68 | 28.39 | 945.36 | |
| Coordinated | 31.74 | 17.3 | 1.84 | 5.07 | 1.72 | 57.68 | |
| House | Candidate | 169.56 | 74.42 | 73.02 | 42.81 | 8.84 | 368.65 |
| Issue Group | 266.04 | 99.79 | 89.75 | 76.98 | 13.17 | 545.73 | |
| Coordinated | 13.47 | 3.66 | 0.12 | 1.22 | 0.23 | 18.7 | |
| Total (in Ms) | $1,856.85 | $1,024.28 | $551.13 | $417.44 | $103.04 | $3,952.72 | |
| % | 47.00% | 25.90% | 13.90% | 10.60% | 2.60% | ||
| Other includes network cable, radio, satellite, and network broadcast CTV includes spending on streaming, CTV devices and in-app ads. Digital includes spending on Meta, Google, Snapchat, and X CITE SOURCE OF DATA AS: AdImpact with analysis by the Wesleyan Media Project. |
|||||||
Super PACs Dominate Outside Group Ads, but Dark Money Groups Very Active Too
Spending from groups in federal and gubernatorial offices has topped $2 billion cycle-to-date, and through partnering with OpenSecrets for group classifications, we found that over half of that spending is coming from Super PACs. These groups have been particularly active in governor races, where they make up over 60 percent of spending. Dark money nonprofit advertisers (otherwise known as 501c organizations) have been particularly active in House and Senate contests, making up more than a third of group-sponsored advertising in each (roughly 36 percent respectively). It is worth noting that many Super PACs also accept significant sums of money from 501c groups, making the total dark money funding ads larger than it may appear in the table.
The totals in Table 5 include ad spending on broadcast television, local cable, connected TV (CTV), digital platforms (including Meta, Google, Snapchat and X), and radio. This makes classifying each ad sponsor more challenging, and about 8 percent of group spending has come from groups OpenSecrets has not yet classified (or possibly cannot verify). Despite that, these classifications account for 92 percent of over $2 billion in ad spending.
Table 5: Breakdown of Outside Group Spending by Type (1/1/25-9/13/26)
| 501c | 12.6% | 36.3% | 35.9% | 29.8% |
| 527 | 4.9% | 0.7% | 0.0% | 1.7% |
| PAC | 9.1% | 1.2% | 1.4% | 3.4% |
| Super PAC | 60.2% | 49.9% | 40.9% | 50.4% |
| Carey | 0.3% | 7.2% | 9.9% | 6.0% |
| Not coded yet | 0.0% | 0.8% | 0.0% | 0.4% |
| Unknown/more work needed | 12.8% | 3.9% | 11.9% | 8.4% |
| Total (in Ms) | $550.03 | $945.68 | $532.85 | $2,028.55 |
| Totals include broadcast, local cable, connected TV (CTV), digital (including Meta, Google, Snapchat and X), network cable, radio, satellite, and network broadcast. Group classifications performed by OpenSecrets. CITE SOURCE OF DATA AS: AdImpact with analysis by the Wesleyan Media Project and OpenSecrets. |
||||
About the Data
Advertising spending data reported here for 2025-2026 come from AdImpact with analysis by the Wesleyan Media Project. All cost estimates for ad spending by medium use AdImpact’s methodology.
The CTV category includes ads distributed over devices where an input is connected to a television (e.g., Apple TV, PlayStation, etc), streaming via set-top-boxes, including video on demand (e.g., Dish or XFINITY streaming) and in apps available on smart TVs (e.g., YouTube or the Hulu app, etc).
Advertising historical airings data reported here come from original Wesleyan Media Project analysis of Vivvix/CMAG data for the 2012-2024 cycles and AdImpact for the current cycle.
About this Report
The Wesleyan Media Project provides real-time tracking and analysis of all political television advertising in an effort to increase transparency in elections. Housed in Wesleyan’s Hazel Quantitative Analysis Center – part of the Allbritton Center for the Study of Public Life – the Wesleyan Media Project is the successor to the Wisconsin Advertising Project, which disbanded in 2009. It is directed by Erika Franklin Fowler, professor of government at Wesleyan University, Michael M. Franz, professor of government at Bowdoin College and Travis N. Ridout, professor of political science at Washington State University. WMP personnel include Breeze Floyd (Program Manager), Pavel Oleinikov (Associate Director, QAC) and Donny Snyder (Post-Doctoral Fellow).
The Wesleyan Media Project’s real-time tracking in 2026 is supported by Wesleyan University and the John S. and James L. Knight Foundation. The Wesleyan Media Project is partnering again this year with OpenSecrets, to provide added information on outside group disclosure and candidate status.
The Wesleyan Media Project’s digital advertising tracking is supported by the contributions of students in Delta Lab, an interdisciplinary research collaborative focusing on computationally-driven and innovative analyses and visualizations of media messaging. We are also grateful to our Coding Supervisors Saul Ferholt-Kahn and Helen Xie, and the numerous student research assistants who facilitate additional content analysis of television and digital advertising.
Periodic releases of data will be posted on the project’s website and dispersed via LinkedIn, Bluesky @wesmediaproject.bsky.social and Twitter @wesmediaproject. To be added to our email update list, click here.
For more information contact: media@wesleyan.edu.
About Wesleyan University
Wesleyan University, in Middletown, Conn., is known for the excellence of its academic and co-curricular programs. With more than 2,900 undergraduates and 200 graduate students, Wesleyan is dedicated to providing a liberal arts education characterized by boldness, rigor and practical idealism. For more, visit www.wesleyan.edu.
About the John S. and James L. Knight Foundation
We are social investors who support democracy by funding free expression and journalism, arts and culture in community, research in areas of media and democracy, and in the success of American cities and towns where the Knight brothers once had newspapers. Learn more at kf.org and follow @knightfdn on social media.