Ad Spending Tops $1 Billion, Yet Ad Volume is Down From the Last Midterm Election
Over 600,000 Ads Sponsored by Groups; Almost 40 Percent Dark Money
(MIDDLETOWN, CT) October 29, 2014 – Spending on television ads in federal and gubernatorial races in the 2013-14 election cycle has now topped $1 billion, with an estimated $1.19 billion spent from January 1, 2013 to October 23, 2014 (Table 1). That spending paid for over 2.2 million ad airings.
Including other races into the totals—other statewide offices, state representatives, ballot measures and local offices—raises airings to 2.96 million at an estimated cost of $1.67 billion.
Table 1: Ad Spending & Airings
| Race Type | Est. Cost $ | Airings |
|---|---|---|
| Governor | 529.6 M | 861,699 |
| US House | 234.5 M | 481,307 |
| US Senate | 423 M | 878,873 |
| Federal and Governor Total | 1,187 M | 2,221,879 |
| Ballot Measures | 155.5 M | 191,940 |
| Mayor | 76.1 M | 83,367 |
| Attorney General | 56 M | 88,916 |
| State Senate | 42.7 M | 94,187 |
| Lt. Governor | 33.2 M | 51,574 |
| Comptroller | 18.2 M | 16,404 |
| State Rep. | 16.4 M | 39,972 |
| State Sup. Court | 8.9 M | 22,643 |
| Other | 83.6 M | 158,488 |
| Grand Total | 1,675 M | 2,969,370 |
| Figures are from January 1, 2013 to October 23, 2014. Numbers include broadcast television. CITE SOURCE OF DATA AS: Kantar Media/CMAG with analysis by the Wesleyan Media Project. |
||
The volume of advertising in House, Senate and gubernatorial races is down slightly from the previous midterm election cycle, when 2,433,017 ads aired (January 1, 2009 through Oct. 23, 2010) at a cost of $1.189 billion.
Table 2 breaks down airings by party since September 1. In both races for the House and Senate, Democrats aired more ads overall this cycle. The Democratic advantage in Senate races is about 30,000 ads, while it is almost 55,000 ads in House races. Republicans hold an advantage of almost 28,000 ads in races for governor.
Compared to the last midterm election in 2010, the volume of advertising is down about 12 percent overall for the comparable time period (September 1 to October 23). Advertising in House races is down most significantly, 27 percent for Democratic ads and 37 percent for Republican spots. “The decline in House ads is consistent with the scope of the battleground this cycle,” said Michael Franz, co-director of the Wesleyan Media Project. “No one expects control of the House to be much in doubt. The clear struggle for control is in Senate races.” In Senate races, pro-Democratic ads are up over 37 percent compared to 2010. Republican Senate ads are down just slightly, by 7 percent.
Table 2: Ad Totals by Race Type and Sponsorship
| 2010 Midterms | |||||||||||
| Pro-Democratic Advertising | |||||||||||
| Cand. | Party | Coord. | Group | Total | |||||||
| Governor | 164,517 | 43,261 | 0 | 28,012 | 235,790 | ||||||
| US House | 183,141 | 38,073 | 5,219 | 15,770 | 242,203 | ||||||
| US Senate | 115,098 | 23,288 | 5,173 | 9,254 | 152,813 | ||||||
| Pro-Republican Advertising | |||||||||||
| Cand. | Party | Coord. | Group | Total | |||||||
| Governor | 202,567 | 25,881 | 1,205 | 34,191 | 263,844 | ||||||
| US House | 90,905 | 41,621 | 12,784 | 44,997 | 190,307 | ||||||
| US Senate | 123,526 | 15,680 | 19,198 | 46,222 | 204,626 | ||||||
| 2014 Midterms | |||||||||||
| Pro-Democratic Advertising | |||||||||||
Cand.| Party | Coord. | Group | Total | % Change |
| | |||||
| Governor | 118,702 | 41,563 | 0 | 45,570 | 205,835 | -12.7% | |||||
| US House | 102,625 | 43,982 | 9,408 | 19,012 | 175,027 | -27.74% | |||||
| US Senate | 116,700 | 40,574 | 7,602 | 44,848 | 209,724 | 37.24% | |||||
| Pro-Republican Advertising | |||||||||||
Cand.| Party | Coord. | Group | Total | % Change |
| | |||||
| Governor | 141,867 | 54,170 | 704 | 36,920 | 233,661 | -11.44% | |||||
| US House | 62,702 | 38,108 | 5,696 | 14,103 | 120,609 | -36.62% | |||||
| US Senate | 90,352 | 18,667 | 13,039 | 68,005 | 190,063 | -7.12% | |||||
| Figures are from September 1, 2014, to October 23, 2014 and from September 1, 2010, to October 23, 2010. Numbers include broadcast television. CITE SOURCE OF DATA AS: Kantar Media/CMAG with analysis by the Wesleyan Media Project. | |||||||||||
|---|---|---|---|---|---|---|---|---|---|---|---|
North Carolina Senate Race Most Intense, Expensive
Table 3 shows the volume of advertising and estimated spending in the most competitive Senate races over the last two weeks. Topping the list is North Carolina, where television stations have aired over 20,000 ads during that time period. Ads supporting Democrat Kay Hagen outnumbered ads supporting Thom Tillis by about 4,000. Iowa had the second most intense Senate race in the past two weeks with over 17,000 ads aired. Ads favoring Republican Joni Ernst outnumbered ads favoring Democrat Bruce Braley by about 1,700.
Republicans continue to be helped by outside groups more than Democrats. In almost all races, a greater share of pro-Republican advertising than pro-Democratic advertising came from outside groups.
Table 3: Ad Volume and Spending in Top Senate Races (Past Two Weeks)
| State | Total Ads | Pro-Dem Ads | Pro-GOP Ads | Dem % Group | GOP % Group | Pro-Dem $s | Pro-GOP $s |
|---|---|---|---|---|---|---|---|
| NC | 20,389 | 12,178 | 8,211 | 30.2% | 36.3% | 7.4 M | 6.3 M |
| IA | 17,416 | 7,835 | 9,581 | 34% | 51.2% | 2.8 M | 3.7 M |
| CO | 12,211 | 6,390 | 5,821 | 25.9% | 49.6% | 4.6 M | 4.4 M |
| GA | 10,713 | 5,976 | 4,737 | 6.6% | 47.8% | 3.2 M | 3.7 M |
| LA | 10,354 | 5,976 | 4,378 | 7.6% | 27.8% | 2.3 M | 2.4 M |
| KY | 10,302 | 4,142 | 6,160 | 4.6% | 26.4% | 1.8 M | 3.6 M |
| AR | 8,767 | 4,336 | 4,431 | 18.2% | 48.3% | 1.9 M | 2.2 M |
| KS* | 8,184 | 3,981 | 4,203 | 57.7% | 67.6% | 1.8 M | 2.8 M |
| AK | 7,283 | 3,638 | 3,645 | 25.4% | 37.1% | 0.5 M | 0.6 M |
| SD** | 6,078 | 3,650 | 1,737 | 64.4% | 19% | 0.9 M | 0.4 M |
| NH | 5,251 | 2,665 | 2,586 | 23.3% | 56.5% | 2 M | 2.2 M |
| VA | 5,192 | 3,691 | 1,501 | 0.9% | 0% | 2.5 M | 1.2 M |
| MI | 4,190 | 3,503 | 687 | 11.2% | 24% | 2.4 M | 0.6 M |
| OR | 2,922 | 2,199 | 723 | 0% | 0% | 0.8 M | 0.2 M |
| NM | 2,886 | 2,042 | 844 | 0% | 0% | 0.6 M | 0.2 M |
| Figures are from October 10-23, 2014. Numbers include broadcast television. Numbers for independent candidate, Greg Orman, are reported in the Democratic columns. **South Dakota independent Larry Pressler aired 656 ads at an estimated cost of $158K. CITE SOURCE OF DATA AS: Kantar Media/CMAG with analysis by the Wesleyan Media Project. |
|||||||
The most expensive race so far in the 2013-14 election cycle was in North Carolina, where an estimated $62 million has been spent on advertising. This is followed by Georgia, Colorado, Kentucky and Michigan. Although the bulk of the spending is for general election races, some of the ad spending in each of these states was used for primary contests.
Table 4: Most Expensive Senate Races This Cycle
| State | Est. Cost (in millions) | Airings |
|---|---|---|
| NC | 62.4 | 96,169 |
| GA | 43 | 61,405 |
| CO | 37.8 | 55,710 |
| KY | 33.6 | 76,420 |
| MI | 32.6 | 50,801 |
| IA | 29.4 | 82,528 |
| LA | 27.9 | 66,698 |
| AR | 27.1 | 57,797 |
| VA | 13.2 | 19,616 |
| MA | 11.2 | 12,357 |
| NH | 11 | 16,335 |
| MN | 9.3 | 18,672 |
| KS | 9.2 | 23,069 |
| MS | 8.5 | 24,246 |
| IL | 7.8 | 4,540 |
| Figures are from January 1, 2013, to October 23, 2014. Numbers include broadcast television. CITE SOURCE OF DATA AS: Kantar Media/CMAG with analysis by the Wesleyan Media Project. |
||
Table 5 shows the most intense House races over the past two weeks. Georgia-12 tops the list, with the most ads aired, and is followed by Florida-02, Arizona-02, California-07 and WV-03.
Table 5: Ad Volume and Spending in Top House Races (Past Two Weeks)
| District | Total Ads | Pro-Dem Ads | Pro-GOP Ads | Dem % Group | GOP % Group | Pro-Dem $s (in millions) | Pro-GOP $s (in millions) |
|---|---|---|---|---|---|---|---|
| GA-12 | 7,322 | 4,515 | 2,807 | 16.5% | 31.7% | 1.5 | 1 |
| FL-02 | 7,320 | 4,122 | 3,198 | 5.5% | 20% | 0.9 | 1 |
| AZ-02 | 5,281 | 2,471 | 2,810 | 12.5% | 38.6% | 0.8 | 1.5 |
| CA-07 | 4,288 | 2,189 | 2,099 | 23.7% | 39.8% | 1.6 | 1.7 |
| WV-03 | 3,829 | 2,005 | 1,824 | 19.4% | 0% | 0.5 | 0.4 |
| AZ-01 | 3,815 | 2,337 | 1,478 | 45.4% | 50.3% | 2.6 | 2 |
| IA-03 | 3,668 | 2,329 | 1,339 | 23.6% | 9% | 0.8 | 0.5 |
| IL-12 | 3,512 | 2,283 | 1,229 | 12% | 0% | 1.1 | 0.7 |
| MN-08 | 3,489 | 2,264 | 1,225 | 5.5% | 19.7% | 1.1 | 0.9 |
| CA-52 | 3,318 | 1,830 | 1,488 | 40.7% | 38.1% | 1.5 | 1.3 |
| Figures are from October 10-23, 2014. Numbers include broadcast television. CITE SOURCE OF DATA AS: Kantar Media/CMAG with analysis by the Wesleyan Media Project. |
|||||||
Table 6 reports the same information for gubernatorial races. There was a striking imbalance in the volume of Republican and Democratic advertising in a few states. Pro-Republican advertising was much more common in Florida and Texas than was pro-Democratic advertising, while in New York, pro-Democratic ads outnumbered pro-Republican ads by an 18 to 1 margin.
Table 6: Ad Volume and Spending in Top Gubernatorial Races (Past Two Weeks)
| District | Total Ads | Pro-Dem Ads | Pro-GOP Ads | Dem % Group | GOP % Group | Pro-Dem $s (in millions) | Pro-GOP $s (in millions) |
|---|---|---|---|---|---|---|---|
| FL | 26,679 | 9,200 | 17,479 | 10.3% | 0.4% | 6.4 | 10.2 |
| TX | 15,000 | 4,393 | 10,607 | 0% | 0% | 2.5 | 5.6 |
| WI | 13,261 | 7,769 | 5,492 | 39.3% | 29.9% | 2.7 | 2.5 |
| IL | 11,495 | 5,619 | 5,876 | 0% | 0% | 6 | 6 |
| MI | 11,005 | 5,100 | 5,905 | 59.4% | 26.2% | 2.7 | 4.3 |
| GA | 6,711 | 4,123 | 2,582 | 0% | 38.3% | 2.3 | 1.7 |
| NY | 6,705 | 6,351 | 354 | 0% | 100% | 4.3 | 0.2 |
| KS | 6,313 | 3,223 | 3,090 | 43.9% | 56.1% | 1.5 | 1.2 |
| ID | 4,667 | 2,625 | 2,042 | 0% | 14.9% | 0.4 | 0.4 |
| PA | 4,583 | 2,285 | 2,298 | 0% | 1.5% | 2.2 | 1.7 |
| ME | 4,530 | 2,510 | 1,801 | 40.7% | 38.7% | 0.8 | 0.5 |
| CO | 4,070 | 2,928 | 1,142 | 56.2% | 49.9% | 2.1 | 0.7 |
| MA | 3,484 | 1,671 | 1,604 | 54.4% | 42.1% | 2.3 | 2 |
| AZ | 3,349 | 1,157 | 2,192 | 35.8% | 44.6% | 1 | 1.6 |
| CT | 3250 | 1,287 | 1,963 | 45.9% | 43.9% | 1.5 | 2.6 |
| Figures are from October 10-23, 2014. Numbers include broadcast television. CITE SOURCE OF DATA AS: Kantar Media/CMAG with analysis by the Wesleyan Media Project. |
|||||||
Table 7 shows the most expensive gubernatorial races this cycle. Florida heads the list, with an estimated $77 million spent to air over 137,000 ads. Florida is followed by Illinois, Pennsylvania, Texas and Michigan.
Table 7: Most Expensive Gubernatorial Races This Cycle
| State | Est. Cost (in millions) | Airings |
|---|---|---|
| FL | 77.7 | 137,221 |
| IL | 68.1 | 62,431 |
| PA | 53.7 | 64,079 |
| TX | 32.8 | 57,183 |
| MI | 27.8 | 45,586 |
| VA | 26.9 | 60,802 |
| NJ | 23.5 | 11,782 |
| NY | 22.9 | 34,778 |
| MD | 21.5 | 21,099 |
| WI | 17.2 | 49,025 |
| AZ | 16.6 | 23,075 |
| GA | 15.8 | 23,491 |
| CT | 15.2 | 14,548 |
| MA | 13 | 10,827 |
| KS | 9.7 | 25,444 |
| Figures are from January 1, 2013, to October 23, 2014. Numbers include broadcast television. CITE SOURCE OF DATA AS: Kantar Media/CMAG with analysis by the Wesleyan Media Project. |
||
Denver, Little Rock Most Inundated by Ads
Table 8 reports the volume and estimated cost of advertising that has aired in the top media markets this election cycle (inclusive of all political ads). In Denver, over 78,000 ads have aired at an estimated cost of $77 million. Little Rock, Arkansas, has seen over 50,000 ads this cycle, as has Tampa, Florida.
Table 8: Top Media Markets by Ad Volume (All Races)
| Market | Airings | Est. Cost (in millions) |
|---|---|---|
| Denver, CO | 78,386 | 77.6 |
| Little Rock, AR | 51,758 | 25.4 |
| Tampa-St. Pete, FL | 50,826 | 34.7 |
| New York, NY | 47,357 | 113.9 |
| Grand Rapids, MI | 44,874 | 18.1 |
| Phoenix, AZ | 43,123 | 40 |
| Colorado Springs, CO | 41,105 | 11.3 |
| Des Moines, IA | 40,892 | 16.2 |
| Cedar Rapids, IA | 40,338 | 10.4 |
| Washington, DC | 40,091 | 68.1 |
| Anchorage, AK | 39,481 | 8.6 |
| Boston, MA | 37,271 | 46.6 |
| Philadelphia, PA | 36,342 | 57.1 |
| Detroit, MI | 35,966 | 44.5 |
| Ft. Smith-Fayetteville, AR | 35,606 | 13.2 |
| Figures are from January 1, 2013, to October 23, 2014. Numbers include broadcast television. CITE SOURCE OF DATA AS: Kantar Media/CMAG with analysis by the Wesleyan Media Project. |
||
Just 26 Percent of Senate Ads Positive
Table 9 reports the percentage of ads classified as positive, negative and contrast (mentioning both a preferred candidate and an opponent) in the 2010, 2012 and 2014 election cycles for the September 1-October 23 period. Just 26 percent of ads aired since September 1 in Senate races were positive, with another 52 percent being purely negative. House and gubernatorial races were comparatively more positive during that same time period. Thirty-one percent of ads aired in House races were positive, and 35 percent of ads aired in gubernatorial races were positive.
![]()
“Since 2000, the percentage of negativity has been rising in each election cycle, but it seems we may have finally reached a plateau,” said Erika Franklin Fowler, co-director of the Wesleyan Media Project. “Negativity this cycle has been comparable to past levels. Gubernatorial ads are more negative this year than they have been previously, but House ads are less negative. Senate ads are slightly more negative than 2010 but less negative than 2012. Any way you count them, however, attack ads continue to dominate the airwaves.”
![]()
Table 9: Tone of Advertising over Time by Race Type (9/1-10/23)
| Negative | Contrast | Positive | ||
|---|---|---|---|---|
| 2010 | Governor | 43.3% | 20.3% | 36.5% |
| US House | 56.5% | 21.7% | 21.8% | |
| US Senate | 50.9% | 18.8% | 30.4% | |
| 2012 | Governor | 41.4% | 19.1% | 39.5% |
| US House | 51.3% | 22.5% | 26.2% | |
| US Senate | 55.1% | 20% | 24.9% | |
| 2014 | Governor | 45.7% | 19.5% | 34.9% |
| US House | 46.6% | 22.3% | 31.2% | |
| US Senate | 51.5% | 22.4% | 26.1% | |
| Figures are from September 1 through October 23 in each year. Totals in 2014 are based on ongoing Wesleyan Media Project coding, and 2010 and 2012 totals are from prior Wesleyan Media Project coding of Kantar Media/CMAG ad airings. |
||||
The Wesleyan Media Project is launching a new initiative and new web presence today – AttackAds.org – aimed at educating voters about attack ads and dark money thanks to funding from the John S. and James L. Knight Foundation. To read more about the launch, click here.
Table 10 breaks down ad tone in 2014 by party, race and sponsorship. Parties have been the most negative, followed by groups. Republican-leaning groups, although still engaging in considerable negativity, have been more positive than Democratic-leaning groups.
“Groups, especially groups that favor Republicans, are trying something new this year, which is actually running some positive ads,” said Travis Ridout, co-director of the Wesleyan Media Project. “In recent election cycles, group-sponsored advertising has been almost universally negative.”
Some party differences also emerge from Table 10. In Senate races, Democrats have aired a greater percentage of negative ads (57 to 47 percent), while Republicans have focused more on airing contrast ads (27 percent to Democrats’ 17 percent). In the House, however, pro-Democratic and pro-Republican advertising has been equally negative at around 46 percent.
Table 10: Tone of Advertising by Sponsorship and Favored Party (9/1-10/23)
| Pro-Democrat | Pro-Republican | ||||||
|---|---|---|---|---|---|---|---|
| Negative | Contrast | Positive | Negative | Contrast | Positive | ||
| House | Candidate | 19.4% | 33.9% | 46.7% | 23.9% | 24.5% | 51.6% |
| Coord. | 48.6% | 44.7% | 6.8% | 26.7% | 23.5% | 49.8% | |
| Group | 85.3% | 6.6% | 8.1% | 69.9% | 9.7% | 20.5% | |
| Party | 91.9% | 4.8% | 3.3% | 79.3% | 14.2% | 6.5% | |
| Total | 46.3% | 24.2% | 29.5% | 46.9% | 19.5% | 33.6% | |
| Senate | Candidate | 32.8% | 25.1% | 42.1% | 26% | 35.8% | 38.2% |
| Coord. | 24.1% | 59.6% | 16.3% | 8.7% | 68.4% | 22.9% | |
| Group | 90.1% | 2.5% | 7.5% | 70.2% | 14% | 15.8% | |
| Party | 98% | 2% | 0% | 91.9% | 8.1% | 0% | |
| Total | 57% | 17% | 26% | 47.1% | 27.5% | 25.4% | |
| Figures are from September 1- October 23, 2014. Numbers include broadcast television. CITE SOURCE OF DATA AS: Kantar Media/CMAG with analysis by the Wesleyan Media Project. | |||||||
Table 11 ranks the Senate races by their share of pure positive ads since September 1, starting with the least positive race. Louisiana takes top honors, followed by North Carolina, Kansas, Georgia and Kentucky. But the Senate race with the greatest share of pure negative ads was North Carolina’s contest, followed by Arkansas and Michigan.
Table 11: Least Positive U.S. Senate Races
| State | Positive | Contrast | Negative |
|---|---|---|---|
| LA | 14.3% | 47.9% | 37.8% |
| NC | 15.3% | 18.9% | 65.8% |
| KS | 15.7% | 28% | 56.3% |
| GA | 17% | 39.5% | 43.5% |
| KY | 17.2% | 26% | 56.9% |
| VA | 18.2% | 46.4% | 35.4% |
| CO | 20.5% | 20% | 59.5% |
| IA | 21.2% | 16.9% | 61.9% |
| AK | 23.5% | 21.5% | 55% |
| MI | 25.1% | 9.9% | 64.9% |
| NH | 26% | 20.5% | 53.5% |
| AR | 27% | 7.6% | 65.5% |
| Figures are from September 1, 2014, to October 23, 2014. Numbers include broadcast television. Hawaii, where all advertising was contrast spots, is not shown in the table because only 56 ads were aired. CITE SOURCE OF DATA AS: Kantar Media/CMAG with analysis by the Wesleyan Media Project. |
|||
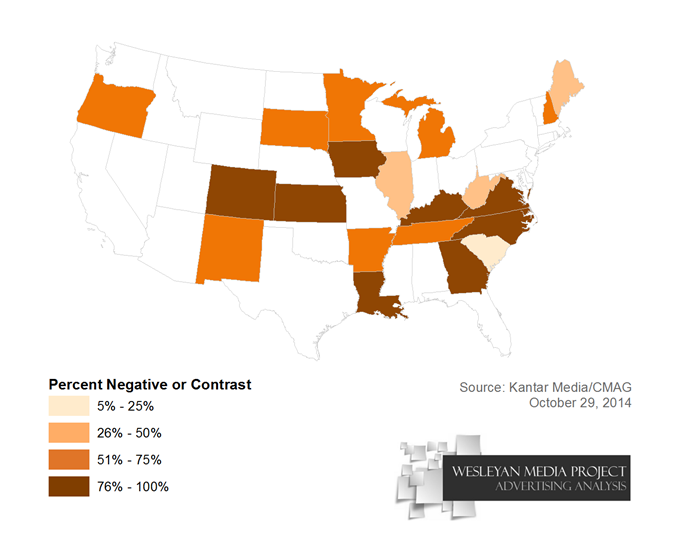
Figure 1 graphically displays the proportion of negative and contrast ads in Senate races across the country as measured by the total number of airings in each race.
![]()
Figure 1: Percent of Ads that are Negative or Contrast in U.S. Senate Races (9/1-10/23/14)
Numbers are based on ongoing Wesleyan Media Project coding of Kantar Media/CMAG video of ads in House and Senate races.
![]()
Connecticut’s gubernatorial race takes the crown for least positive race for governor (Table 12). Just 15 percent of ads aired in that race since September 1 were positive. Second on the list is Illinois, followed by New Mexico, Florida and Pennsylvania. Connecticut’s race also has the greatest share of pure negative ads, at 69.6 percent.
Table 12: Least Positive Gubernatorial Races
| State | Positive | Contrast | Negative |
|---|---|---|---|
| CT | 15% | 15.5% | 69.6% |
| IL | 17.8% | 20.4% | 61.8% |
| NM | 20.2% | 24% | 55.8% |
| FL | 21.3% | 15.8% | 62.8% |
| PA | 21.8% | 20.1% | 58.1% |
| MI | 22% | 26.9% | 51% |
| WI | 23.1% | 13.7% | 63.3% |
| AZ | 23.7% | 26.2% | 50.1% |
| NH | 25.3% | 44.8% | 29.9% |
| MD | 25.7% | 17.8% | 56.5% |
| MN | 31.5% | 35.3% | 33.2% |
| NY | 31.9% | 23.1% | 45% |
| SC | 34.9% | 33.2% | 31.9% |
| AR | 36.9% | 28.6% | 34.5% |
| GA | 37.3% | 32.4% | 30.3% |
| ME | 37.5% | 51.9% | 10.5% |
| KS | 39.9% | 13.6% | 46.5% |
| CO | 40.8% | 0.3% | 58.9% |
| OK | 41.5% | 55.7% | 2.8% |
| IA | 43.3% | 11.2% | 45.5% |
| Figures are from September 1, 2014, to October 23, 2014. Numbers include broadcast television. In North Carolina, all ads aired were negative and in California, all ads aired were contrast, but given that fewer than 1000 gubernatorial ads aired in each state, they were excluded from the table. CITE SOURCE OF DATA AS: Kantar Media/CMAG with analysis by the Wesleyan Media Project. |
|||
House Majority PAC Becomes Top Group Spender
House Majority PAC aired the most ads—and was also the biggest interest group spender—over the October 10-23 period, airing almost 7,000 ads at an estimated cost of $8.7 million (Table 13). The group was active in over 20 different House races. The Republican Governors Association aired 5,500 ads in races in 8 states, while Crossroads GPS and its cousin American Crossroads, each aired about 5,000 ads, mostly in Senate races.
Table 13: Top Group Sponsors over Past Two Weeks
| Sponsor | Type/ Disclose? | # Ads | Est. $s (in millions) | Races |
|---|---|---|---|---|
| House Majority PAC | Super PAC/ yes | 6,907 | 8.8 | House: AZ01, AZ02, AZ09, CA07, CA36, CA52, CO06, CT05, FL18, FL26, GA12, IA03, IL12, MA06, ME02, MN07, MN08, NE02, NH02, NJ01, NY24, TX23, VA10, WV03 |
| Republican Governors Association | 527/yes | 5,533 | 2.8 | Gov: AR, AZ, CO, GA, ID, KS, ME, MI |
| Crossroads Grassroots Policy Strategies | 501c4/no | 5,072 | 5.5 | Sen: AR, CO, KY, LA, NC House: NJ03, NV04 |
| American Crossroads | Super PAC/ yes | 4,928 | 3.1 | Sen: AK, AR, IA, NH House: AR02 |
| Freedom Partners Action Fund | Super PAC/ partial | 3,964 | 2.9 | Senate: AR, CO, IA, KS, NC House: FL02 |
| AFSCME People | 527/yes | 3,771 | 2.9 | Sen: CO, IA, MI, NC House: CA52 |
| Mayday PAC | Super PAC/ yes | 3,651 | 1.5 | Sen: KS, SD House: IA03, MI06 |
| Democratic Governors Association | 527/yes | 3,107 | 1.5 | Gov: MD, MI |
| U.S. Chamber of Commerce | 501c6/no | 3,037 | 1.9 | Sen: AK, CO, IA, KS, NC House: AZ02, CA21, MA06 |
| NEA Advocacy Fund | Super PAC/ yes | 2,755 | 1.8 | Sen: AR, CO, NC Gov: HI, KS House: FL02, ME02 |
| Ending Spending Action Fund | Super PAC/ yes | 2,549 | 2.6 | Sen: CO, GA, KS, MI, NH |
| Congressional Leadership Fund | Super PAC/ partial | 2,303 | 4.5 | House: AZ02, CA07, CA52, FL02, IL10, NH01, TX23, VA10 |
| American Action Network | 501c4/no | 2,211 | 3.2 | House: AZ01, AZ02, CA07, FL26, MN08, TX23 |
| NRA Political Victory Fund | PAC/yes | 1,953 | 1.5 | Sen: AR, CO, GA, IA, KS, LA, NC Gov: CO, GA, KS |
| Making Colorado Great | 527/yes | 1,645 | 1.5 | Gov: CO |
| Greater Wisconsin Committee | 501c4/no | 1,493 | 0.8 | Gov: WI |
| Committee to Elect An Independent Senate | Super PAC/ yes | 1,396 | 0.8 | Sen: KS |
| Senate Majority PAC | Super PAC/ yes | 1,376 | 0.8 | Sen: AR, CO, IA, NC, NH |
| NextGen Climate Action Committee | Super PAC/ yes | 1,151 | 1.7 | Sen: CO Gov: FL |
| Kentuckians for Strong Leadership | Super PAC/ yes | 1,117 | 0.9 | Sen: KY |
| Figures are from October 10-23, 2014. Numbers include broadcast television. CITE SOURCE OF DATA AS: Kantar Media/CMAG with analysis by the Wesleyan Media Project. Disclosure information from the Center for Responsive Politics. |
||||
The biggest group spenders this election cycle are shown in Table 14. Since January 1, 2013, the Republican Governors Association has spent almost $23.3 million to air almost 45,000 ads. They are followed closely by Senate Majority PAC, Crossroads Grassroots Policy Strategies and Americans for Prosperity.
Table 14: Large Group Spenders This Election Cycle
| Sponsor | Party Lean | Est. $s (in millions) | # Ads |
|---|---|---|---|
| Republican Governors Association | GOP | 22.3 | 44,880 |
| Senate Majority PAC | Dem | 22.1 | 42,476 |
| Crossroads GPS | GOP | 20.9 | 30,623 |
| Americans for Prosperity | GOP | 17.1 | 34,140 |
| House Majority PAC | Dem | 14.9 | 19,037 |
| U.S. Chamber of Commerce | GOP | 14.5 | 25,165 |
| Let's Get To Work | GOP | 13.2 | 26,723 |
| NextGen Climate Action Committee | Dem | 11.6 | 21,787 |
| Democratic Governors Association | Dem | 10.3 | 18,264 |
| Ending Spending Action Fund | GOP | 9.5 | 11,080 |
| American Crossroads | GOP | 9.1 | 17,839 |
| Illinois Freedom PAC | Dem | 8.8 | 6,182 |
| Freedom Partners Action Fund | GOP | 6.9 | 11,054 |
| Patriot Majority USA | Dem | 6.3 | 14,638 |
| NRA Political Victory Fund | GOP | 6 | 7,675 |
| Kentucky Opportunity Coalition | GOP | 5.8 | 12,116 |
| Independence USA PAC | Dem | 5.4 | 3,150 |
| Commonwealth Future Independent Expenditure PAC | GOP | 5.2 | 3,639 |
| NEA Advocacy Fund | Dem | 5.1 | 8,274 |
| AFSCME People | Dem | 5 | 6,749 |
| Figures are from January 1, 2013-October 23, 2014. Numbers include broadcast television. CITE SOURCE OF DATA AS: Kantar Media/CMAG with analysis by the Wesleyan Media Project. |
|||
38 Percent of Group-Sponsored Ads Paid for with Dark Money
A Wesleyan Media Project analysis, in partnership with the Center for Responsive Politics, shows that over 600,000 group-sponsored ads have aired in House, Senate and gubernatorial races since the beginning of the 2013-14 election cycle (Table 15). Thus, groups have sponsored 27.2 percent of ads aired this election cycle in federal and gubernatorial races.
Among those 600,000-plus ads, 37.8 percent were paid for with “dark money,” groups whose donors are not being disclosed. Another 3.6 percent of group-sponsored ad airings this cycle were sponsored by groups that only partially disclose their donors.
![]()
“These opaque groups are spending more money than ever and making up a larger portion of election spending,” said Sheila Krumholz, executive director of the Center for Responsive Politics, a Wesleyan Media Project partner. “As a result, voters lack information they need to understand which individuals or organizations are trying to influence their vote.”
![]()
Much of the dark money advertising has appeared in congressional races. In the Senate, 48.6 percent of group airings were backed by dark money, and these groups additionally sponsored 43.8 percent of group airings in the House. In races for governor, however, only 16.3 percent of group-sponsored ads were backed by dark money.
There were also party differences in the use of dark money. Forty-eight percent of the airings from Republican-leaning groups were from groups that do not disclose their donors. Among, Democratic-leaning groups, 23 percent of ads were paid for with dark money.
Table 15: Disclosure Status of Outside Group Advertising in Federal and Gubernatorial Races
| Volume Cycle to Date | % of Airings | Dem Airings | GOP Airings | |
|---|---|---|---|---|
| Dark Money | 228,489 | 38% | 22.9% | 48% |
| Partial Disclosure | 22,215 | 4% | 2.5% | 5% |
| Full Disclosure | 354,213 | 59% | 74.6% | 47% |
| Total Group-sponsored ads | 604,917 | |||
| Figures are from January 1, 2013 – October 23, 2014. Numbers include broadcast television. CITE SOURCE OF DATA AS: Kantar Media/CMAG with analysis by the Wesleyan Media Project. Disclosure information from the Center for Responsive Politics. |
||||
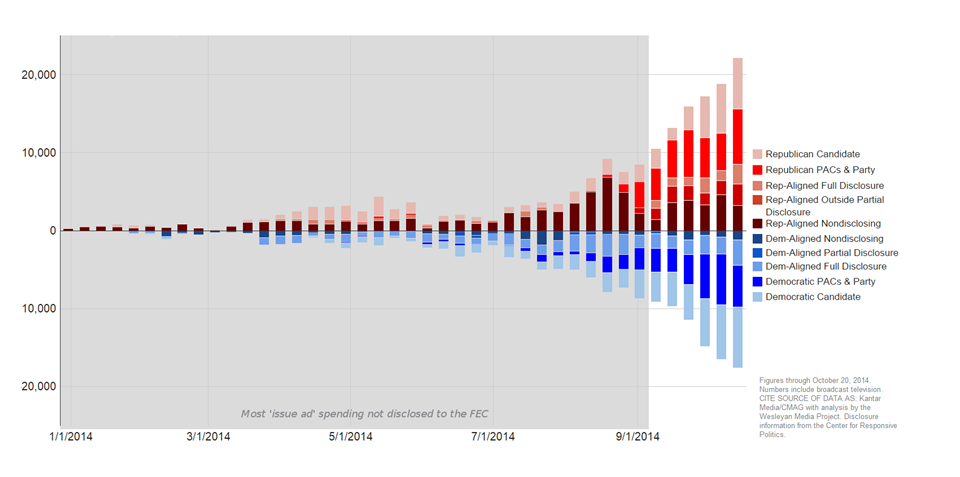
Figure 2 reveals the volume of advertising by sponsorship (candidate, party, fully-disclosing group, partially-disclosing group or non-disclosing group) and by party for five top Senate races. Bars above the line indicate Republican advertising, while bars below the line indicate Democratic advertising. The figure shows, first, how the volume of advertising has picked up heading toward Election Day. In addition, the figure shows considerably greater volumes of group advertising on the Republican side. Finally, the figure shows that a greater proportion of Republican group-sponsored advertising comes from non-disclosing and partially-disclosing groups compared to Democratic group-sponsored advertising. Figures showing the same data for Senate races in Arkansas, Colorado, Iowa and North Carolina are also available (PDF).
![]()
Figure 2: Ad Buys in Top 5 Senate Races, By Disclosure and Type
![]()
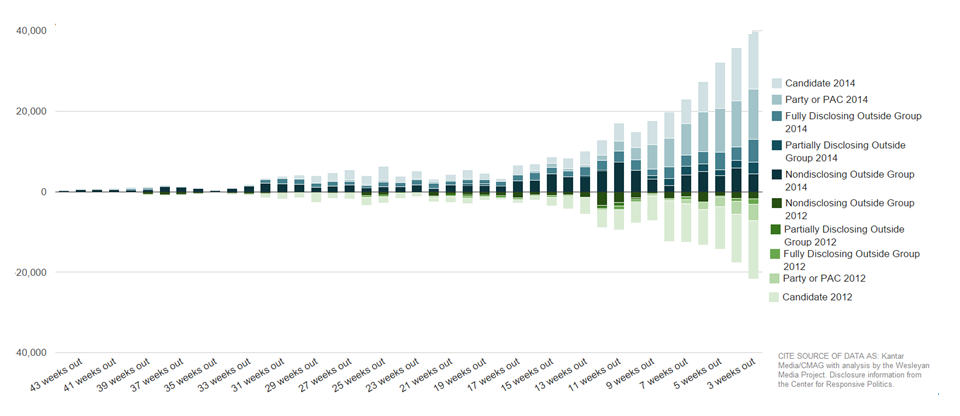
Figure 3 shows how the extent of disclosure compares to 2012 in the 5 top Senate races in each year. Bars above the 0 point indicate the volume of advertising in 2014 by source (candidate, party, fully disclosing group, partially disclosing group or non-disclosing group). Bars below the 0 point indicate the same information for 2012. Not only has the overall volume of advertising in the top Senate races increased over 2012, but the volume of dark money has as well.
![]()
Figure 3: Ad Buys Over Time in Top 5 Senate Races, 2012 and 2014, By Disclosure and Type
![]()
GOP House Candidates Talk Obamacare, Taxes, Jobs; Dems Talk Taxes, Social Welfare Issues
Table 16 shows the top issues mentioned in House advertising since September 1, broken down by party. The issue featured most often in ads favoring Democrats is taxation, a mention of which appears in 29 percent of ads. Taxation is followed by Medicare, Social Security and education as most-mentioned issues in pro-Democratic advertising. On the Republican side, Obamacare is the most frequently mentioned issue, appearing in 26 percent of ads. Discussion of taxation, jobs and budgets/deficits follow.
Table 16: Top House Issues in U.S. House Advertising
| Pro-Dem | Pro-GOP | |||
|---|---|---|---|---|
| Taxes | 28.8% | Obamacare | 25.9% | |
| Medicare | 19.4% | Taxes | 24.2% | |
| Social Security | 17.2% | Employment/Jobs | 21.9% | |
| Education/Schools | 14.4% | Deficit/Budget/Debt | 15.6% | |
| Employment/Jobs | 14.1% | Gov't spending | 13.7% | |
| Deficit/Budget/Debt | 11.4% | Medicare | 13% | |
| Government shutdown | 11.1% | Government Ethics/Scandal | 10.3% | |
| Veterans | 11% | Energy Policy | 7.9% | |
| Government Ethics/Scandal | 10.3% | Business | 7.4% | |
| Health Care | 8.1% | Veterans | 7.4% | |
| Gov't spending | 7% | Health Care | 6.5% | |
| Women's Health | 6.6% | Economy | 5.3% | |
| Abortion | 6.4% | Immigration | 5.2% | |
| Local Issues | 5.8% | Moral/Family/Religious Values | 4.8% | |
| Figures are from September 1 to October 23, 2014 and are based on ongoing Wesleyan Media Project coding of Kantar Media/CMAG video. |
||||
Table 17 lists the top issue mentions in sixteen Senate races, by party. In only three states (Georgia, Kentucky, and Minnesota) are the top issue mentions the same in Democratic and Republican advertising. Obamacare is the top issues mentioned in ads favoring Republicans in five of the sixteen states, while budget and deficits get top billing in four states. Immigration features highly in pro-Republican advertising in Louisiana, appearing in almost two out of three ads. The top issue mentioned in pro-Democratic Senate advertising varies considerably across states. Women’s health, for instance, is mentioned in almost half of ads favoring the Democrat in Colorado.
Table 17: Top Senate Issues by State
| State | Pro-Dem Top Issue | Pro-GOP Top Issue |
|---|---|---|
| Alaska | Local issues (27.5%) | Deficit/Budget (32.5%) |
| Arkansas | Taxes (33.5%) | Obamacare (42.9%) |
| Colorado | Women’s health (48.8%) | Energy policy (30.8%) |
| Georgia | Jobs/employment (30.9%) | Jobs/employment (51.3%) |
| Iowa | Social security (38.3%) | Veterans (28.0%) |
| Kansas* | Business (26.2%) | Obamacare (46.9%) |
| Kentucky | Jobs/employment (48.4%) | Jobs/employment (26.4%) |
| Louisiana | Medicare (44.1%) | Immigration (65.3%) |
| Michigan | Environment (35.9%) | Jobs/employment (44.0%) |
| Minnesota | Taxes (31.8%) | Taxes (60.2%) |
| North Carolina | Education (41.3%) | Deficit/Budget (22.7%) |
| New Hampshire | Jobs/employment (42.4%) | Obamacare (47.2%) |
| New Mexico | Veterans (27.5%) | Deficit/Budget (71.6%) |
| Oregon | Taxes (61.2%) | Deficit/Budget (32.6%) |
| South Dakota** | Social security (41.1%) | Obamacare (55.5%) |
| Virginia | Jobs/employment (47.0%) | Obamacare (67.7%) |
| Figures are from September 1 to October 23, 2014 and are based on ongoing Wesleyan Media Project coding of Kantar Media/CMAG video. *Numbers for independent candidate, Greg Orman, are reported in the Democratic column. **The top issue for South Dakota independent Larry Pressler was Deficit/Budget (66.1%). |
||
Negative Mentions of Affordable Care Act Continue to Rise
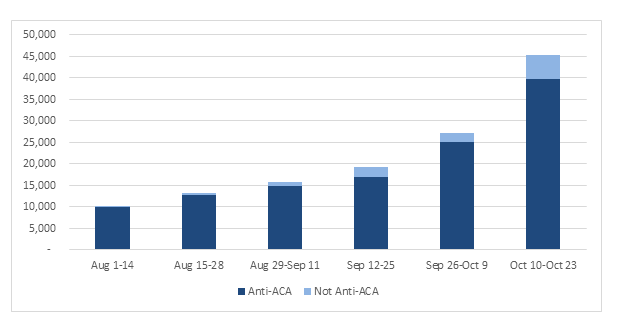
The number of ads mentioning the Affordable Care Act (Obamacare) continues to rise as Election Day approaches (Figure 4). About 45,000 ads in the past two weeks mentioned the ACA, the vast majority of which (almost 40,000) mentioned the ACA in a negative fashion. The few ads that are not-anti ACA can at best be characterized as obliquely discussing the law using references to a candidate “standing up to insurance companies,” etc.
![]()
“Campaign ads attacking the Affordable Care Act continue to rise in number as we head into the upcoming enrollment period,” said Erika Franklin Fowler, co-director of the Wesleyan Media Project. “How the negative political messaging interacts with insurance advertising may be important in understanding citizen attitudes, information and behavior.”
![]()
Figure 4: Volume of Ads Referencing the Affordable Care Act (House/Senate Airings Only)
Numbers are based on ongoing Wesleyan Media Project coding of Kantar Media/CMAG video of ads in House and Senate races.
![]()
Anger Outpaces Fear and Enthusiasm in Senate Races
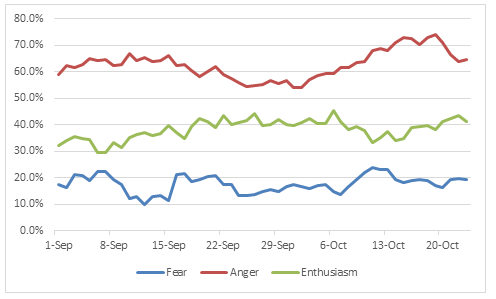
Figure 5 shows the percentage of ads over time in Senate races making appeals to anger, enthusiasm and fear. There was a small uptick in the use of fear appeals earlier this month, but anger remains the dominant emotional appeal in Senate advertising—and anger’s use has been growing since the end of September. On October 19, for instance, just under 75 percent of ads aired in Senate races made an appeal to anger.
![]()
Figure 5: Appeals in U.S. Senate Races
Figures are from September 1 to October 23, 2014 of and are based on ongoing Wesleyan Media Project coding of Kantar Media/CMAG video.
![]()
Table A1: Volume and Estimated Cost of Advertising in US Senate Races by Sponsor
Table A2: Volume and Estimated Cost of Advertising in US Gubernatorial Races by Sponsor
[spacer]About This Report
Data reported here do not cover local cable buys, only broadcast television and national cable buys. All cost estimates are precisely that: estimates. Content information is based on ongoing Wesleyan Media Project coding and analysis of Kantar Media/CMAG video, which is 95% complete for the time period discussed (99% complete for U.S. Senate races and 86% complete for U.S. House races). Intercoder reliability is high for measures of tone (94% agreement and a Kappa score of 0.91). Disclosure categorization information on interest groups comes from the Center for Responsive Politics.
The Wesleyan Media Project provides real-time tracking and analysis of all political television advertising in an effort to increase transparency in elections. Housed in Wesleyan’s Quantitative Analysis Center – part of the Allbritton Center for the Study of Public Life – the Wesleyan Media Project is the successor to the Wisconsin Advertising Project, which disbanded in 2009. It is directed by Erika Franklin Fowler, assistant professor of government at Wesleyan University, Michael M. Franz, associate professor of government at Bowdoin College and Travis N. Ridout, associate professor of political science at Washington State University. Laura Baum is the Project Manager.
The Wesleyan Media Project is supported by grants from The John S. and James L. Knight Foundation, the MacArthur Foundation and Wesleyan University. Data provided by Kantar Media/CMAG with analysis by the Wesleyan Media Project using Academiclip, a web-based coding tool. The Wesleyan Media Project is partnering in 2014 with both the Center for Responsive Politics, to provide added information on interest group disclosure, and Ace Metrix, to assess ad effectiveness.
The Center for Responsive Politics is the nation’s premier research group tracking money in U.S. politics and its effect on elections and public policy. Nonpartisan, independent and nonprofit, the organization aims to create a more educated voter, an involved citizenry and a more transparent and responsive government. CRP’s award-winning website, OpenSecrets.org, is the most comprehensive resource available anywhere for federal campaign contribution and lobbying data and analysis.
Periodic releases of data will be posted on the project’s website and dispersed via Twitter @wesmediaproject. To be added to our email update list, click here.
![]()
For more information contact:
Lauren Rubenstein, lrubenstein@wesleyan.edu, (860) 685-3813
![]()
About Wesleyan University
Wesleyan University, in Middletown, Conn., is known for the excellence of its academic and co-curricular programs. With more than 2,900 undergraduates and 200 graduate students, Wesleyan is dedicated to providing a liberal arts education characterized by boldness, rigor and practical idealism. For more, visit www.wesleyan.edu.
About the John S. and James L. Knight Foundation
Knight Foundation supports transformational ideas that promote quality journalism, advance media innovation, engage communities and foster the arts. We believe that democracy thrives when people and communities are informed and engaged. For more, visit www.knightfoundation.org.
About the MacArthur Foundation
The MacArthur Foundation supports creative people and effective institutions committed to building a more just, verdant, and peaceful world. In addition to selecting the MacArthur Fellows, the Foundation works to defend human rights, advance global conservation and security, make cities better places, and understand how technology is affecting children and society. More information is at www.macfound.org.
