Trump and Harris Even in TV Ad Spots This Past Week
(MIDDLETOWN, CT) October 31, 2024 – In its final pre-election analysis, the Wesleyan Media Project has examined ad spending for the entire election cycle back to January 2023. We identify nearly $4.5 billion in television and radio advertising in federal and gubernatorial campaigns, which does not include digital spending covered below (Figure 1). Over $3.4 billion of that total was committed to local broadcast or national network advertising. An additional $770 million was committed to television ads on local and national cable networks.
“Television ads continue to dominate federal and statewide election campaigns,” said Michael Franz, co-director of the Wesleyan Media Project. “Of course, digital and online spending is incredibly important, but campaigns still find value in reaching voters in more traditional ways. Voters in battleground states who watch local news, games shows, or talk shows on television, which is when a lot of election spots air, have heard quite a bit from the candidates this election cycle.”
Figure 1: Federal and Gubernatorial TV and Radio Ad Spending, 2023-24 (to 10/27/24)
Figures are from January 1, 2023 to October 27, 2024.
Spending in Presidential, Congressional, and Gubernatorial Races Included. Broadcast TV includes local broadcast and national network spots. Addressable includes satellite and connected TV from LG Ad Sales.
CITE SOURCE OF DATA AS: Vivvix CMAG with analysis by the Wesleyan Media Project.
In Table 1, we break down cycle-to-date spending on local broadcast television as well as national network and cable buys in the presidential race, inclusive of the presidential primaries earlier in 2024. Spending on ads totaled over $1.27 billion, amounting to about 1.2 million ad airings.
On the Democratic side, Joe Biden and Kamala Harris were responsible for 70 percent of the ad spots, with outside groups sponsoring the remaining ads. The Democratic Party sponsored no broadcast spots on its own and only a handful of coordinated spots.
The Republican totals include Trump’s general election spots but also spending by other GOP candidates earlier in the cycle in the failed attempt to deny him the party nomination. Republican spending totaled $660 million, and 43 percent of those ad spots were sponsored by outside groups. The Republican Party has stayed completely off the air in the presidential race this cycle, even throughout the general election.
Table 1: Cycle to Date Spending on Television for President, 2023-2024
| Candidates | Party | Coordinated | Groups | Total | |
|---|---|---|---|---|---|
| President Pro-Dem | |||||
| Airings | 394,535 | 0 | 2,950 | 166,103 | 563,588 |
| % of airings | 70.0% | 0.0% | 0.5% | 29.5% | |
| Est. cost ($Ms) | 284.49 | 0 | 6.55 | 326.27 | 617.3 |
| President Pro-Rep | |||||
| Airings | 358,101 | 0 | 0 | 272,639 | 630,740 |
| % of airings | 56.8% | 0.0% | 0.0% | 43.2% | |
| Est. cost (SMs) | 201.33 | 0 | 0 | 458.94 | 660.27 |
| Figures are from January 1, 2023 to October 27, 2024. Includes spending in party nomination campaigns. Totals include local broadcast, national cable, and national network spots. CITE SOURCE OF DATA AS: Vivvix CMAG with analysis by the Wesleyan Media Project. |
|||||
Senate Ad Spending Exceeds $1.2 Billion
In Table 2, we show ad spots and spending in U.S. Senate elections. Ad spending on broadcast, national cable and network television totaled $1.2 billion for nearly 1.5 million ad airings in the current election cycle. Notably, Democratic candidates were sponsors of over 64 percent of the ads for their campaigns, with outside groups sponsoring 1 in 4 pro-Democratic ads. The Democratic Party pitched in with independent expenditures or coordinated ad buys in 10 percent of the pro-Democratic airings.
For Republicans, Senate candidates were much more reliant on party and group support, with groups sponsoring 47 percent of ad airings. Party coordinated ads accounted for over 19 percent of Republican Senate airings. Republican Senate candidates sponsored less than 1 in 3 ads on their behalf this cycle.
Table 2: Cycle to Date Spending on Broadcast Television for U.S. Senate, 2023-2024
| Candidates | Party | Coordinated | Groups | Total | |
|---|---|---|---|---|---|
| Senate Pro-Dem | |||||
| Airings | 538,546 | 21,745 | 66,744 | 208,867 | 835,902 |
| % of airings | 64.4% | 2.6% | 8.0% | 25.0% | |
| Est. cost ($Ms) | 262.37 | 23.61 | 47.96 | 282.21 | 616.16 |
| Senate Pro-GOP | |||||
| Airings | 208,044 | 10,909 | 126,812 | 309,597 | 655,362 |
| % of airings | 31.7% | 1.7% | 19.3% | 47.2% | |
| Est. cost ($Ms) | 102.97 | 16.48 | 66.54 | 407.89 | 593.87 |
| Figures are from January 1, 2023 to October 27, 2024. Totals include local broadcast, national cable, and national network spots. CITE SOURCE OF DATA AS: Vivvix CMAG with analysis by the Wesleyan Media Project. |
|||||
House Advertising Approaches $850 Million
Spending on ads in U.S. House races this election cycle has approached $850 million for a total of 1.2 million ad airings (Table 3). Democratic candidates have benefitted from 644,000 ad airings compared to 574,000 on the Republican side. Candidate-sponsored ads make up a slightly greater proportion of ads on the Democratic side (53 percent) than on the Republican side (48 percent), while groups-sponsored ads make up a greater proportion among Republican ads than among Democratic ads (36 v. 31 percent).
Table 3: Cycle to Date Spending on Broadcast Television for U.S. House, 2023-2024
| Candidates | Party | Coordinated | Groups | Total | |
|---|---|---|---|---|---|
| House Pro-Dem | |||||
| Airings | 341,325 | 50,321 | 50,719 | 201,391 | 643,756 |
| % of airings | 53.0% | 7.8% | 7.9% | 31.3% | |
| Est. cost ($Ms) | 152.21 | 55.13 | 19.91 | 232.82 | 460.07 |
| House Pro-GOP | |||||
| Airings | 273,146 | 19,218 | 72,969 | 208,406 | 573,739 |
| % of airings | 47.6% | 3.3% | 12.7% | 36.3% | |
| Est. cost ($Ms) | 106.38 | 33.59 | 22.64 | 217.22 | 379.83 |
| Figures are from January 1, 2023 to October 27, 2024. Includes spending for off-year special elections. CITE SOURCE OF DATA AS: Vivvix CMAG with analysis by the Wesleyan Media Project. |
|||||
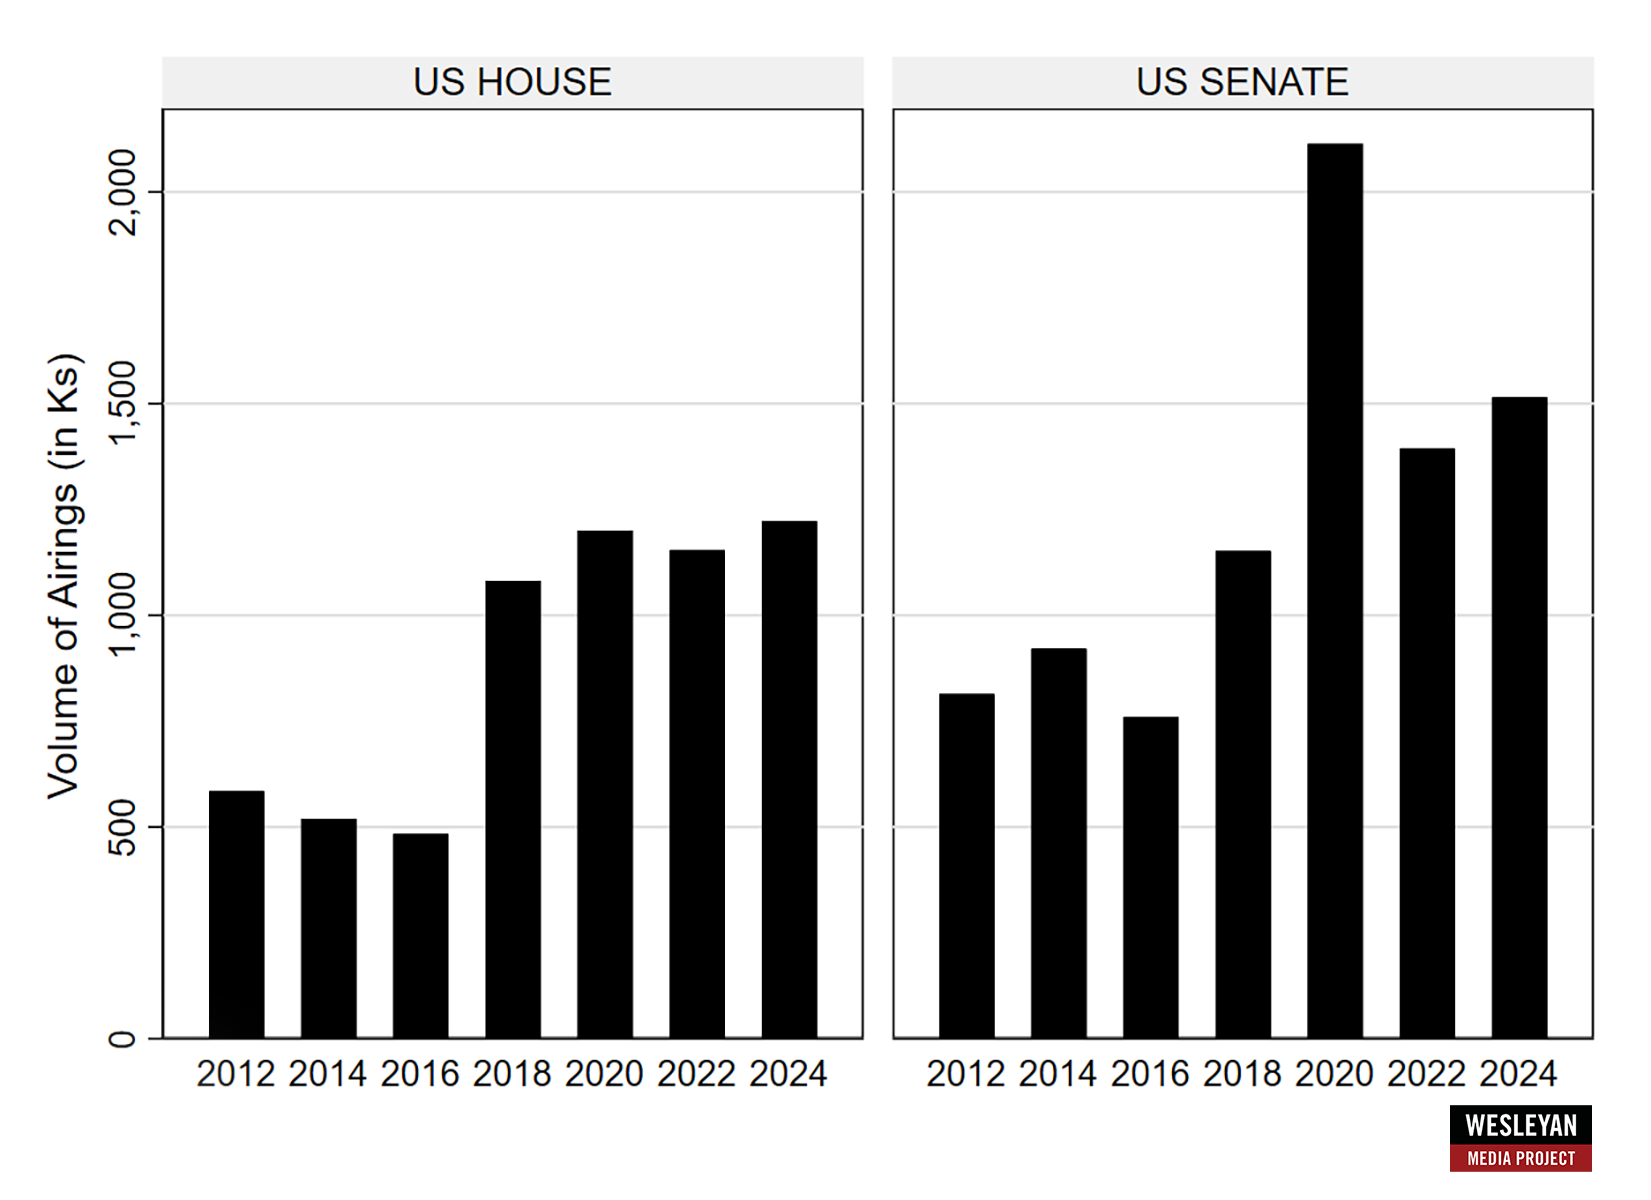
All told, ad airings in congressional races are breaking records. The totals in House campaigns are higher than any previous campaign back to 2012 (Figure 2). The totals for Senate campaigns fall short of 2020, but exceed all other elections back to 2012, including the previous comparable election featuring the same states in 2018.
Figure 2: Ad Airings in House and Senate Races, 2012 to 2024
Figures are from January 1 of off-year to October 27 of election year.
CITE SOURCE OF DATA AS: Vivvix CMAG with analysis by the Wesleyan Media Project.
Harris Continues to Out-Spend Trump on Digital
In the past week, the Harris campaign spent $17 million on Meta and Google ads, out-pacing Trump’s $7.3 million (Table 4). This continues the broader trend from this election in the presidential race: Harris and Biden significantly out-spent Trump on both platforms. In the full cycle-to-date, for example, Democrats spent nearly $300 million on digital ads, compared to just $65 million for Trump.
Notably, the presidential total across both campaigns—over $350 million—is just a portion of the broader spending on Google and Meta this cycle, which includes other groups supportive of the presidential candidates (the totals in Table 4 just count candidate and some party spending), spending from congressional candidates, parties, and supportive groups, and other spending for gubernatorial campaigns. This means that total ad spending this cycle, inclusive of television, radio, and digital is likely well above $5 billion.
Table 4: Digital Spending by the Candidates on Meta and Google
| Cycle-to-date | Meta (in $Ms) | Google (in $Ms) | Total (in $Ms) |
|---|---|---|---|
| Harris/Biden | 152.9 | 140.3 | 293.2 |
| Trump | 19.6 | 45.9 | 65.5 |
| Last week (10/20 - 10/26) | |||
| Harris | 10.3 | 6.8 | 17.1 |
| Trump | 2.8 | 4.5 | 7.3 |
| General election (7/22-10/26) | |||
| Harris | 109.2 | 105 | 214.2 |
| Trump | 14.8 | 33.9 | 48.7 |
| Figures for the last week are from October 20 (for Meta, which includes Facebook and Instagram) and October 20 (for Google, which includes search advertising, YouTube, and third-party advertising) to October 26, 2024. Numbers for campaigns include joint fundraising committee advertising. National party spending is excluded if it occurs only on the national party pages and/or does not contain any reference to a presidential sponsor in the disclaimer. CITE SOURCE OF DATA AS: Meta Ad Library and Google Transparency Report with analysis by the Wesleyan Media Project. |
|||
Trump and Harris Near Even in Ad Spending on TV and Radio in Last Week
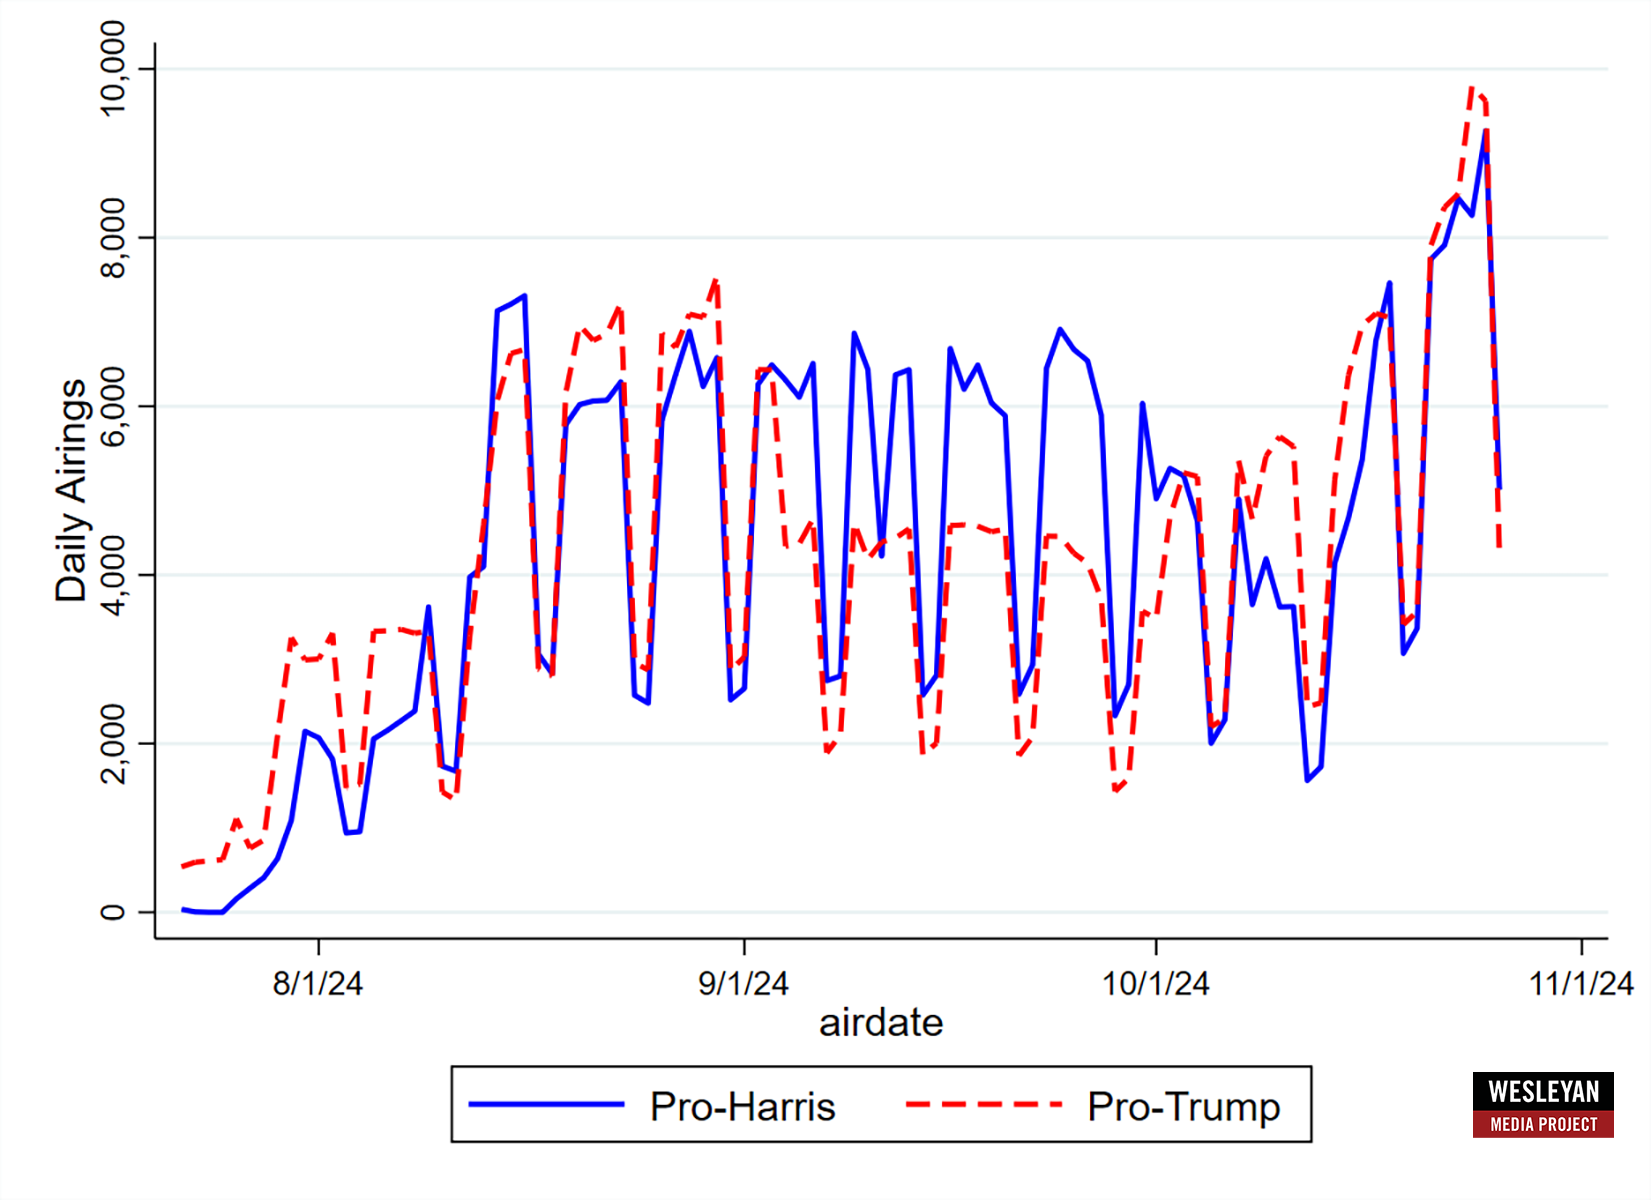
We also updated recent TV and radio spending in the presidential race by looking at ad buys since our last release. Figure 3 shows that the volume of local broadcast and national network or cable ads has spiked in the past week, surpassing 9,000 airings for each side by Friday (10/25).
Figure 3: Volume of Pro-Harris and Pro-Trump Ad Airings by Day
Totals include local broadcast, national cable, and national network spots.
CITE SOURCE OF DATA AS: Vivvix CMAG with analysis by the Wesleyan Media Project.
Ads supporting Harris and Trump were almost equal in number for the period between October 21 and 27 (Table 5). In that time pro-Harris ads numbered 52,621, while pro-Trump ads numbered 53,287. The Harris campaign sponsored almost 30,000 airings in the past week and was aided by FF PAC, which sponsored another 22,000 airings. On the Republican side, the Trump campaign sponsored 38,000 airings, while MAGA, Inc., sponsored another 10,000.
Table 5: Television Ad Spending in Presidential Race (October 21 to 27)
| Sponsor | Party | Ad airings | Est. Cost (in $Ms) |
|---|---|---|---|
| Harris, Kamala | Dem | 29,332 | 21.37 |
| FF PAC | Dem | 21,690 | 42.64 |
| Trump, Donald | Rep | 38,302 | 29.72 |
| Make America Great Again Inc. | Rep | 10,341 | 32.16 |
| All pro-Harris | 52,621 | 67.71 | |
| All pro-Trump | 53,287 | 78.75 | |
| Figures are from October 21-27, 2024. Totals include local broadcast, national cable, and national network spots. CITE SOURCE OF DATA AS: Vivvix CMAG with analysis by the Wesleyan Media Project. |
|||
Harris Holds Slight TV Ad Advantage Since July
To look at the general election campaign in total, we also show the same analysis for the period back to July 22, when Kamala Harris became the presumptive Democratic nominee (Table 6). Because FF PAC partnered with a few other organizations for larger ad buys in the earlier part of the campaign, we combined them in one row in the table. All told, pro-Harris ads totaled 422,000 at a cost of nearly $500 million. Pro-Trump ads totaled 414,000 at a cost of $438 million. At various points in the campaign one side aired more ads than the other (Figure 3 above), with Trump out-airing Harris in August and early October and Harris out-airing Trump for most of September, but in total each side marshaled very similar broadcast ad totals.
Table 6: Television Ad Spending in Presidential Race (July 22 to October 27)
| Sponsor | Party | Ad airings | Est. Cost (in $Ms) |
|---|---|---|---|
| Harris, Kamala | Dem | 292,444 | 221.08 |
| FF PAC (And w/Climate Power Action and/or LCV Victory Fund) | Dem | 103,454 | 213.73 |
| Trump, Donald | Rep | 266,018 | 165.76 |
| Make America Great Again Inc. | Rep | 102,160 | 148.1 |
| Preserve America PAC | Rep | 30,786 | 63.56 |
| All pro-Harris | 422,785 | 494.66 | |
| All pro-Trump | 414,144 | 438.28 | |
| Figures are from October 21-27, 2024. Totals include local broadcast, national cable, and national network spots. CITE SOURCE OF DATA AS: Vivvix CMAG with analysis by the Wesleyan Media Project. |
|||
Extremely Negative Campaign Continues
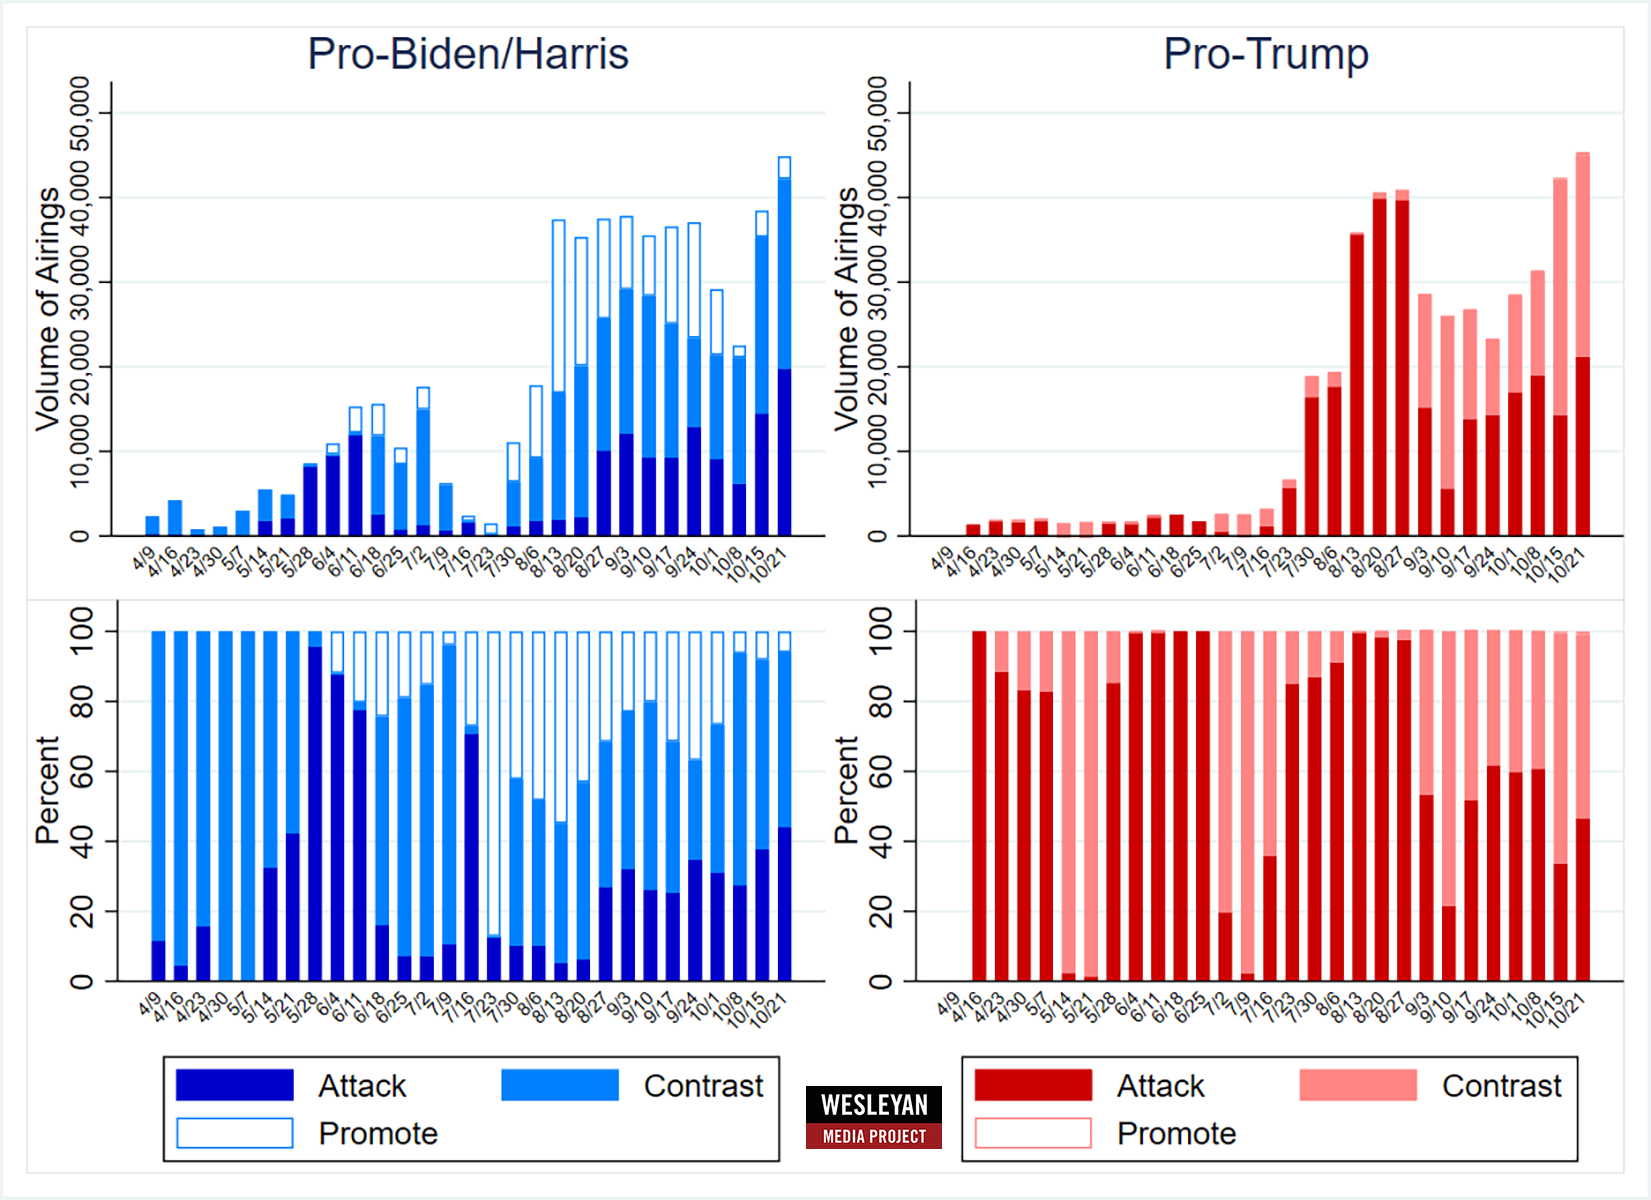
Figure 4 shows the volume of ads by tone and supported candidate in the top panel and the percentage of ads by tone and supported candidate in the bottom panel. Attack (negative) ads are those that solely mention an opponent, contrast ads mention both an opponent and the favored candidate, while promotional (positive) ads mention solely the favored candidate.
We can see that in the past week, only a very small percentage of pro-Harris ads were positive, with most of them falling into the contrast category. The Trump campaign split its ads between contrast ads and attack ads.
“This has been an extremely negative campaign,” said Travis Ridout, co-director of the Wesleyan Media Project. “The Trump campaign—and groups supporting him—have aired only a smattering of positive ads on television since April, barely perceptible amid the din of negative and contrast ads. That is unprecedented.”
Figure 4: Volume and Tone of Presidential TV Ads by Week (April 9 to October 27)
Numbers include local broadcast television, national network, and national cable for all sponsors.
CITE SOURCE OF DATA AS: Vivvix CMAG with analysis by the Wesleyan Media Project.
TV, Radio Ad Spending in Presidential Race Totals $180 Million in One Week
Table 7 shows that just under $180 million has been spent on ads on broadcast, local cable, national cable, satellite TV and radio in the past week. Pro-Harris spending has totaled just over $90 million, while pro-Trump spending has come in at $89 million. While more was spent on pro-Harris ads on local cable, national cable, radio and satellite, more was spent on pro-Trump ads on broadcast television. (These totals do not include the digital spending reported above.)
“Beyond disparities on digital platforms, it would be hard to find a campaign more evenly matched than the presidential race in the past week,” said Erika Franklin Fowler, co-director of the Wesleyan Media Project. “Not only has the number of broadcast television ads been almost equal, but ad spending including cable TV and radio in support of both sides has approached dollar for dollar.”
Table 7: TV and Radio Ad Spending in Presidential Race (October 21-27)
| Sponsor | Party Lean | Total Ad (in $Ms) | Local cable (in $Ms) | National cable (in $Ms) | Radio (in $Ms) | Satellite TV (in $Ms) |
|---|---|---|---|---|---|---|
| FF PAC | Dem | 54.91 | 7.13 | 2.87 | 5.99 | 0.613 |
| Harris, Kamala | Dem | 28.06 | 4.07 | 0.48 | 1.98 | 0.64 |
| Future Forward USA Action | Dem | 1.95 | 0.36 | 0.15 | 0.141 | |
| FF PAC/Climate Power Action/ LCV Victory Fund | Dem | 1.71 | ||||
| Republican Accountability PAC | Dem | 0.76 | 0.13 | 0.06 | ||
| Project Freedom LLC | Dem | 0.43 | 0.1 | |||
| Democratic Majority Action PAC | Dem | 0.42 | 0.037 | |||
| AB PAC & Your Community PAC | Dem | 0.34 | 0.024 | 0.004 | ||
| Local Voices | Dem | 0.24 | 0.16 | |||
| Harris, Kamala & Democratic National Committee | Dem | 0.17 | ||||
| Black PAC | Dem | 0.25 | 0.25 | |||
| Voters of These 50 States Of America | Dem | 0.16 | 0.16 | |||
| America's Future Majority Fund | Dem | 0.12 | 0.12 | |||
| Black Voters Matter Action PAC | Dem | 0.1 | 0.1 | |||
| Speak Up PAC | Dem | 0.1 | 0.1 | |||
| Anti-Psychopath PAC Inc. | Dem | 0.089 | 0.07 | 0.019 | ||
| Democracyfirst | Dem | 0.087 | 0.087 | |||
| United Assoc of Union Plumbers & Pipefitters | Dem | 0.078 | 0.009 | |||
| Unite The Country | Dem | 0.04 | ||||
| Fair Future NC | Dem | 0.033 | 0.033 | |||
| Fight Like Hell PAC | Dem | 0.033 | 0.033 | |||
| Moms Rising Together | Dem | 0.02 | 0.02 | |||
| Emgage Action Inc. | Dem | 0.019 | 0.019 | |||
| Casa In Action | Dem | 0.007 | 0.007 | |||
| Solidarity Victory PAC | Dem | 0.006 | 0.006 | |||
| Make The Road Nevada | Dem | 0.006 | ||||
| Working Families Party PAC | Dem | 0.003 | 0.003 | |||
| Trump, Donald | Rep | 35.03 | 3.6 | 1.82 | 0.3 | 1.414 |
| Make America Great Again Inc. | Rep | 33.83 | 1.3 | 0.15 | 0.23 | |
| Right For America | Rep | 8.47 | 0.83 | 0.041 | 0.63 | 0.205 |
| Restoration PAC | Rep | 3.61 | 0.053 | 0.27 | ||
| Preserve America PAC | Rep | 3.25 | 0.34 | 0.082 | ||
| RJC Victory Fund | Rep | 1.62 | 0.53 | |||
| Dan Newlin Injury Attorneys | Rep | 1.46 | 0.015 | |||
| Maha Alliance | Rep | 0.6 | ||||
| Majority PAC | Rep | 0.42 | 0.38 | |||
| Americas PAC | Rep | 0.4 | 0.4 | |||
| NRA Political Victory Fund | Rep | 0.26 | 0.26 | |||
| Fair Election Fund | Rep | 0.035 | 0.035 | |||
| Americans For Constitutional Liberty | Rep | 0.032 | 0.032 | |||
| America PAC | Rep | 0.022 | 0.022 | |||
| Article III Foundation | Rep | 0.021 | 0.021 | |||
| Stand America PAC | Rep | 0.015 | 0.015 | |||
| Sticker PAC | Rep | 0.005 | 0.005 | |||
| Arab Americans For A Better America | Rep | 0.003 | 0.003 | |||
| Pro-Harris Total | 90.07 | 12.16 | 3.52 | 8.81 | 1.4 | |
| Pro-Trump Total | 89.08 | 6.58 | 2.67 | 1.82 | 1.93 | |
| Figures are from October 21-27, 2024. Total column includes spending for local broadcast TV airings and national network airings in addition to cable, radio, and satellite. CITE SOURCE OF DATA AS: Vivvix CMAG with analysis by the Wesleyan Media Project. |
||||||
Harris Advantage Largest in Detroit; Trump Advantage Largest in Greensboro
Table 8 lists the number of ad airings by media market over the past week, including the number of pro-Harris and pro-Trump ads in each. Atlanta, Philadelphia, Phoenix, Charlotte and Pittsburgh saw the most ads overall. The Harris ad advantage was greatest in Detroit, Milwaukee and Green Bay, while Trump’s biggest advantages were in Greensboro, Wilkes Barre and Lansing. Harris also had slight advantages on both national network and national cable airings that air everywhere. Adding those totals to the balance in top markets means, in effect, that more ads aired from Harris in most places.
Table 8: Broadcast Ad Spending in Presidential Race by Market (October 21-27)
| Market | Total Ad Airings | Pro-Harris Airings | Pro-Trump Airings | Dem Ad Advantage | Est. Cost (in $Ms) | Pro-Harris (in $Ms) | Pro-Trump (in $Ms) |
|---|---|---|---|---|---|---|---|
| Atlanta | 7,189 | 3,514 | 3,675 | -161 | 13.51 | 6.25 | 7.27 |
| Philadelphia | 6,032 | 2,927 | 3,105 | -178 | 15.99 | 6.87 | 9.12 |
| Phoenix | 5,102 | 2,642 | 2,460 | 182 | 9.59 | 4.73 | 4.86 |
| Charlotte | 4,747 | 2,318 | 2,429 | -111 | 4.3 | 1.92 | 2.38 |
| Pittsburgh | 4,184 | 1,988 | 2,196 | -208 | 10.65 | 3.94 | 6.71 |
| Grand Rapids | 4,083 | 1,791 | 2,292 | -501 | 4.49 | 1.54 | 2.95 |
| Detroit | 3,840 | 2,336 | 1,504 | 832 | 11.67 | 4.91 | 6.75 |
| Las Vegas | 3,481 | 1,875 | 1,606 | 269 | 3.66 | 1.74 | 1.92 |
| Raleigh | 3,381 | 1,711 | 1,670 | 41 | 5.2 | 2.53 | 2.67 |
| Harrisburg | 3,302 | 1,421 | 1,881 | -460 | 5.65 | 1.77 | 3.88 |
| Green Bay | 3,234 | 1,915 | 1,307 | 608 | 4.28 | 1.8 | 2.48 |
| Greensboro | 3,093 | 1,169 | 1,924 | -755 | 2.32 | 1.15 | 1.17 |
| Milwaukee | 3,078 | 1,857 | 1,221 | 636 | 5.85 | 2.59 | 3.27 |
| Augusta | 2,593 | 1,052 | 1,541 | -489 | 0.82 | 0.51 | 0.31 |
| Johnstown | 2,573 | 1,188 | 1,385 | -197 | 1.81 | 0.7 | 1.11 |
| Tucson | 2,490 | 1,301 | 1,189 | 112 | 1.91 | 1.09 | 0.82 |
| Madison | 2,456 | 1,105 | 1,351 | -246 | 3.06 | 1.31 | 1.76 |
| Wilkes Barre | 2,445 | 898 | 1,547 | -649 | 3.07 | 0.65 | 2.42 |
| Flint | 2,441 | 1,189 | 1,249 | -60 | 2.58 | 0.91 | 1.67 |
| Greenville, NC | 2,329 | 1,303 | 1,026 | 277 | 1.84 | 0.91 | 0.93 |
| Macon | 2,297 | 899 | 1,398 | -499 | 0.62 | 0.41 | 0.2 |
| Savannah | 2,206 | 1,007 | 1,199 | -192 | 1.07 | 0.74 | 0.33 |
| Columbus, GA | 1,919 | 835 | 1,084 | -249 | 0.34 | 0.14 | 0.2 |
| Wilmington | 1,913 | 929 | 984 | -55 | 0.79 | 0.6 | 0.19 |
| La Crosse | 1,727 | 647 | 1,080 | -433 | 1.45 | 0.42 | 1.03 |
| Reno | 1,658 | 677 | 981 | -304 | 1.06 | 0.51 | 0.56 |
| Greenville, SC | 1,655 | 762 | 893 | -131 | 0.71 | 0.33 | 0.38 |
| Lansing | 1,497 | 489 | 1,008 | -519 | 0.72 | 0.32 | 0.41 |
| Wausau | 1,451 | 519 | 932 | -413 | 1.88 | 0.52 | 1.36 |
| Albany, GA | 1,377 | 540 | 837 | -297 | 0.33 | 0.16 | 0.17 |
| Traverse City | 1,243 | 489 | 754 | -265 | 0.22 | 0.074 | 0.15 |
| Marquette | 1,171 | 554 | 617 | -63 | 0.23 | 0.069 | 0.16 |
| Erie | 1,168 | 423 | 745 | -322 | 0.95 | 0.18 | 0.77 |
| National Cable | 1,062 | 718 | 344 | 374 | 6.18 | 3.52 | 2.67 |
| Tallahassee | 942 | 566 | 376 | 190 | 0.22 | 0.15 | 0.073 |
| National Network | 754 | 587 | 164 | 423 | 15.47 | 10.5 | 5.01 |
| South Bend | 650 | 263 | 387 | -124 | 0.18 | 0.11 | 0.072 |
| Norfolk | 574 | 236 | 338 | -102 | 0.25 | 0.084 | 0.17 |
| Minneapolis | 492 | 151 | 341 | -190 | 0.41 | 0.14 | 0.27 |
| Yuma-El Centro | 308 | 248 | 60 | 188 | 0.092 | 0.079 | 0.013 |
| Youngstown | 289 | 271 | 18 | 253 | 0.08 | 0.08 | 0.001 |
| Chattanooga | 287 | 273 | 14 | 259 | 0.037 | 0.037 | 0.001 |
| Omaha | 280 | 262 | 18 | 244 | 0.46 | 0.46 | 0.001 |
| Alpena | 209 | 126 | 83 | 43 | 0.2 | 0.1 | 0.1 |
| Albuquerque | 208 | 191 | 17 | 174 | 0.029 | 0.029 | 0.002 |
| Myrtle Beach | 175 | 159 | 16 | 143 | 0.029 | 0.029 | 0.001 |
| Toledo | 152 | 138 | 14 | 124 | 0.039 | 0.039 | 0.001 |
| San Diego | 130 | 66 | 64 | 2 | 0.037 | 0 | 0.037 |
Figures are from October 21 to October 27, 2024.
Numbers include local broadcast television for all sponsors in each market. National cable and national network airings are shown in separate rows.
CITE SOURCE OF DATA AS: Vivvix CMAG with analysis by the Wesleyan Media Project.
Figure 5: Presidential Advertising Advantages by Media Market and Party
Figures are from July 22 to October 27, 2024 and October 21 to October 27, 2024.
Numbers include local broadcast television for all presidential sponsors (excluding national network and cable airings, which advantage Harris).
CITE SOURCE OF DATA AS: Vivvix CMAG with analysis by the Wesleyan Media Project.
Harris Closing Out Campaign with Pitch on Women’s Rights; Trump Returns to Immigration Focus Alongside Taxes
The Harris campaign has returned to the issues of women’s rights and abortion in its final campaign messages, with 71 percent of ads sponsored by the campaign in the past week touching on these issues (Table 9). About half of Harris ads have mentioned taxes, health care and the economy as well. The pro-Harris super PAC, FF PAC, has focused on taxes and the economy during the past week.
Almost all of the Trump campaign’s ads have focused on the issue of taxes, and most have mentioned immigration. The pro-Trump super PAC MAGA, Inc.’s advertising has focused on public safety and immigration.
Table 9: Top Issues by Sponsor in Presidential Race (October 21-27)
| Pro-Dem | Issue | % of Airings | Pro-Rep | Issue | % of Airings |
|---|---|---|---|---|---|
| HARRIS, KAMALA | Women's rights | 71.3% | TRUMP, DONALD | Taxes | 97.3% |
| (29,332 airings) | Abortion | 71.3% | (38,302 airings) | Immigration | 82.0% |
| Taxes | 53.5% | Economy | 56.2% | ||
| Health care | 51.3% | Inflation | 56.2% | ||
| Economy | 48.5% | Budget | 55.8% | ||
| Inflation | 46.2% | Health care | 36.1% | ||
| Medicare | 42.1% | Senior citizens | 24.9% | ||
| Social security | 42.1% | Social Security | 24.9% | ||
| Domestic abuse | 20.8% | Medicare | 23.1% | ||
| FF PAC | Taxes | 69.7% | MAGA INC | Public safety | 98.7% |
| (21,690 airings) | Economy | 63.3% | (10,341 airings) | Immigration | 69.0% |
| Social Security | 37.0% | Terrorism | 39.9% | ||
| Inflation | 27.4% | ||||
| Health care | 24.0% | ||||
| Retirement | 20.1% | ||||
| Medicare | 16.9% | ||||
| Figures are from October 21-27, 2024. Numbers include local broadcast television, national network, and national cable for all sponsors. CITE SOURCE OF DATA AS: Vivvix CMAG with analysis by the Wesleyan Media Project. |
|||||
Super PACs Most Active Outside Group in Fall Campaign, but Most Only Disclose A Portion of Their Donors
In partnership with OpenSecrets, the Wesleyan Media Project also tracks outside group ad spending by the type of donor disclosure. We classify groups as full-disclosure groups (meaning they disclose contributor lists to the relevant reporting agency at the federal or state level), non-disclosing dark money groups (which are not required to disclose publicly their donors; these are most often 501c4 non-profits), and partial-disclosure groups (those that disclose donors but also accept contributions from dark money sources; many Super PACs fall into this category).
We show in Table 10 the top outside groups by ad airings since September 1, looking at federal races and gubernatorial campaigns. The top group is WinSenate, which is a pro-Democratic partial disclosing Super PAC. WinSenate has aired ads in nine Senate races since September 1. The top pro-Republican group is Congressional Leadership Fund (CLF), which has sponsored over 81,000 spots in 33 different House campaigns. CLF is a Carey PAC, meaning it maintains both a super PAC account that funds ads and a traditional PAC account that makes small direct contributions to candidates.
Table 10: Top Groups Active in Elections (September 1-October 27, 2024)
| Sponsor | Party Lean | Group Type | Disclose Donors? | Races | Ad Airings |
|---|---|---|---|---|---|
| WinSenate | Dem | SuperPAC | P | Sen-PA, Sen-WI, Sen-MD, Sen-MI, Sen-AZ, Sen-TX, Sen-NV, Sen-OH, Sen-MT | 98,965 |
| Congressional Leadership Fund | Rep | Carey | P | MI08, MI07, NM02, AK01, OH09, CA45, AZ01, MI10, NE02, OH13, NY22, PA08, PA10, CO08, WI03, OR05, VA07, NY17, CA27, CA22, IA01, ME02, AZ06, NY19, NY04, PA07, NJ07, TX34, CA41, CA13, IA03, NC01, VA02 | 81,736 |
| Senate Leadership Fund | Rep | SuperPAC | P | Sen-MT, Sen-WI, Sen-NE, Sen-PA, Sen-OH, Sen-NV, Sen-MI | 70,392 |
| House Majority PAC | Dem | Carey | P | CO08, NE02, ME02, OR04, CA13, NC01, CA41, CT05, AZ01, CA49, MT01, OH13, CA22, IA03, AZ06, MI07, NY19, CA27, NJ07, NY22, OH09, OR05, PA07, PA08, NY18, MI08, CA45, WI03, TX15, WA03, NY04, VA07, IA01, NY17, VA02, PA10, MI10, TX34, NM02, CA47 | 68,414 |
| FF PAC | Dem | Carey | P | Pres | 63,107 |
| Make America Great Again Inc. | Rep | SuperPAC | Y | Pres | 40,949 |
| American Crossroads | Rep | SuperPAC | P | Sen-PA, Sen-OH, Sen-MT | 33,233 |
| Fairshake | Dem/Rep | SuperPAC | Y | NY03, CA27, IL17, CA45, NC01, CO08, CA40, OR05, NV04, WI01, AZ06, IL13, MN02, AK01, CA22, NY18, TX15, IA03 | 15,743 |
| Last Best Place PAC | Dem | SuperPAC | N | Sen-MT | 15,241 |
| Preserve America PAC | Rep | SuperPAC | Y | Pres | 15,204 |
| Defend American Jobs | Rep | SuperPAC | Y | Sen-OH | 13,169 |
| Keystone Renewal PAC | Rep | SuperPAC | P | Sen-PA | 11,286 |
| Climate Power Action & FF PAC | Dem | SuperPAC | P | Pres | 10,170 |
| Retire Career Politicians PAC | Ind | SuperPAC | P | Sen-NE | 9,298 |
| Maryland's Future | Rep | SuperPAC | Y | Sen-MD | 8,344 |
| Protect Progress | Dem | SuperPAC | Y | Sen-AZ, Sen-MI | 7,439 |
| Project Freedom Llc | Dem | Corp | N | Pres | 7,035 |
| Win It Back PAC | Rep | SuperPAC | Y | PA10, Sen-AZ, Sen-TX, Sen-NV | 6,908 |
| Truth And Courage PAC | Rep | SuperPAC | P | Sen-TX | 6,505 |
| LCV Victory Fund & FF PAC | Dem | SuperPAC | P | Pres | 5,759 |
| Total Top 20 | 588,897 | ||||
| Total All Groups | 685,349 | ||||
| Figures are from September 1 to October 27, 2024. Numbers include local broadcast television, national network, and national cable for all sponsors. CITE SOURCE OF DATA AS: Vivvix CMAG with analysis by the Wesleyan Media Project. Disclosure labels are provided by OpenSecrets. |
|||||
All told, outside groups have sponsored 35 percent of all federal election spots in the 2023-24 election cycle.
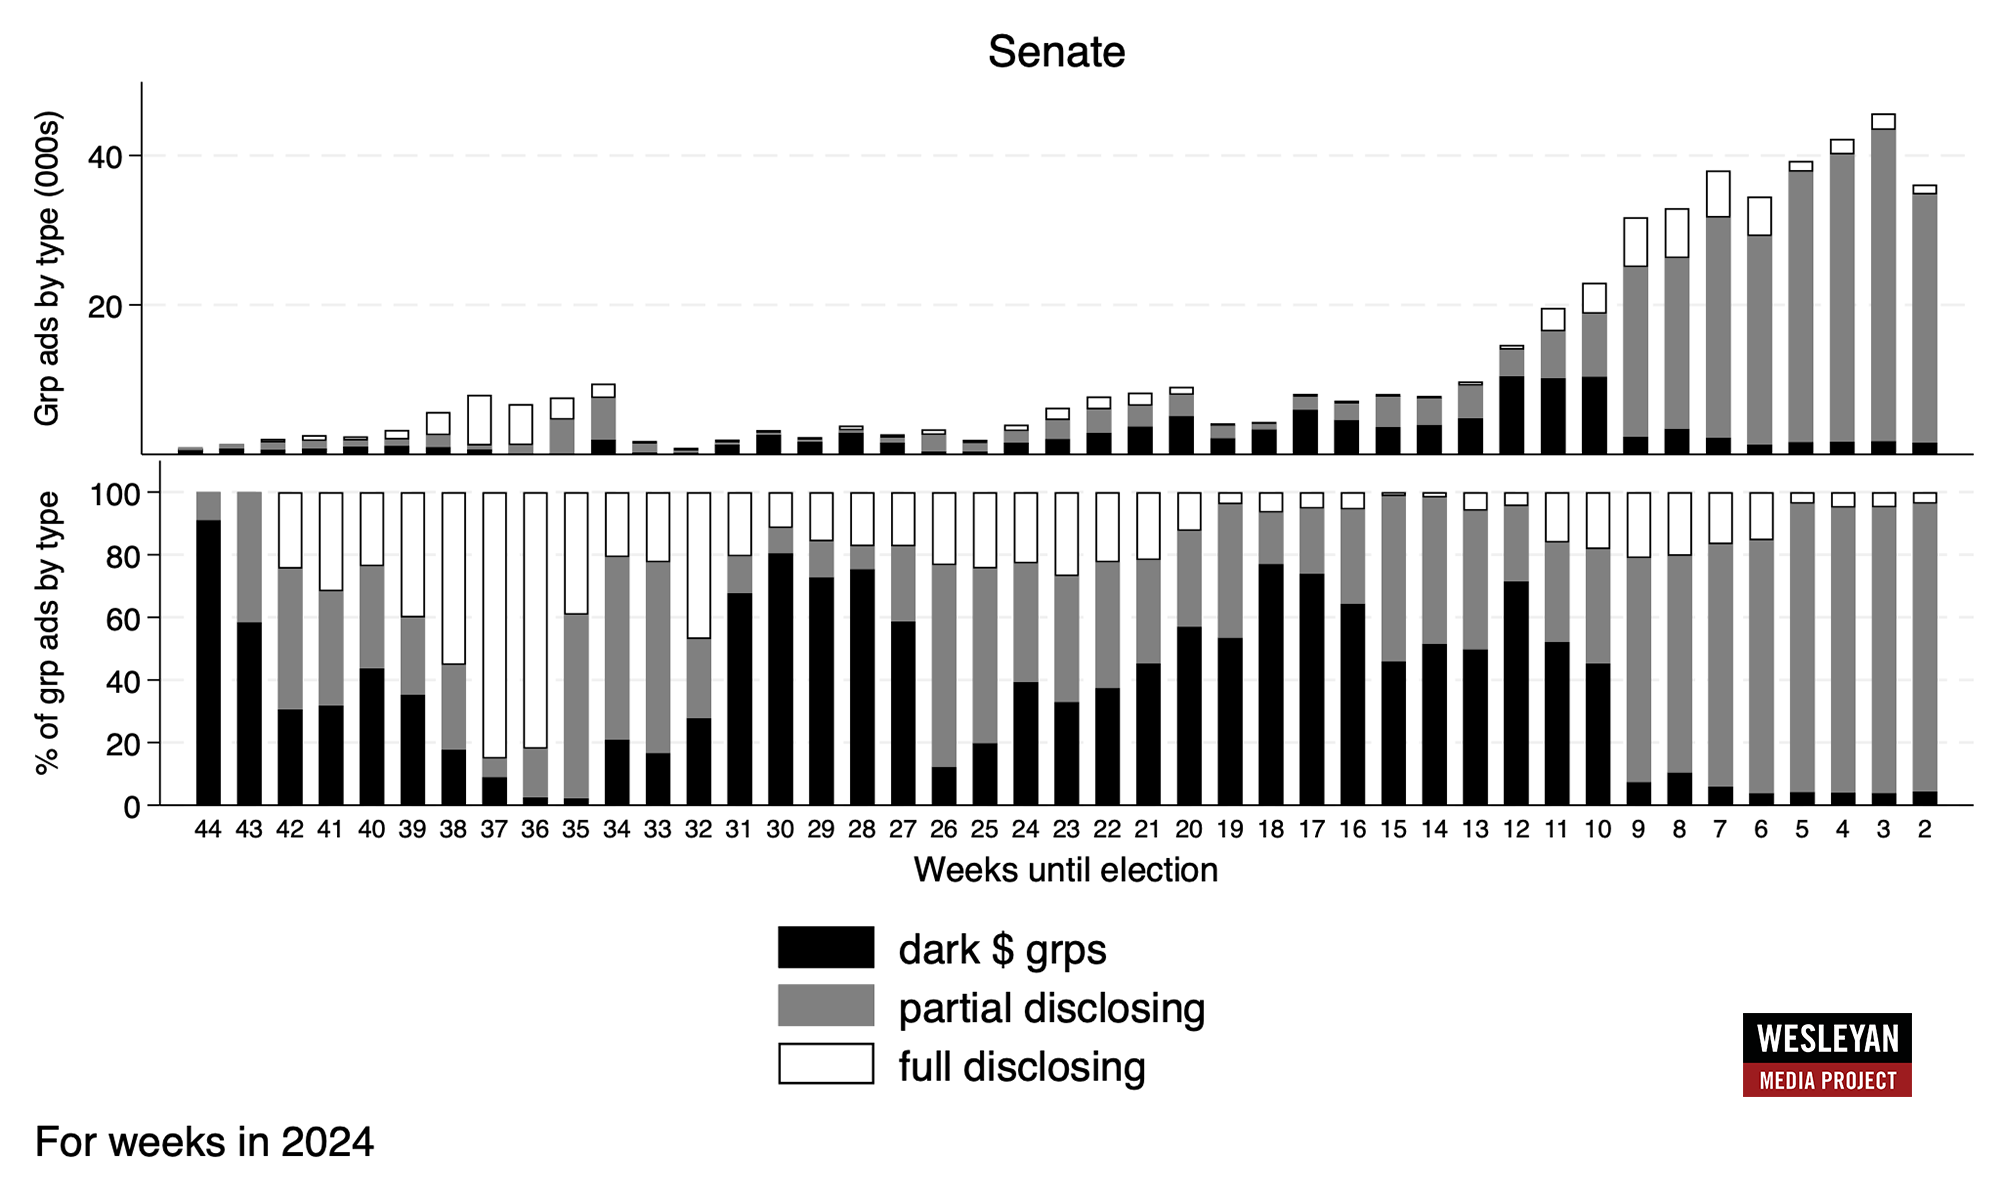
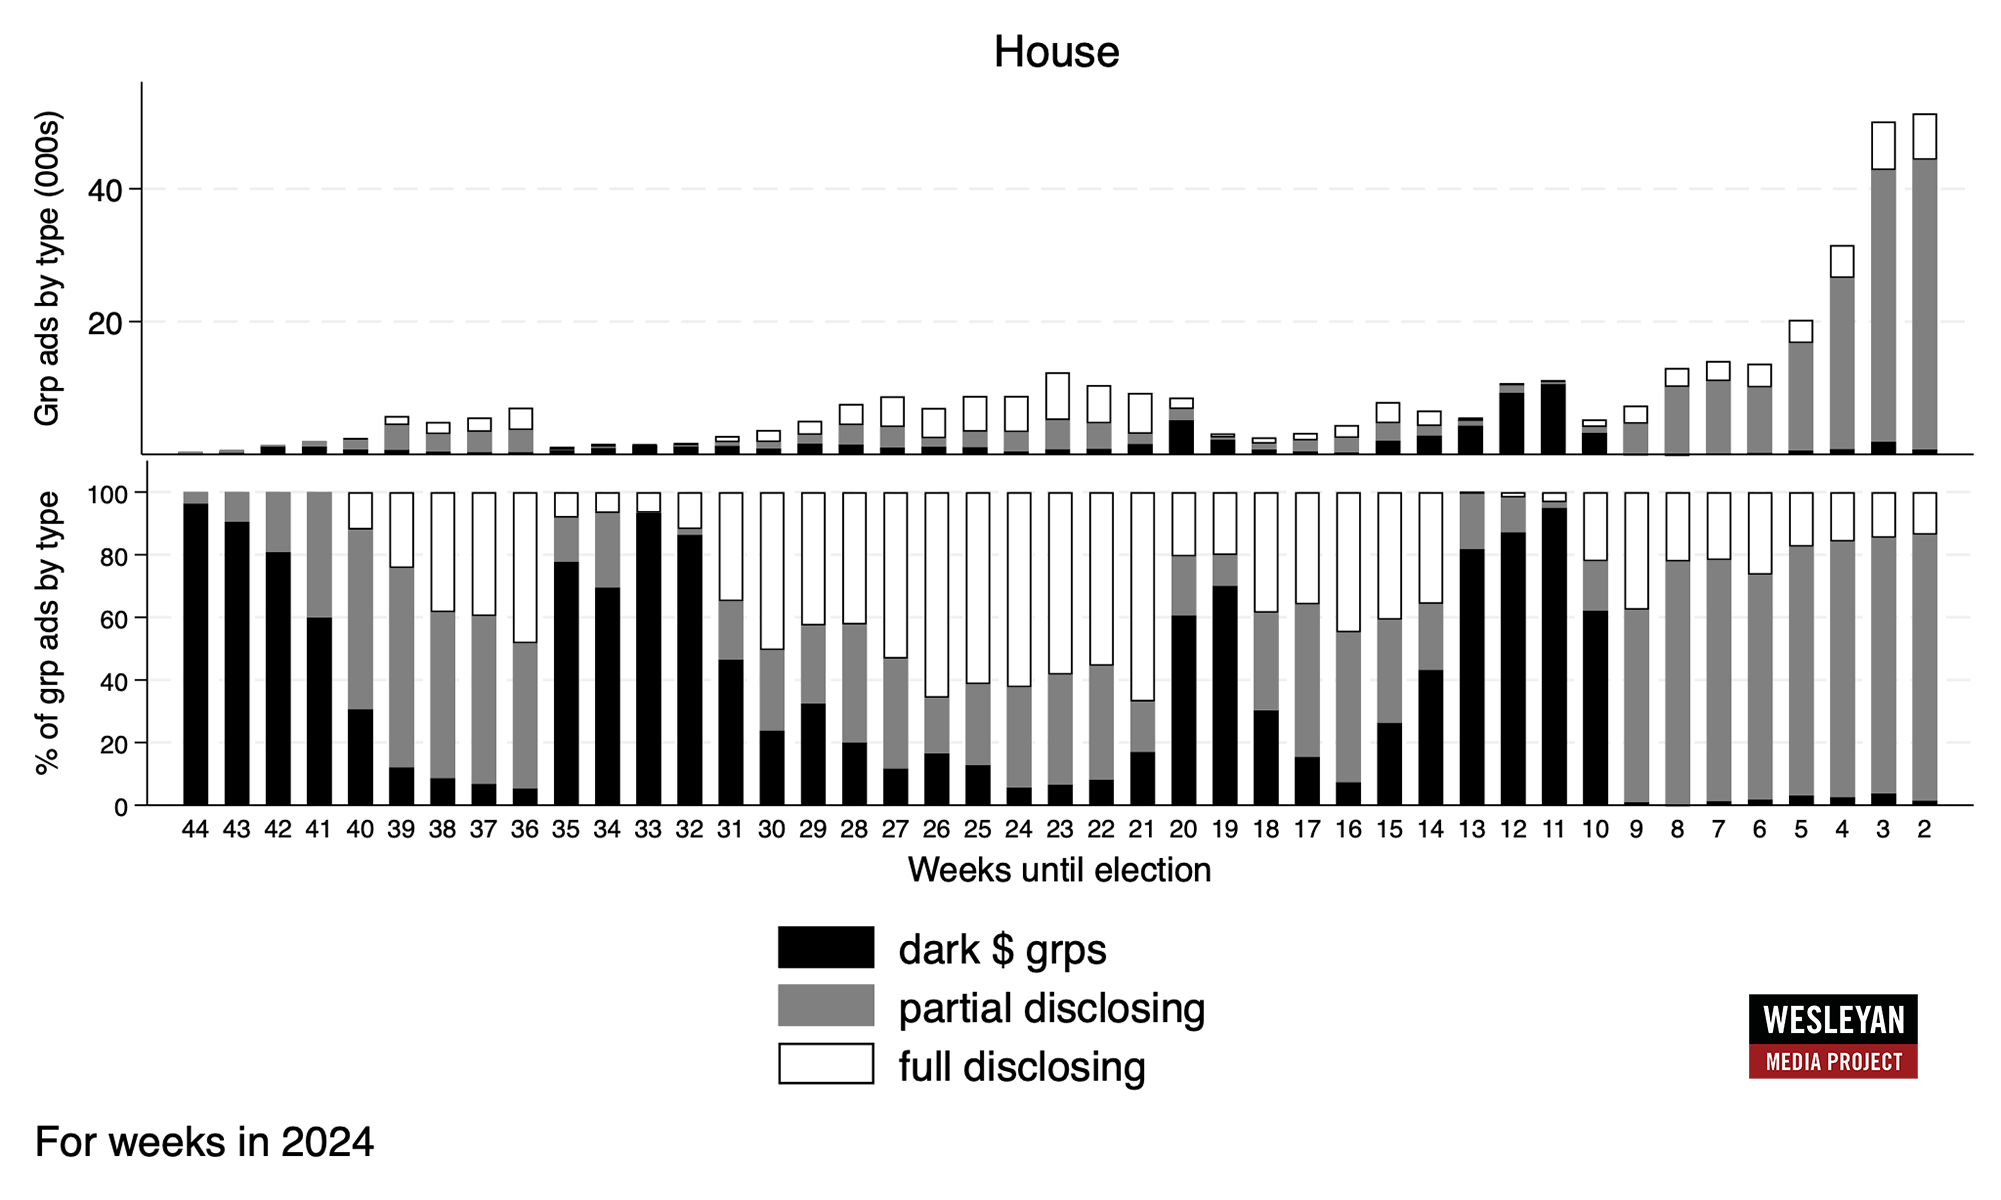
To get a deeper sense of the volume and scope of these outside group efforts in House and Senate races, we show in Figure 6 (for Senate) and Figure 7 (for House) the volume of broadcast ads by outside groups over the course of 2024. In the top panel, we show the volume of ads by group disclosure type for each week in the election year. The bottom panel shows the percentage of group-sponsored ads aired each week by disclosure type.
For both House and Senate races, the volume of ads by groups rises considerably as Election Day approaches, particularly in House races over the last few weeks. Notably the vast majority of outside group ads in the past seven weeks are from partial disclosing groups. These are groups that also accept contributions from dark money sources, making it hard to track the underlying source of the group’s funding. A spike in partial disclosing groups matches the start of the 60-day pre-election window, where outside group ads must be reported to the Federal Election Commission if they mention or picture a federal candidate. By funding those ads through partial disclosing super PACs, the sponsors can still obscure their underlying donor base.
Figure 6: Group Ads in Senate Races by Week
Figures are from January 1 to October 27, 2024.
Numbers include local broadcast television, national network, and national cable for all sponsors.
CITE SOURCE OF DATA AS: Vivvix CMAG with analysis by the Wesleyan Media Project. Disclosure labels are provided by OpenSecrets.
Figure 7: Group Ads in House Races by Week
Figures are from January 1 to October 27, 2024.
Numbers include local broadcast television, national network, and national cable for all sponsors.
CITE SOURCE OF DATA AS: Vivvix CMAG with analysis by the Wesleyan Media Project. Disclosure labels are provided by OpenSecrets.
Digital Spending on Facebook and Instagram by Geography
In case you missed it, the Wesleyan Media Project recently shared a new web app. This web app was developed by Kelleigh Entrekin ‘25, with the support of Pavel Oleinikov and Sebastian Zimmeck, as part of the Cross-platform Election Advertising Transparency Initiative (CREATIVE). It was inspired by the Regional Ad Spending Web App.
Please click here (or click the image below) to use this interactive tool.
About the Data
All television, addressable (which includes satellite and connected TV from LG Ad Sales), and radio data reported here are from Vivvix CMAG. Unless otherwise specified, most advertising references refer to broadcast television. All cost estimates for television are precisely that: estimates.
Meta spending data come from the aggregate reports, which provide spending information for each page name and disclaimer combination. Totals in this report reflect spending between January 1, 2023, July 22, 2024, or October 20, 2024, and October 26, 2024. These totals are calculated by subtracting the reported cumulative spending (as reported by Facebook as the total spent since May 2018) for the October 26, 2024 report and subtracting the cumulative spending reported for December 31, 2022, July 21, 2024, or October 19, 2024.
Spending by Biden/Harris includes: spending on the Joe Biden page from Biden Victory Fund, DNC and Biden for President, Biden for President; spending on the Kamala HQ page from Biden Victory Fund and Harris Victory Fund; spending on the Kamala Harris page from Biden Victory Fund, DNC Services Corp., Harris for President and Harris Victory Fund; spending on the Tim Walz, Gwen Walz, Aurora Jamesand Douglas Emhoff pages by Harris Victory Fund; Biden for President spending on the Complex, Headlines 2024, The Voices of Today and The Daily Scroll pages, Biden Victory Fund spending on the Democratic Party page, and Harris for President spending on the Essence, Glamour, Headlines 2024, The Voices of Today and Memericans pages. Spending by Trump includes: spending on the Donald J. Trump page by the Trump National Committee JFC, Donald J. Trump for President 2024, Inc., Trump 47 Committee, Inc., and Trump Save America Joint Fundraising Committee; Trump Save America Joint Fundraising Committee and Save American Joint Fundraising Committee spending on the Team Trump page; Donald J. Trump for President 2024, Inc, Trump National Committee JFC and Trump 47 Committee, Inc. spending on the JD Vance page; Trump National Committee JFC spending on the Alina Habba, Karoline Leavitt, and Ronny Jackson pages, and Trump National Committee JFC and Donald J. Trump for President 2024 spending on Lara Trump’s page. Spending by supporting groups for Biden/Harris and Trump are listed in the table notes when they are used.
For Google ads, we downloaded the weekly reports from the platform’s Transparency Report. The totals reflected in this release are current as of October 29, 2024, the day on which we pulled the transparency report. Google only includes spending in federal and state races and only includes weekly totals but lists the sponsor’s EIN or FEC committee ID. Google spending is from the following time periods: January 1, 2023, or October 20, 2024 and October 26, 2024.
Spending by Biden/Harris includes the Biden for President, Harris for President, DNC Services Corp when it appears with Biden or Harris for President, Biden Victory Fund, and Harris Victory Fund advertisers. Spending by Trump includes advertisers Donald J. Trump for President 2024, Inc., Trump Save America Joint Fundraising Committee, and Trump National Committee JFC. Spending by supporting groups for Biden/Harris and Trump are listed in the table notes when they are used.
About this Report
The Wesleyan Media Project provides real-time tracking and analysis of all political television advertising in an effort to increase transparency in elections. Housed in Wesleyan’s Quantitative Analysis Center – part of the Allbritton Center for the Study of Public Life – the Wesleyan Media Project is the successor to the Wisconsin Advertising Project, which disbanded in 2009. It is directed by Erika Franklin Fowler, professor of government at Wesleyan University, Michael M. Franz, professor of government at Bowdoin College and Travis N. Ridout, professor of political science at Washington State University. WMP personnel include Breeze Floyd (Program Manager), Pavel Oleinikov (Associate Director, QAC), Yujin Kim (Post-Doctoral Fellow) and Meiqing Zhang (Post-Doctoral Fellow).
The Wesleyan Media Project’s real-time tracking in 2024 is supported by Wesleyan University and the John S. and James L. Knight Foundation. The Wesleyan Media Project is partnering again this year with OpenSecrets, to provide added information on outside group disclosure and candidate status.
The Wesleyan Media Project’s digital advertising tracking is supported by the contributions of students in Delta Lab, an interdisciplinary research collaborative focusing on computationally-driven and innovative analyses and visualizations of media messaging. We are also grateful to our Coding Supervisors Akhil Joondeph, Cecilia Smith, Saul Ferholt-Kahn, and Emmett Perry and the numerous student research assistants who facilitate additional content analysis of television and digital advertising.
Periodic releases of data will be posted on the project’s website and dispersed via LinkedIn, Bluesky @wesmediaproject.bsky.social and Twitter @wesmediaproject. To be added to our email update list, click here.
For more information contact: media@wesleyan.edu.
About Wesleyan University
Wesleyan University, in Middletown, Conn., is known for the excellence of its academic and co-curricular programs. With more than 2,900 undergraduates and 200 graduate students, Wesleyan is dedicated to providing a liberal arts education characterized by boldness, rigor and practical idealism. For more, visit www.wesleyan.edu.
About the John S. and James L. Knight Foundation
We are social investors who support democracy by funding free expression and journalism, arts and culture in community, research in areas of media and democracy, and in the success of American cities and towns where the Knight brothers once had newspapers. Learn more at kf.org and follow @knightfdn on social media.
