Democratic, Republican TV Ads Almost Equal in Number but Harris Outspending Trump by Nearly 3:1 on Meta and Google
(MIDDLETOWN, CT) September 12, 2024 – The issue discussion in the presidential race has shifted to a focus on the economy, according to a new report from the Wesleyan Media Project that analyzes issue mentions in broadcast ads. This is especially true for Donald Trump, who largely ignored the topic of immigration in his television ads over the last two weeks, focusing instead on the economy, inflation and the price of gas (Table 1).
“In the presidential debate on September 10, former President Donald Trump continued to hammer on the issue of immigration and the border,” said Michael Franz, co-director of the Wesleyan Media Project. “In his TV ads over the last two weeks, however, he has mentioned the economy, inflation, and gas prices in nearly all of his 40,000 ad airings. Immigration has taken a backseat, in comparison–likely an attempt to appeal more to swing voters.”
Likewise, Harris’ top issues over the past two weeks were the economy, inflation and taxes.
But Trump’s interest group allies have remained focused on immigration. Make America Great Again, a super PAC supportive of Trump, has sponsored 22,000 spots over the last two weeks, and immigration was mentioned in nearly every airing.
Vice President Harris has had a wide range of top issues over the last few weeks, with less relative discussion now of public safety and immigration than in the weeks after Joe Biden dropped out of the race in late July. From our last report, Harris focused on immigration and public safety in over half of her ad airings between August 12 and 25. In contrast, over the last two weeks, abortion and women’s rights featured in over 1 in 3 airings from her campaign, a stark change from earlier in the summer. Harris mentioned immigration in only 16 percent of her ads in the last two weeks.
Table 1: Top Issues by Sponsor in Presidential Race (August 26-September 8)
| Issue | % of airings | Issue | % of airings | |||
|---|---|---|---|---|---|---|
| Kamala Harris | Taxes | 51.6% | Donald Trump | Economy | 97.3% | |
| (52,373 airings) | Inflation | 48.8% | (40,296 airings) | Inflation | 97.3% | |
| Economy | 48.8% | Oil/gas | 97.3% | |||
| Women's Rights | 36.3% | Housing | 87.5% | |||
| Abortion | 36.3% | Jobs | 9.7% | |||
| Medicare | 30.9% | |||||
| Social Security | 30.9% | |||||
| Public Safety | 29.8% | |||||
| Housing | 17.6% | |||||
| Immigration | 15.6% | |||||
| Climate Power Action and FF PAC | Prescription Drugs | 100.0% | Make America Great Again | Immigration | 99.8% | |
| (8,854 airings) | Inflation | 100.0% | (22,321 airings) | Public Safety | 58.4% | |
| Taxes | 100.0% | Economy | 41.6% | |||
| Economy | 100.0% | Inflation | 41.6% | |||
| Oil/gas | 72.7% | Drug problems | 10.0% | |||
| Green energy | 27.3% | Jobs | 9.6% | |||
| Utility Rates | 27.3% | |||||
| LCV Victory Fund and FF PAC | Economy | 97.3% | Preserve America PAC | Immigration | 100.0% | |
| (8,837 airings) | Inflation | 97.3% | (5,024 airings) | Public Safety | 79.7% | |
| Taxes | 97.3% | Taxes | 19.9% | |||
| Prescription Drugs | 97.3% | |||||
| Oil/gas | 64.5% | |||||
| Green energy | 35.5% | |||||
| Utility Rates | 35.5% | |||||
| Figures are from August 26 to September 8. Numbers include broadcast television for all sponsors. CITE SOURCE OF DATA AS: Vivvix CMAG with analysis by the Wesleyan Media Project. |
||||||
In Table 2, we show the top broadcast ad sponsors in the presidential race over the last two weeks. All told, pro-Harris forces have aired nearly 74,000 spots, with the Harris campaign responsible for the vast majority of those. FF PAC, in coordination with three other groups, has sponsored nearly 18,000 airings. Pro-Trump forces have nearly matched Democratic efforts, with over 70,000 spots, including 40,000 from the Trump campaign and 22,000 from Make America Great Again. All told, both sides have spent over $120 million in broadcast TV ads in the past two weeks.
Table 2: Top Television Spenders in Presidential Race (8/26-9/8)
| Party | Airings | Cost (in $Ms) |
|
|---|---|---|---|
| Harris, Kamala | Democrat | 52,373 | 35.1 |
| Project Freedom LLC | Democrat | 2,952 | 6.3 |
| FF PAC (w/ Climate Power Action, LCV Victory Fund, Somos PAC) | Democrat | 17,777 | 21.2 |
| Trump, Donald | Republican | 40,296 | 21.6 |
| Make America Great Again Inc. | Republican | 22,321 | 22.5 |
| Preserve America PAC | Republican | 5,024 | 8.4 |
| American Fuel & Petrochemical Manufacturers | Republican | 1,697 | 2.7 |
| All pro-Harris | Democrat | 73,954 | 64.2 |
| All pro-Trump | Republican | 70,364 | 57.4 |
| Figures are from August 26 to September 8. CITE SOURCE OF DATA AS: Vivvix CMAG with analysis by the Wesleyan Media Project. |
|||
Figure 1, which depicts the number of pro-Harris and pro-Trump television ads by day since Biden dropped out in late July, shows that the volume of ads supporting each side has tracked closely over the past couple of weeks, with just a slight dip in Trump ads this past week. (Ad volumes generally decline on the weekends, which accounts for the regular see-saw pattern in the data. Our time period for this report ended on Sunday, September 8.)
Figure 1: Pro-Harris and Pro-Trump Ad Airings by Day
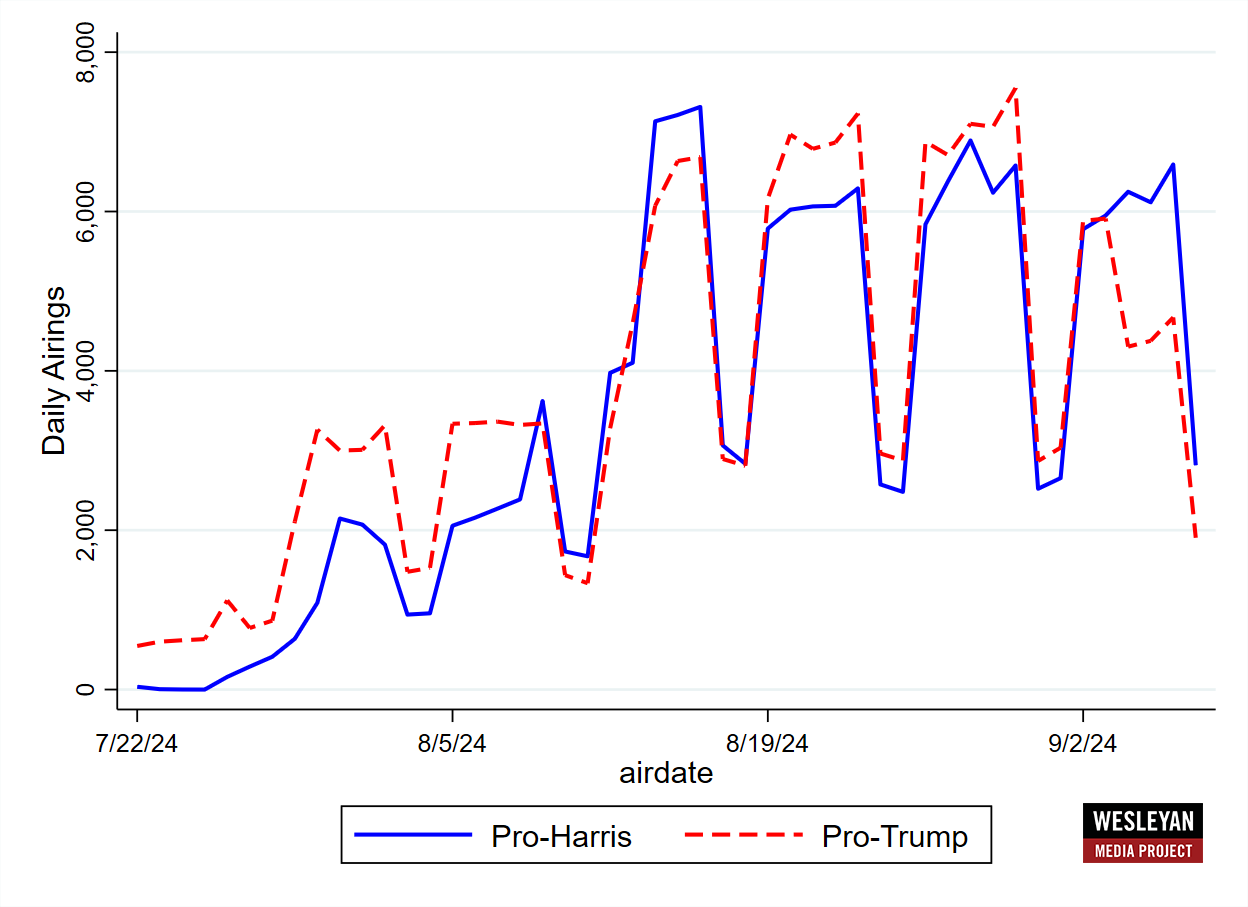
Figures are from July 22 to September 8.
Numbers include broadcast television for all sponsors.
CITE SOURCE OF DATA AS: Vivvix CMAG with analysis by the Wesleyan Media Project.
Pro-Harris Advertisers Ramp Up Attacks
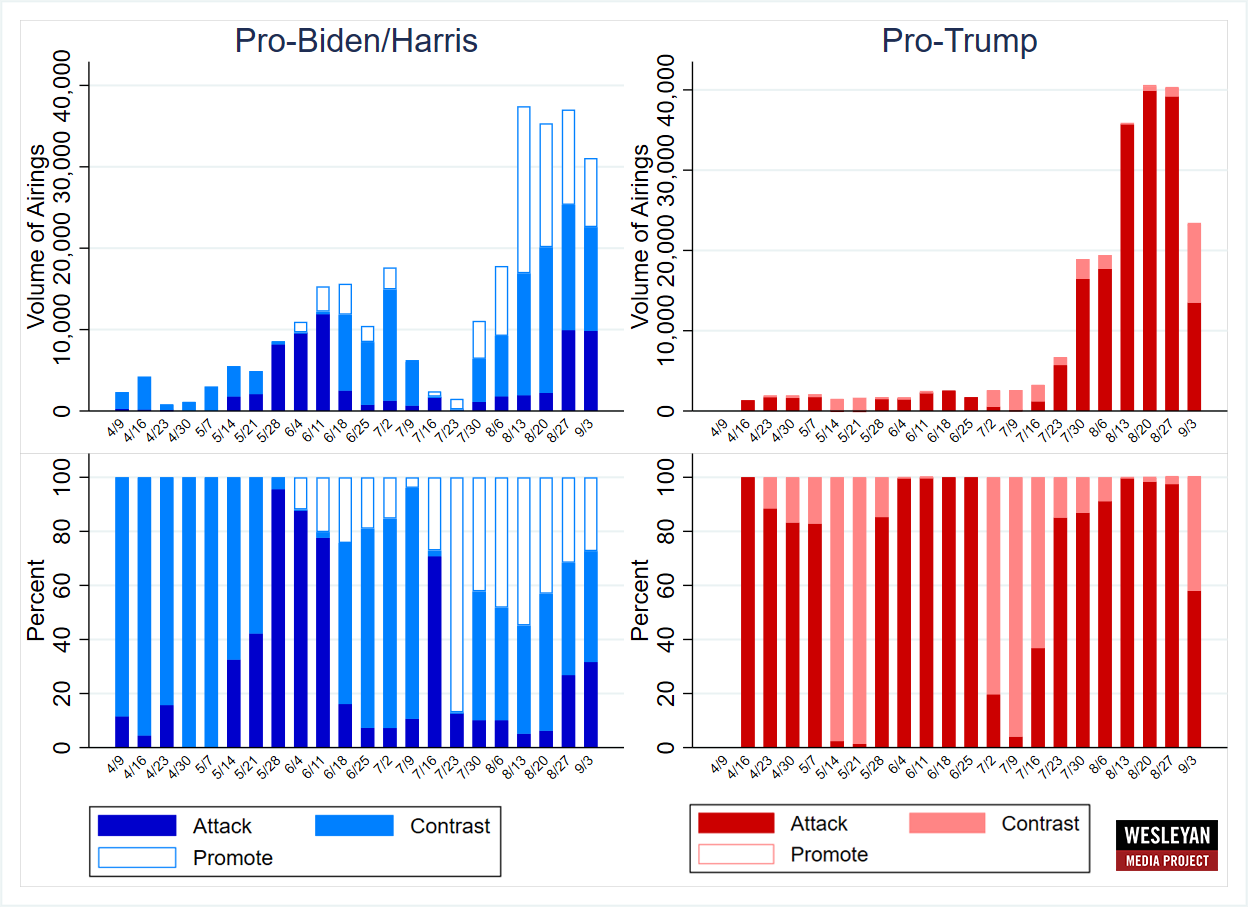
Figure 2 speaks to the tone of political advertising by week for both pro-Trump ads (in red) and pro-Harris and Biden ads (in blue). The top panel speaks to the volume of ads in each week, while the bottom panel shows the percentage of ads that are positive (promotional), contrast and attack (negative). Pro-Harris advertisers have been ramping up the percentage of attack ads over the past weeks, with positive ads declining. On the other side, there has scarcely been a positive ad among pro-Trump advertising, but the percentage of contrast ads increased in the past week.
Figure 2: Tone of Ads in Presidential Election
Figures are from April 9 to September 8.
Numbers include broadcast television for all sponsors.
CITE SOURCE OF DATA AS: Vivvix CMAG with analysis by the Wesleyan Media Project.
Recent TV Ad Volumes Above 2020 Levels
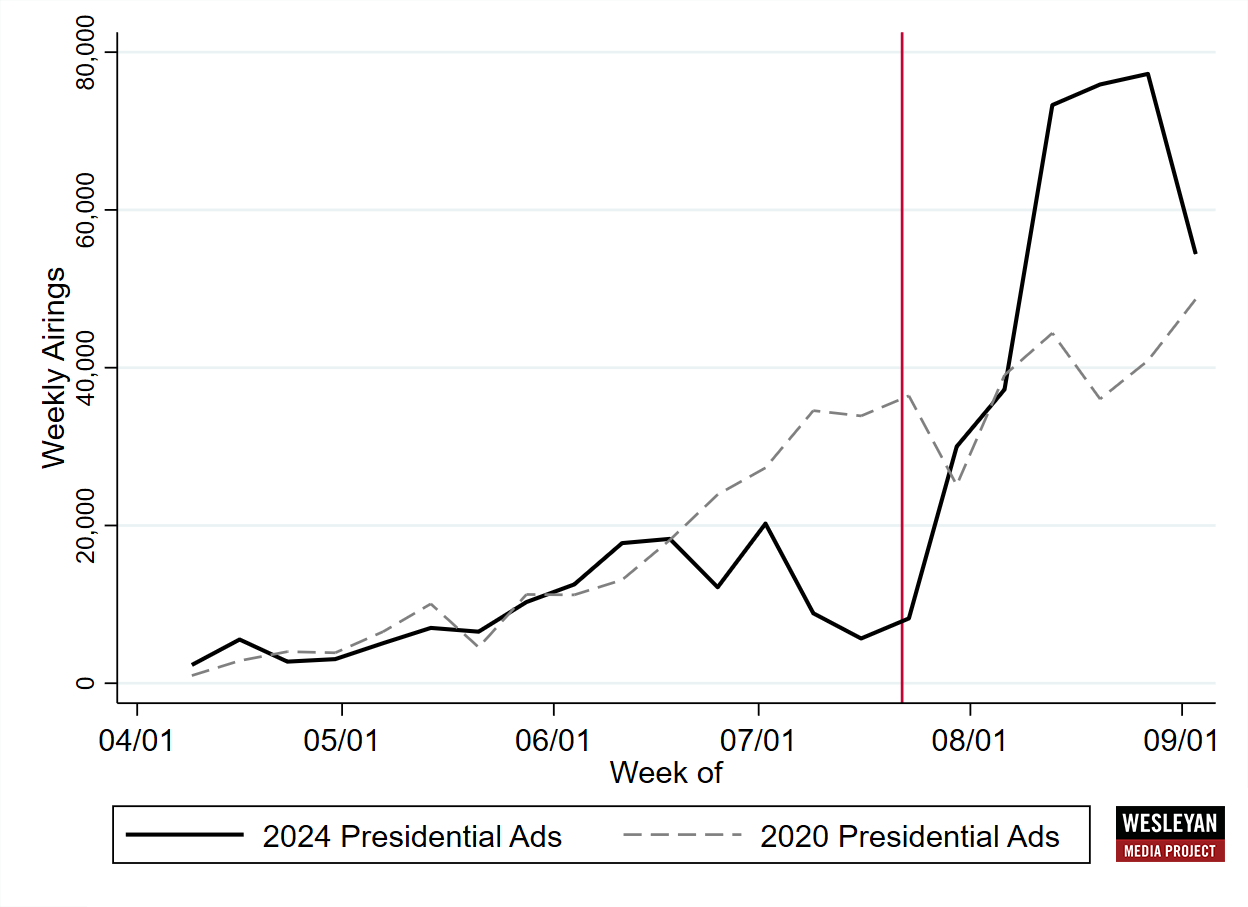
Figure 3 shows the number of broadcast television ads by week in the presidential campaign in both 2020 (the dashed line) and 2024 (the black line). While ad volumes in 2024 were below 2020 levels during the second half of June and July, current-year ad volumes have been well above 2020 levels since the second week of August.
Figure 3: Presidential Ad Volumes in 2020 and 2024
Figures are from April 9 to September 8.
Numbers include broadcast television for all sponsors.
CITE SOURCE OF DATA AS: Vivvix CMAG with analysis by the Wesleyan Media Project.
Harris Spent $100 Million on Digital Ads Since Late July
While the Trump and Harris campaigns remain close in terms of the volume of ads on broadcast television, it is a different story online. Table 3 shows that in the past two weeks, the Harris campaign has spent $18.7 million on Meta and Google platforms compared to $6.41 million for the Trump campaign. These numbers include spending by joint fundraising and party coordinated committees. Since July 22, Harris and affiliated committees have spent just under $100 million on digital ads on the Meta and Google platforms, compared to $18 million for Trump.
Table 3: Digital Advertising Totals by Presidential Candidates
| Meta (in $Ms) | Google (in $Ms) | Total (in $Ms) | ||
|---|---|---|---|---|
| Since July | Harris | $43.93 | $55.19 | $99.13 |
| Trump | $4.46 | $13.68 | $18.14 | |
| Last two weeks | Harris | $7.79 | $10.92 | $18.71 |
| Trump | $1.21 | $5.21 | $6.41 | |
| Figures are from July 22 (for Meta) and July 21 (for Google) to September 7 and from August 25 to September 7. Numbers for both candidates include joint fundraising and coordinated advertising. National party spending is excluded if it occurs only on the national party pages and/or does not contain any reference to a presidential sponsor in the disclaimer. CITE SOURCE OF DATA AS: Meta Ad Library and Google Transparency Report with analysis by the Wesleyan Media Project. |
||||
Pro-Harris Message Edges Pro-Trump Message in Large Markets
In terms of geographic advantages, Vice President Harris is ahead in the largest media markets, with ad advantages (for the period between 8/26 and 9/8) in Phoenix, Atlanta, Las Vegas, Philadelphia and Detroit. In the top ten markets by ad airings, Harris and allies are out-airing Trump and allies in eight of them.
Trump is ahead in smaller media markets that cover more rural areas. In markets outside of the top 20 in terms of ad airings over the last two weeks, Trump has more ads on the air than Harris in twelve of fifteen media markets.
Table 4: Volume of Ad Airings and Spending in Presidential Race (August 26-September 8)
| Market | Airings | Est. Cost (in $Ms) | Dem Spend (in $Ms) | Rep Spend (in $Ms) | Dem airings | Rep airings | Dem Adv. |
|---|---|---|---|---|---|---|---|
| Phoenix | 9,480 | 8.9 | 5.1 | 3.7 | 5,317 | 4,163 | 1,154 |
| Atlanta | 8,068 | 10.6 | 5.4 | 5.3 | 4,168 | 3,900 | 268 |
| Las Vegas | 7,595 | 9.6 | 6.2 | 3.5 | 4,503 | 3,092 | 1,411 |
| Philadelphia | 7,099 | 10.3 | 5.5 | 4.8 | 4,117 | 2,982 | 1,135 |
| Milwaukee | 6,205 | 5.5 | 2.8 | 2.6 | 3,661 | 2,544 | 1,117 |
| Charlotte | 6,145 | 4.4 | 2.2 | 2.1 | 2,768 | 3,377 | -609 |
| Green Bay | 6,037 | 4.1 | 2.0 | 2.0 | 3,984 | 2,053 | 1,931 |
| Detroit | 5,634 | 9.7 | 4.8 | 5.0 | 3,372 | 2,262 | 1,110 |
| Tucson | 5,516 | 2.6 | 1.1 | 1.5 | 2,587 | 2,929 | -342 |
| Grand Rapids | 5,479 | 4.6 | 2.4 | 2.2 | 2,764 | 2,715 | 49 |
| Raleigh | 5,475 | 5.3 | 3.3 | 2.0 | 3,184 | 2,291 | 893 |
| Harrisburg | 5,102 | 3.9 | 1.8 | 2.1 | 2,632 | 2,470 | 162 |
| Pittsburgh | 4,975 | 7.0 | 4.1 | 3.0 | 3,046 | 1,929 | 1,117 |
| Madison | 4,443 | 2.5 | 1.4 | 1.1 | 2,611 | 1,832 | 779 |
| Savannah | 4,077 | 1.8 | 0.7 | 1.2 | 1,750 | 2,327 | -577 |
| Augusta | 3,895 | 0.7 | 0.3 | 0.4 | 1,554 | 2,341 | -787 |
| Johnstown | 3,754 | 1.8 | 0.9 | 0.9 | 1,817 | 1,937 | -120 |
| Greensboro | 3,606 | 1.9 | 1.0 | 0.9 | 1,664 | 1,942 | -278 |
| Flint | 3,372 | 2.4 | 1.3 | 1.0 | 1,642 | 1,730 | -88 |
| Greenville, NC | 3,338 | 2.1 | 1.1 | 1.0 | 1,096 | 2,242 | -1,146 |
| Macon | 3,246 | 0.9 | 0.4 | 0.5 | 1,318 | 1,928 | -610 |
| Wilkes Barre | 3,016 | 2.3 | 1.0 | 1.4 | 1,184 | 1,832 | -648 |
| Reno | 2,991 | 1.7 | 1.0 | 0.7 | 1,239 | 1,752 | -513 |
| Greenville, SC | 2,590 | 1.3 | 0.5 | 0.7 | 1,180 | 1,410 | -230 |
| Wilmington | 2,465 | 0.7 | 0.3 | 0.4 | 823 | 1,642 | -819 |
| Lansing | 2,303 | 2.0 | 0.8 | 1.2 | 935 | 1,368 | -433 |
| Columbus, GA | 2,180 | 0.7 | 0.4 | 0.3 | 1,060 | 1,120 | -60 |
| La Crosse | 2,000 | 0.9 | 0.3 | 0.6 | 794 | 1,206 | -412 |
| Wausau | 1,945 | 1.0 | 0.4 | 0.7 | 723 | 1,222 | -499 |
| Erie | 1,896 | 0.5 | 0.3 | 0.2 | 952 | 944 | 8 |
| Traverse City | 1,881 | 0.5 | 0.2 | 0.3 | 699 | 1,182 | -483 |
| Albany, GA | 1,850 | 0.5 | 0.3 | 0.2 | 895 | 955 | -60 |
| Marquette | 1,770 | 0.2 | 0.1 | 0.1 | 724 | 1,046 | -322 |
| Omaha | 969 | 0.5 | 0.5 | 0.0 | 969 | - | 969 |
| Alpena | 894 | 0.4 | 0.2 | 0.2 | 472 | 422 | 50 |
| Figures are from August 26 to September 8. Numbers include broadcast television for all sponsors. CITE SOURCE OF DATA AS: Vivvix CMAG with analysis by the Wesleyan Media Project. |
|||||||
Figure 4: Party Ad Advantage by Media Market in Presidential Race
Figures are from July 22, 2024 to September 8, 2024 and August 26, 2024 to September 8, 2024.
Numbers include broadcast television for all sponsors.
CITE SOURCE OF DATA AS: Vivvix CMAG with analysis by the Wesleyan Media Project.
Ohio’s Senate Race Most Costly
We also examined ads in congressional and gubernatorial races over the last two weeks. The battle for Montana’s Senate seat has drawn the most advertising, nearly 28,000 ad spots in two weeks, costing about $15 million. A range of outside groups are also active in the race, including WinSenate (a Super PAC associated with Senate Majority PAC) and Last Best Place PAC (a Super PAC closely associated with Majority Forward), both pro-Democratic groups. American Crossroads and Congressional Leadership Fund have been active on the Republican side.
The top six Senate races by ad airings are arguably the most competitive this cycle and key to determining which party wins control of the chamber. Nevada is a seventh competitive state and is eighth in airings over the last two weeks, after Texas. All seven are currently held by Democratic incumbents, though Arizona is an open-seat (with the decision of Kyrsten Sinema to not run for re-election). All seven of these seats have featured high levels of outside spending. In fact, the majority of pro-GOP ads in Montana, Ohio, Pennsylvania, and Michigan have been sponsored by outside groups.
“Democrats need to win all seven highly competitive Senate races this cycle to keep hopes alive of controlling the Senate,” said Travis Ridout, co-director of the Wesleyan Media Project. “In recent weeks they have out-advertised Republicans in five of them, though they have been eclipsed of late in the Ohio and Pennsylvania Senate races.”
In the Ohio race between Democratic incumbent Sherrod Brown and Republican Bernie Moreno, the pro-Republican group, Defend American Jobs, has aired over 7,000 ads in the last two weeks promoting Moreno.
Table 5: Volume of Ad Airings and Spending in Senate Races (August 26-September 8)
| State | Airings | Est. Cost (in $Ms) | Dem Airings | GOP Airings | Dem Adv | Dem % group | Rep % group |
|---|---|---|---|---|---|---|---|
| MT | 27,977 | 15.4 | 15,001 | 12,976 | 2025 | 37.3% | 63.7% |
| OH | 21,248 | 23.6 | 7,423 | 13,825 | -6402 | 45.2% | 84.7% |
| PA | 13,154 | 17.4 | 5,739 | 7,415 | -1676 | 28.4% | 95.2% |
| WI | 10,236 | 8 | 5,561 | 4,675 | 886 | 25.0% | 35.2% |
| MI | 9,097 | 13.6 | 5,687 | 3,410 | 2277 | 25.4% | 50.0% |
| AZ | 7,381 | 6.7 | 6,022 | 1,359 | 4663 | 27.7% | 43.5% |
| TX | 7,316 | 5.9 | 4,541 | 2,775 | 1766 | 0.0% | 46.7% |
| NV | 6,453 | 7.4 | 3,933 | 2,520 | 1413 | 37.7% | 46.1% |
| MO | 4,205 | 2.3 | 2,865 | 1,340 | 1525 | 0.0% | 0.0% |
| MD | 1,945 | 1.9 | 1,611 | 334 | 1277 | 23.3% | 0.0% |
| NM | 1,889 | 0.79 | 696 | 1,193 | -497 | 0.0% | 14.7% |
| RI | 452 | 0.19 | 452 | 0 | 452 | 0.0% | |
| FL | 359 | 0.66 | 105 | 254 | -149 | 0.0% | 100.0% |
| NE* | 282 | 0.11 | 0 | 0 | 0 | ||
| ME* | 118 | 0.1 | 0 | 0 | 0 | ||
| ND | 83 | 0.27 | 83 | 0 | 83 | 0.0% | |
| VA | 80 | 0.09 | 0 | 80 | -80 | 0.0% | |
| MA | 43 | 0.1 | 0 | 43 | -43 | 100.0% | |
| TN | 14 | 0.1 | 0 | 14 | -14 | 0.0% | |
| Figures are from August 26 to September 8. Numbers include broadcast television for all sponsors. *All airings in NE and ME were from candidates running as an Independent. CITE SOURCE OF DATA AS: Vivvix CMAG with analysis by the Wesleyan Media Project. |
|||||||
Top House Races in NY-19, Alaska, AZ-06
Control of the U.S. House is also in play, and we show in Table 6 TV ad totals in the House races (where at least 1,000 ads aired in the last two weeks). NY-19 tops the list, with over 3,400 airings, followed by the at-large seat in Alaska, the 6th congressional district in Arizona, Montana’s first congressional district, and New Mexico’s second congressional district. Of these, outside groups are most active in the Alaska race, which pits the Democratic incumbent Mary Peltola against Republican Nick Begich. Over 1 in 3 ads in that race are from outside groups, including American Action Network (for Begich), Workers for America’s Future (for Peltola), and Fairshake (for Peltola). Notably, Fairshake—a cryptocurrency-backed super PAC—has sponsored ads on behalf of both Democrats and Republicans in the past two weeks.
Pro-Democratic sponsors on TV have out-aired pro-Republican sponsors in nine of the top ten House races by ad airings. In Maine’s second congressional district, for example, Democrat Jared Golden, the Democratic Party, and supportive groups have aired over 5 times as many ads as his opponent (and allies). ME-2 is a “toss up” race in many of the pre-election House ratings.
Table 6: Volume of Ad Airings and Spending in Top House Races (August 26-September 8)
| District | Airings | Est. Cost (in $Ms) | Dem Airings | GOP Airings | Dem Adv | Dem % group | Rep % group |
|---|---|---|---|---|---|---|---|
| NY19 | 3,431 | $1.10 | 2,105 | 1,326 | 779 | 6.0% | 0.1% |
| AK01 | 3,230 | $1.60 | 2,866 | 364 | 2,502 | 35.6% | 40.7% |
| AZ06 | 3,218 | $1.90 | 1,719 | 1,499 | 220 | 0.0% | 18.3% |
| MT01 | 2,646 | $0.42 | 1,759 | 887 | 872 | 0.0% | 0.0% |
| NM02 | 2,642 | $0.78 | 1,632 | 1,010 | 622 | 9.8% | 25.9% |
| NC01 | 2,572 | $2.20 | 2,414 | 158 | 2,256 | 68.7% | 100.0% |
| ME02 | 2,559 | $1.30 | 2,163 | 396 | 1,767 | 38.4% | 30.6% |
| OR05 | 1,938 | $0.97 | 1,539 | 399 | 1,140 | 0.0% | 0.0% |
| CO03 | 1,919 | $0.16 | 1,919 | - | 1,919 | 0.0% | |
| NE02 | 1,863 | $0.91 | 852 | 1,011 | -159 | 28.6% | 32.8% |
| OH09 | 1,765 | $0.61 | 1,097 | 668 | 429 | 4.6% | 0.0% |
| MI08 | 1,754 | $0.95 | 739 | 1,015 | -276 | 12.4% | 0.0% |
| WA03 | 1,691 | $1.20 | 1,637 | 54 | 1,583 | 50.9% | 0.0% |
| IA03 | 1,669 | $0.75 | 1,016 | 653 | 363 | 16.7% | 44.1% |
| PA08 | 1,668 | $0.98 | 1,264 | 404 | 860 | 13.7% | 0.0% |
| NY22 | 1,628 | $0.52 | 1,359 | 269 | 1,090 | 20.4% | 0.0% |
| CT05 | 1,565 | $0.29 | 1,172 | 393 | 779 | 0.0% | 0.0% |
| VA02 | 1,413 | $0.68 | 654 | 759 | -105 | 25.4% | 51.6% |
| CA13 | 1,242 | $0.48 | 1,242 | - | 1,242 | 100.0% | |
| CA22 | 1,215 | $0.36 | 155 | 1,060 | -905 | 100.0% | 27.2% |
| Figures are from August 26 to September 8. Numbers include broadcast television for all sponsors. CITE SOURCE OF DATA AS: Vivvix CMAG with analysis by the Wesleyan Media Project. |
|||||||
Record-Setting House Ad Volumes
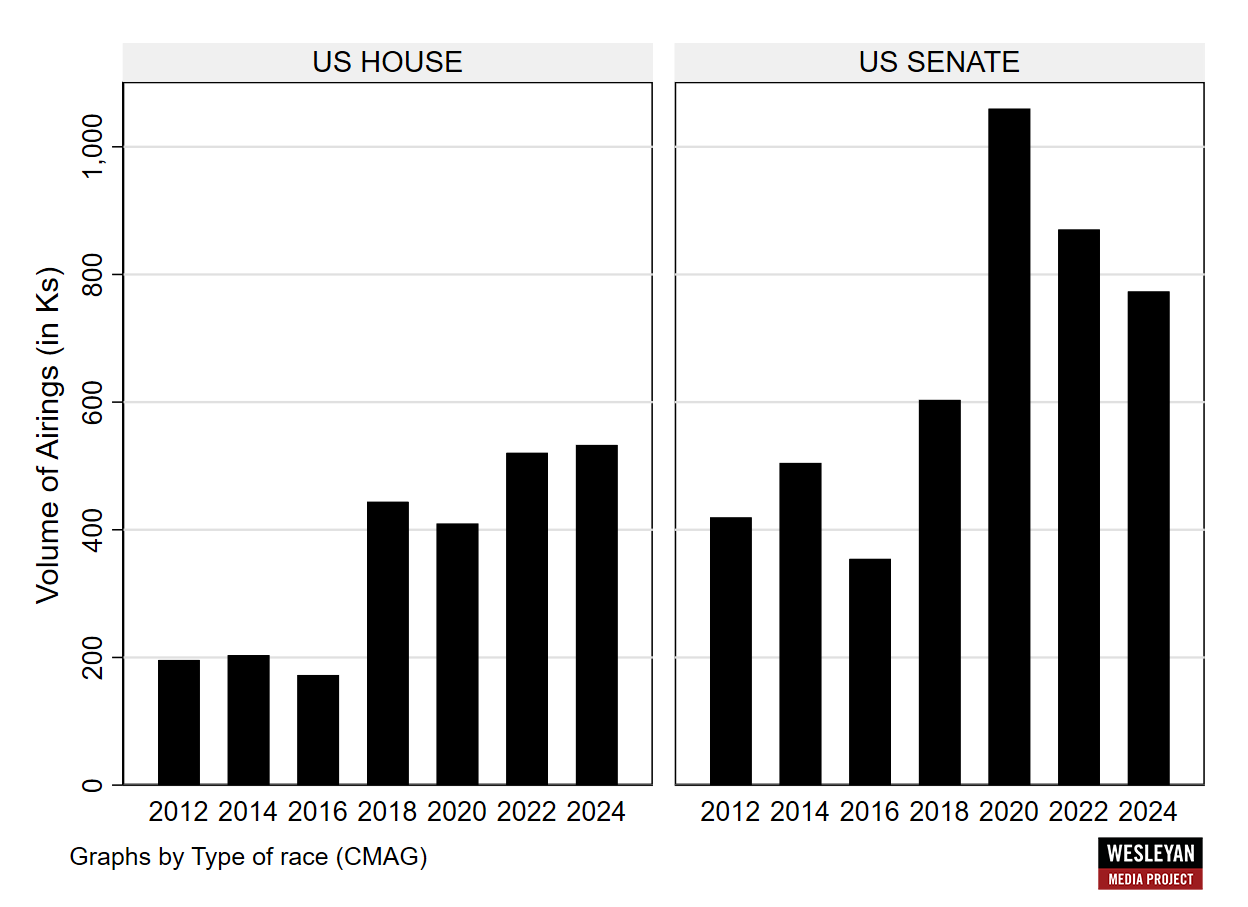
The number of broadcast ad airings in U.S. House races has now sneaked above the number of airings in any other election year since 2012 (Figure 5), setting a record at over 500,000. The volume of broadcast ads in U.S. Senate races, however, is lower than in 2020 and 2022, but is higher than in 2018 and 2012 when the same set of Senate races were on the ballot.
“The volume of House ads is directly tied to the razor thin control that Republicans have in that chamber,” said Erika Franklin Fowler, co-director of the Wesleyan Media Project. “Which party wins control of the House, the Senate, and the White House depends on the outcome of a small number of states and districts, and the House just flipped in 2022. So a lot is riding for each party in these highly competitive districts.”
Figure 5: Volume of Ad Airings by Year (U.S. House and U.S. Senate)
Figures are from January 1 of the off-year to September 8 of the election year.
Numbers include broadcast television for all sponsors.
CITE SOURCE OF DATA AS: Vivvix CMAG with analysis by the Wesleyan Media Project.
Outside Groups Heavily Involved in Congressional Races
In partnership with OpenSecrets, the Wesleyan Media Project also tracks outside group ad spending by the type of donor disclosure. We classify groups as full-disclosure groups (meaning they disclose contributor lists to the relevant reporting agency at the federal or state level), non-disclosing dark money groups (which are not required to disclose publicly their donors; these are most often 501c4 non-profits), and partial-disclosure groups (those that disclose donors but also accept contributions from dark money sources; many Super PACs fall into this category).
We show in Table 7 the top outside groups by ad airings in the past two weeks, looking at House and Senate races. One Nation, a pro-Republican group, has been the most active, with over 9,000 spots spanning five Senate races. The top Democratic group is WinSenate, which is a partial disclosing Super PAC. WinSenate has reported all of its contributions from a different outside group, Senate Majority PAC. WinSenate has aired ads in six Senate races over the past two weeks.
Table 7: Top Groups in House and Senate Races (August 26-September 8)
| Party Lean | Ad Airings | Group Type | Disclose donors? | Active races | |
|---|---|---|---|---|---|
| One Nation | Republican | 9,022 | 501c4 | No | MI-Sen, MT-Sen, NV-Sen, OH-Sen, PA-Sen |
| WinSenate | Democrat | 8,294 | Super PAC | Partial | AZ-Sen, MI-Sen, MT-Sen, NV-Sen, OH-Sen,PA-Sen |
| Defend American Jobs | Republican | 7,268 | Super PAC | Yes | OH-Sen |
| Senate Leadership Fund | Republican | 6,270 | Super PAC | Partial | MT-Sen, OH-Sen, PA-Sen |
| Keystone Renewal PAC | Republican | 4,378 | Super PAC | Partial | PA-Sen |
| House Majority PAC | Democrat | 2,616 | Carey PAC | Partial | CA-13, IA-03, ME-02, MI-07, MI-08, NE-02, NY-22, OH-09, PA-08, VA-02, WA-03 |
| Duty And Honor | Democrat | 2,514 | 501c4 | No | MI-Sen, MT-Sen, OH-Sen, PA-Sen |
| Last Best Place PAC | Democrat | 2,476 | Super PAC | No | MT-Sen |
| American Action Network | Republican | 2,423 | 501c4 | No | AK-01, AZ-01, AZ-06, CA-22, IA-01, MI-10, NC-01, NE-02, NM-02, NY-19, WI-01, WI-03 |
| American Crossroads | Republican | 2,154 | Super PAC | Partial | MT-Sen |
| Protect Progress | Democrat | 1,645 | Super PAC | Yes | AZ-Sen, MI-Sen |
| Workers For America's Future | Democrat | 1,628 | Corp | No | AK-01, ME-02, TX-34, WA-03 |
| House Majority Forward | Democrat | 1,495 | 501c4 | No | CA-13, CA-22, CA-27, CA-45, CO-08, ME-02, NC-01, NM-02, NY-04, NY-17, NY-19, PA-07, VA-02 |
| Saving Texas | Republican | 1,295 | 501c4 | No | TX-Sen |
| Fairshake* | Dem and Rep | 1,249 | SuperPAC | Yes | AK-01, CO-08, IA-03, NC-01 |
| Win It Back PAC | Republican | 1,020 | SuperPAC | Yes | AZ-Sen, NV-Sen |
| More Jobs Less Government | Republican | 1,019 | SuperPAC | Yes | MT-Sen |
| Women Vote | Democrat | 918 | SuperPAC | Partial | MD-Sen, WI-Sen |
| Project 72 WI Inc. | Democrat | 831 | SuperPAC | Partial | WI-Sen |
| Figures are from August 26 to September 8. Only shows groups with >500 ad airings. *Fairshake has aired ads for both Democratic and Republican candidates. CITE SOURCE OF DATA AS: Vivvix CMAG with analysis by the Wesleyan Media Project in partnership with Open Secrets. |
|||||
Governor Ads Concentrated in NC, NH
We also report advertising totals in gubernatorial campaigns in Table 8. Two races stand out with significant advertising over the past two weeks. These are in North Carolina and New Hampshire. In both, the seats are open. In New Hampshire, the Republican nominee is former U.S. Senator Kelly Ayotte, though she secured the nomination only this week in the state’s September 10 primary. She will face off against Joyce Craig, who won her primary in a close election. As such, many of the ads in the state in the period covered here were devoted to the primary election.
Table 8: Volume of Ad Airings and Spending in Top Governor Races (August 26-September 8)
| State | Airings | Est. Cost (in $Ms) | Dem Airings | GOP Airings | Dem Adv. | Dem % group | Rep % group |
|---|---|---|---|---|---|---|---|
| NC | 8405 | 5.2 | 5,721 | 2,684 | 3,037 | 0% | 0% |
| NH | 4949 | 4.3 | 1,881 | 3,068 | -1,187 | 54% | 0% |
| DE | 1929 | 0.83 | 1,929 | 1,929 | 9% | ||
| IN | 630 | 0.23 | 384 | 246 | 138 | 0% | 45% |
| Figures are from August 26 to September 8. CITE SOURCE OF DATA AS: Vivvix CMAG with analysis by the Wesleyan Media Project. |
|||||||
About the Data
Television ad totals reported here are from Vivvix CMAG and (unless otherwise specified) refer to broadcast television. All cost estimates for television are precisely that: estimates.
Meta spending data come from the aggregate reports, which provide spending information for each page name and disclaimer combination. Totals in this report reflect spending between January 1, 2023, July 22, 2024, August 25, 2024 and September 7, 2024. These totals are calculated by subtracting the reported cumulative spending (as reported by Facebook as the total spent since May 2018) for the September 7, 2024 report and subtracting the cumulative spending reported for January 1, 2023, and July 21, 2024.
Spending by Biden/Harris includes: spending on the Joe Biden page from Biden Victory Fund, DNC and Biden for President, Biden for President; spending on the Kamala HQ page from Biden Victory Fund and Harris Victory Fund; spending on the Kamala Harris page from Biden Victory Fund, DNC Services Corp., Harris for President and Harris Victory Fund; spending on the Tim Walz page by Harris Victory Fund; Biden for President spending on the Complex and The Daily Scroll pages, and Biden Victory Fund spending on the Democratic Party page. Spending by Trump includes: spending on the Donald J. Trump page by the Trump National Committee JFC, Donald J. Trump for President 2024, Inc., Trump 47 Committee, Inc., and Trump Save America Joint Fundraising Committee; Trump Save America Joint Fundraising Committee on the Team Trump page; Trump National Committee JFC and Trump 47 Committee, Inc. spending on the JD Vance page, and Trump National Committee JFC spending on Lara Trump’s page. Spending by supporting groups for Biden/Harris and Trump are listed in the table notes when they are used.
For Google ads, we downloaded the weekly reports from the platform’s Transparency Report. The totals reflected in this release are from the following time periods: January 1, 2023, or July 21, 2024, August 25, 2024, and September 7, 2024.
Spending by Biden/Harris includes the Biden for President, Harris for President, DNC Services Corp when it appears with Biden or Harris for President, Biden Victory Fund, and Harris Victory Fund advertisers. Spending by Trump includes advertisers Donald J. Trump for President 2024, Inc., Trump Save America Joint Fundraising Committee, and Trump National Committee JFC. Spending by supporting groups for Biden/Harris and Trump are listed in the table notes when they are used.
About this Report
The Wesleyan Media Project provides real-time tracking and analysis of all political television advertising in an effort to increase transparency in elections. Housed in Wesleyan’s Quantitative Analysis Center – part of the Allbritton Center for the Study of Public Life – the Wesleyan Media Project is the successor to the Wisconsin Advertising Project, which disbanded in 2009. It is directed by Erika Franklin Fowler, professor of government at Wesleyan University, Michael M. Franz, professor of government at Bowdoin College and Travis N. Ridout, professor of political science at Washington State University.WMP personnel include Breeze Floyd (Program Manager), Pavel Oleinikov (Associate Director, QAC), Yujin Kim (Post-Doctoral Fellow) and Meiqing Zhang (Post-Doctoral Fellow).
The Wesleyan Media Project’s real-time tracking in 2024 is supported by Wesleyan University and the John S. and James L. Knight Foundation. The Wesleyan Media Project is partnering again this year with OpenSecrets, to provide added information on outside group disclosure and candidate status.
Periodic releases of data will be posted on the project’s website and dispersed via LinkedIn, Bluesky @wesmediaproject.bsky.social and Twitter @wesmediaproject. To be added to our email update list, click here.
For more information contact: Ziba Kashef at mkashef92@wesleyan.edu (please also cc media@wesleyan.edu).
About Wesleyan University
Wesleyan University, in Middletown, Conn., is known for the excellence of its academic and co-curricular programs. With more than 2,900 undergraduates and 200 graduate students, Wesleyan is dedicated to providing a liberal arts education characterized by boldness, rigor and practical idealism. For more, visit www.wesleyan.edu.
About the John S. and James L. Knight Foundation
We are social investors who support democracy by funding free expression and journalism, arts and culture in community, research in areas of media and democracy, and in the success of American cities and towns where the Knight brothers once had newspapers. Learn more at kf.org and follow @knightfdn on social media.