Photo Gage Skidmore/flickr
95 percent of pro-Trump ads attack Harris
(MIDDLETOWN, CT) August 29, 2024 – In recent weeks, former President Donald Trump and his interest group allies have ramped up their spending on broadcast television ads, on many days out-advertising Kamala Harris and her interest group allies. Figure 1 shows the volume of pro-Trump (in red) and pro-Harris (in blue) ads by day. In the last few weeks of July, in fact, Trump out-aired Harris by as many as 1,000 spots on some days. In the closing days of August, pro-Trump forces are again on the air with more ads than pro-Harris sponsors.
Figure 1: Daily Ad Airings in Presidential Election
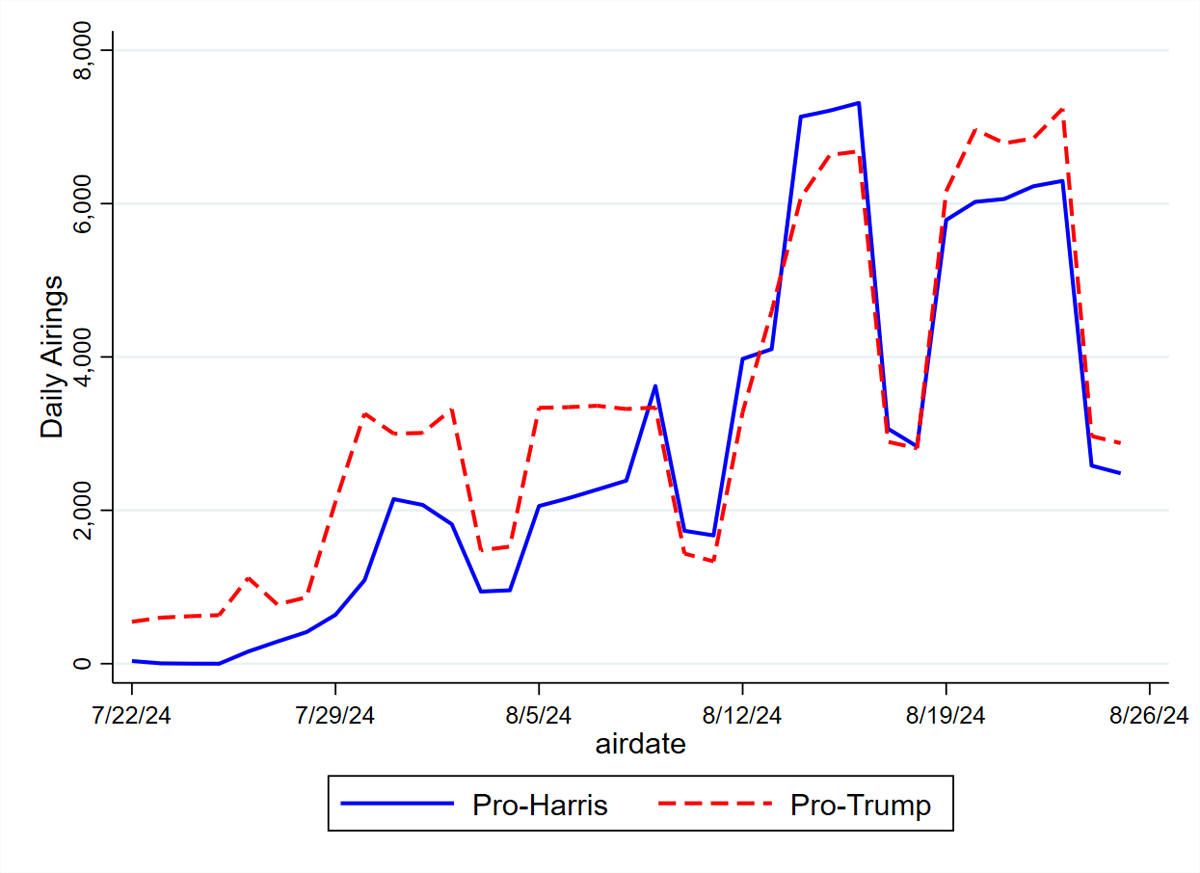
Numbers include broadcast television for all sponsors.
CITE SOURCE OF DATA AS: Vivvix CMAG with analysis by the Wesleyan Media Project.
However, the campaigns are sponsoring very different types of ads, as Figure 2 shows. Since Biden dropped out of the race, 95 percent of pro-Trump ads—and 99 percent of pro-Trump ads in the past two weeks—were pure attack, meaning they focused entirely on attacking Kamala Harris. Indeed, as Trump has ramped up his broadcast advertising since President Biden dropped out of the race, he and his allies have almost exclusively focused on attacking Harris over promoting Trump’s policy agenda. Meanwhile, Harris and her allies have aired a mix of contrast and promotional spots, largely avoiding ads that solely attack Trump. Promotional spots, ones that tout Harris and her background, make up nearly 50 percent of pro-Harris ads since Biden dropped out and Harris became the presumptive nominee.
“Clearly, the Trump campaign is going for broke right now to define Kamala Harris, spending all of its dollars talking about her and not about Trump himself,” said Travis Ridout, co-director of the Wesleyan Media Project. “At the same time, the Harris campaign is working hard to tell voters who Harris is and what she is all about.”
Figure 2: Tone of Ads in Presidential Election
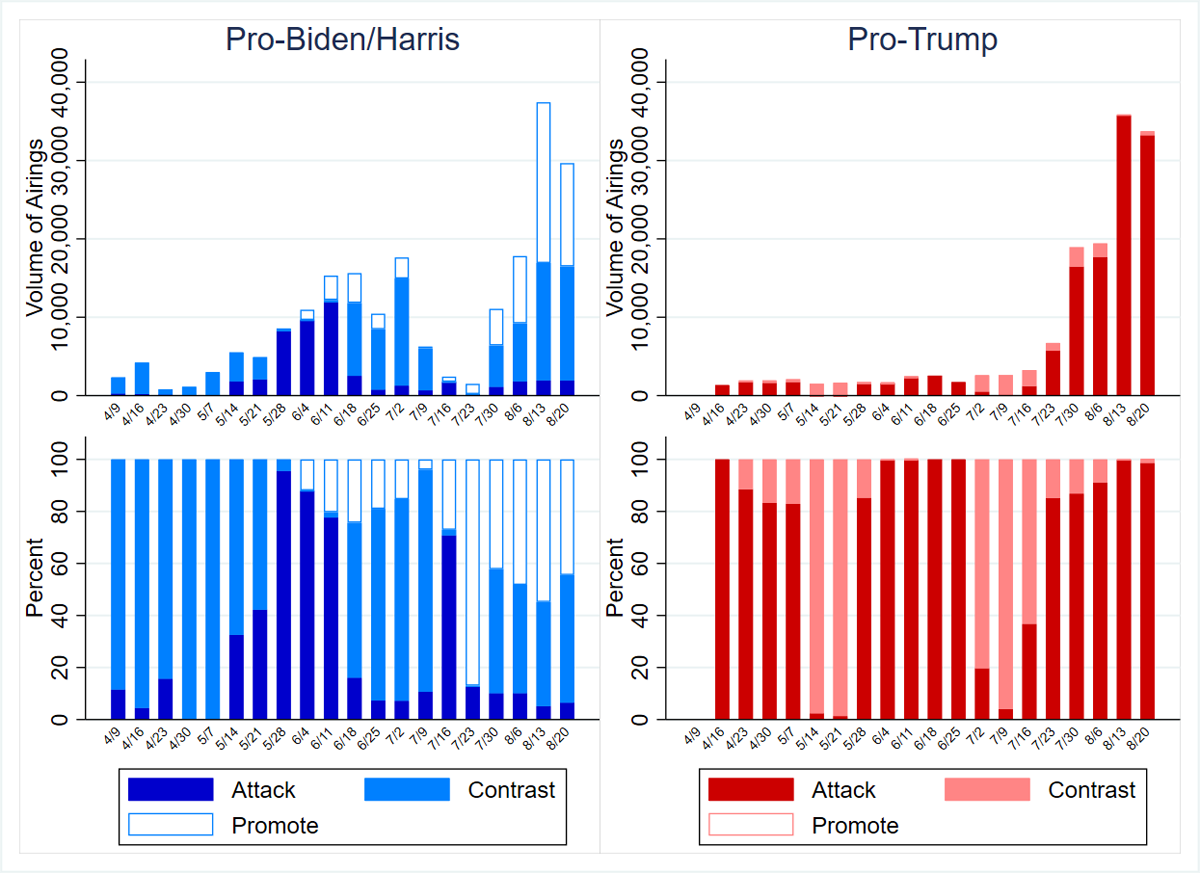
Numbers include broadcast television for all sponsors.
CITE SOURCE OF DATA AS: Vivvix CMAG with analysis by the Wesleyan Media Project.
Harris Campaign Taking on “Republican” Issues Directly
We show in Table 1 the top issues mentioned by the most active television sponsors in the presidential race for the period between August 12 and August 26. On the Republican side, there seems to be a division of labor between Trump and his two most active allies, Preserve America PAC and Make America Great Again. The two groups remain focused on immigration and public safety, along with concerns about drug abuse. The Trump campaign itself, however, has focused over the last two weeks on the economy, inflation, jobs, and energy-related issues. Immigration appears in proportionately fewer of his ads compared to the two pro-Trump groups.
On the Democratic side, Vice President Harris has mentioned public safety and immigration in the majority of her ads, responding head-on to the major attack line against her to-date in the campaign. She has also addressed issues of drugs (typically fentanyl) and opioids in 2 of every 5 airings. The most active pro-Harris group, FF PAC, has focused on the issues of the economy and inflation, and to a lesser extent on public safety. Abortion appears in only 5 percent of Harris’s ads and 19 percent of FF PAC’s ads.
“It seems that the Democrats find some value in addressing the issues that Republicans want to make the centerpiece of their campaign against Kamala Harris,” said Michael Franz, co-director of the Wesleyan Media Project. “Instead of a laser-like focus on issues more common to the Democratic playbook, they have launched Harris’s campaign with a bevy of ad airings on immigration, public safety, and concerns about drug abuse–generally promoting Harris’s record on these topics.”
Table 1: Top Issues by Sponsor in Presidential Race, 8/12 to 8/25
| Pro-Dem | Kamala Harris | Public safety | 53.3% |
| (60,176 airings) | Housing | 52.6% | |
| Immigration | 50.9% | ||
| Prescription drugs | 49.1% | ||
| Taxes | 49.1% | ||
| Health care | 47.5% | ||
| Drug problems | 45.8% | ||
| Opioids | 41.6% | ||
| Financial industry | 7.1% | ||
| Women's rights | 5.1% | ||
| FF PAC | Economy | 74.4% | |
| (5,932 airings) | Inflation | 62.2% | |
| Public safety | 46.4% | ||
| Financial industry | 46.4% | ||
| Housing | 43.4% | ||
| Retirement | 40.9% | ||
| Prescription drugs | 39.3% | ||
| Education | 29.1% | ||
| Abortion | 18.8% | ||
| Jobs | 12.2% | ||
| Pro-Rep | Donald Trump | Economy | 60.1% |
| (38,273 airings) | Inflation | 60.1% | |
| Energy and environment | 60.1% | ||
| Jobs | 59.9% | ||
| Public safety | 39.0% | ||
| Immigration | 39.0% | ||
| Prescription drugs | 11.5% | ||
| Opioids | 11.5% | ||
| Terrorism | 5.7% | ||
| Taxes | 1.4% | ||
| Make America Great Again | Public safety | 99.9% | |
| (27,897 airings) | Immigration | 77.1% | |
| Drug problems | 41.9% | ||
| Budget | 23.0% | ||
| Domestic abuse | 22.9% | ||
| Preserve America PAC | Immigration | 100.0% | |
| (6,159 airings) | Health care | 54.0% | |
| Public safety | 23.3% | ||
| Taxes | 22.6% | ||
| Drug problems | 2.4% | ||
| Prescription drugs | 2.4% | ||
| Opioids | 2.4% | ||
| Figures are from August 12, 2024 to August 25, 2024. CITE SOURCE OF DATA AS: Vivvix CMAG with analysis by the Wesleyan Media Project. |
|||
Harris Focused on Midwest; Trump Focused on Sunbelt
Next, we show the top media markets with broadcast television ads since Biden dropped out on July 21 (Table 2). Trump has bigger ad advantages in battleground states in the South and Southwest, while Harris has the edge in media markets in Wisconsin, Michigan, and Pennsylvania.
“While the battleground consists of three Great Lakes states and four states in the South and West, Harris seems much more focused at this point in the campaign on the Midwest than Trump, while Trump, in general, is investing more than Harris in the Sunbelt,” said Erika Franklin Fowler, co-director of the Wesleyan Media Project.
Table 2: Airings and Spend by Media Market in Presidential Race (July 22 to August 25)
| Market | Airings | Est. Spend (in $Ms) | Dem Airings | Rep Airings | Dem Spend (in $Ms) | Rep Spend (in $Ms) | Dem Advantage |
|---|---|---|---|---|---|---|---|
| Phoenix | 16,090 | 9.8 | 6,830 | 9,260 | 4.1 | 5.6 | -2,430 |
| Philadelphia | 13,199 | 20 | 6,618 | 6,581 | 10.4 | 9.6 | 37 |
| Atlanta | 12,781 | 15.3 | 5,754 | 7,027 | 6.6 | 8.7 | -1,273 |
| Harrisburg | 10,288 | 8.5 | 5,377 | 4,911 | 4.4 | 4.1 | 466 |
| Tucson | 10,225 | 4.6 | 3,658 | 6,567 | 1.1 | 3.5 | -2,909 |
| Las Vegas | 10,051 | 6.3 | 5,148 | 4,903 | 2.9 | 3.4 | 245 |
| Grand Rapids | 9,519 | 6.5 | 5,688 | 3,831 | 4.1 | 2.4 | 1,857 |
| Detroit | 8,864 | 11.8 | 4,814 | 4,050 | 5.7 | 6.1 | 764 |
| Green Bay | 8,820 | 6.5 | 5,288 | 3,532 | 3.9 | 2.6 | 1,756 |
| Pittsburgh | 8,663 | 12.8 | 4,442 | 4,221 | 6.6 | 6.1 | 221 |
| Augusta | 8,567 | 1.4 | 2,961 | 5,606 | 0.54 | 0.83 | -2,645 |
| Johnstown | 8,260 | 3.9 | 3,996 | 4,264 | 2.1 | 1.9 | -268 |
| Savannah | 8,220 | 3.9 | 2,815 | 5,405 | 1.1 | 2.9 | -2,590 |
| Milwaukee | 7,109 | 6.3 | 3,752 | 3,357 | 3.2 | 3.1 | 395 |
| Madison | 6,558 | 3.4 | 3,289 | 3,269 | 1.6 | 1.8 | 20 |
| Macon | 6,066 | 1.5 | 1,774 | 4,292 | 0.41 | 1.0 | -2,518 |
| Charlotte | 5,691 | 2.7 | 1,613 | 4,078 | 0.53 | 2.2 | -2,465 |
| Flint | 5,573 | 3.7 | 2,632 | 2,941 | 2.2 | 1.5 | -309 |
| Wilkes Barre | 5,475 | 4.5 | 2,029 | 3,446 | 2.2 | 2.3 | -1,417 |
| Raleigh | 4,897 | 2.7 | 1,663 | 3,234 | 0.76 | 1.9 | -1,571 |
| Lansing | 4,665 | 3 | 2,162 | 2,503 | 1.9 | 1.1 | -341 |
| Greensboro | 3,643 | 1.1 | 1,193 | 2,450 | 0.22 | 0.82 | -1,257 |
| Traverse City | 3,122 | 0.92 | 1,509 | 1,613 | 0.59 | 0.32 | -104 |
| Reno | 3,115 | 0.91 | 839 | 2,276 | 0.24 | 0.68 | -1,437 |
| Greenville, NC | 3,086 | 0.85 | 482 | 2,604 | 0.13 | 0.71 | -2,122 |
| Columbus, GA | 3,051 | 0.52 | 1,545 | 1,506 | 0.24 | 0.28 | 39 |
| Wilmington | 2,535 | 0.46 | 400 | 2,135 | 0.08 | 0.39 | -1,735 |
| Greenville, SC | 2,252 | 1.2 | 517 | 1,735 | 0.33 | 0.86 | -1,218 |
| Wausau | 1,889 | 1.3 | 1,350 | 539 | 1.2 | 0.17 | 811 |
| La Crosse | 1,846 | 1.1 | 1,479 | 367 | 0.90 | 0.20 | 1,112 |
| Figures are from July 22, 2024 to August 25, 2024. Numbers include broadcast television for all sponsors. CITE SOURCE OF DATA AS: Vivvix CMAG with analysis by the Wesleyan Media Project. |
|||||||
Figure 3 displays these data visually, showing Harris with an ad advantage in Wisconsin markets and many markets in Michigan and Pennsylvania. By contrast, Trump holds a healthy ad advantage in most markets in Georgia, North Carolina and Arizona.
Figure 3: Party Ad Advantage by Media Market in Presidential Race (July 22 to August 25)
Figures are from July 22, 2024 to August 25, 2024.
Numbers include broadcast television for all sponsors.
CITE SOURCE OF DATA AS: Vivvix CMAG with analysis by the Wesleyan Media Project.
Presidential TV Ad Spending Approaches $500 million
Table 3 shows estimated broadcast ad spending in the presidential race since January 1 of 2023, inclusive of the primary phase of the election. All told, spending is at $483 million, with $148 million of that by candidates and $330 million by groups. Republican spending, owing to a primary race with multiple candidates, is $287 million compared to $196 million on the Democratic side.
Turning to airings, on the Democratic side, airings from Biden and Harris have far exceeded spots from supportive outside groups by nearly 3:1 (175,000 to 60,000). However, on the GOP side, there have been more ads from outside groups than from candidates.
Table 3: Presidential Airings and Spending by Party and Sponsor (Cycle to date)
| Candidate | Party/Coordinated | Group | Total | |
|---|---|---|---|---|
| Democratic Airings | 175,055 | 2,794 | 60,501 | 238,350 |
| Democratic Spend (in $Ms) | 90.0 | 4.4 | 101.7 | 196.1 |
| Republican Airings | 146,826 | 0 | 186,730 | 333,556 |
| Republican Spend (in $Ms) | 58.3 | 0.0 | 228.4 | 286.7 |
| Total Airings | 321,881 | 2,794 | 247,231 | 571,906 |
| Total Spend (in $Ms) | 148.3 | 4.4 | 330.1 | 482.8 |
| Figures are from January 1, 2023 to August 25, 2024. Numbers include broadcast television and national cable for all sponsors. CITE SOURCE OF DATA AS: Vivvix CMAG with analysis by the Wesleyan Media Project. |
||||
Harris Goes Big on Digital; GOP More Focused on TV
We also considered spending by Trump and Harris on Google and Meta platforms, along with additional spending on local cable, satellite TV (referred to as addressable TV), and radio, to give a wider sense of the full scale of advertising spending in the period after President Biden dropped out of the race. We show these totals in Table 4, along with spending from some of the biggest outside group spenders in the race. (We exclude spending from some smaller spenders in the presidential race, so this table is not inconclusive of all advertising spending.)
Table 4: Presidential Spending Across Media (July 22 to August 25)
| Addressable TV4 (in $Ms) | Broadcast TV (in $Ms) | Local Cable (in $Ms) | National Cable (in $Ms) | Radio (in $Ms) | Meta (in $Ms) | Google (in $Ms) | Total (in $Ms) |
||
|---|---|---|---|---|---|---|---|---|---|
| Pro-Dem | Harris1 | 43.8 | 10.4 | 1.8 | 1.4 | 32.6 | 44.4 | 134.5 | |
| AB PAC | 9.4 | 0.7 | 0.8 | 0.5 | 1.0 | 12.4 | |||
| DemocracyFirst | 0.1 | 1.3 | 0.4 | * | 0.1 | 1.9 | |||
| FF PAC2 | 41.9 | 6.1 | 0.6 | 2.0 | 1.1 | 51.7 | |||
| Project Freedom LLC | 0.4 | 0.3 | 0.7 | ||||||
| Somos Votantes3 | 1.3 | 0.1 | 0.0 | 0.0 | 1.3 | ||||
| Pro-Rep | Trump1 | 3.1 | 29.8 | 5.6 | 1.0 | 3.2 | 8.5 | 51.3 | |
| Make America Great Again Inc. | 1.2 | 43.7 | 6.5 | 0.1 | 3.5 | 55.1 | |||
| Preserve America PAC | 0.7 | 27.3 | 4.1 | 0.4 | 2.6 | 35.1 | |||
| Resoration PAC | 1.6 | 0.8 | 0.9 | * | * | 3.3 | |||
| 1Includes joint fundraising and coordinated advertising. National party spending is excluded if it occurs only on the national party pages and/or does not contain any reference to a presidential sponsor in the disclaimer. 2Includes a little over $100k in spending on broadcast that was jointly sponsored with Climate Power Action, LCV Victory Fund, and EDF Action Votes, and collapses FF PAC, Future Forward USA Action and Future Forward USA PAC spending on Meta and Google. 3Spending on Meta and Google are from jointly sponsored airings between Priorities USA and Somos PAC. 4Addressable TV spending totals includes satellite and connected TV from LG Ad Sales. *Denotes spending on platform but because it is intermingled with non presidential advertising, the total is not listed. Figures are from July 22 to August 25, 2024. Numbers on addressable, broadcast television, cable, and radio come from Vivvix CMAG while Meta and Google are from their respective ad library reports. CITE SOURCE OF DATA AS: Vivvix CMAG, Meta Ad Library, and Google Transparency Report with analysis by the Wesleyan Media Project. |
|||||||||
In this more inclusive set of platforms, Harris has spent about $134 million since July 22, including $77 million on Meta and Google. That digital total amounts to 57 percent of her ad dollars over the last month. She has also spent $10 million on local cable ads to go along with $44 million in broadcast TV ad spending. In contrast, her biggest outside group supporter, FF PAC, has spent over $50 million in the last month, over 90 percent of that on broadcast spots.
The Trump campaign has spent just $11.5 million on Meta/Google and more than three times that total on broadcast and local cable ads. Make America Great Again has devoted more than $50 million to local broadcast and cable ads, but far less on digital ads (at least on Meta and Google properties). The same TV over digital preference is true for Preserve America PAC, the other big outside group supporting Trump.
U.S. House Spots at Near-Record Levels, While U.S. Senate Totals Lag
In Figure 4, we show the number of airings in congressional races back to 2012. Ads in House races to-date are similar to the number in the 2022 campaign, and both years featured record totals of broadcast spots. This is largely a function of the small balance of power held by the Democrats in 2022 and by the Republicans this year. Control of the chamber will be determined by the outcome of a small number of very close races.
In the Senate, airings this cycle lag the 2020 and 2022 elections, but still total the third highest since 2012. Because Senate terms are 6-years, note the comparison of 2024 to 2018 and 2012, when the same states featured Senate elections. In that comparison of advertising for the same seats, 2024 has the highest ad total.
Figure 4: Volume of Ad Airings by Year (U.S. House and U.S. Senate)
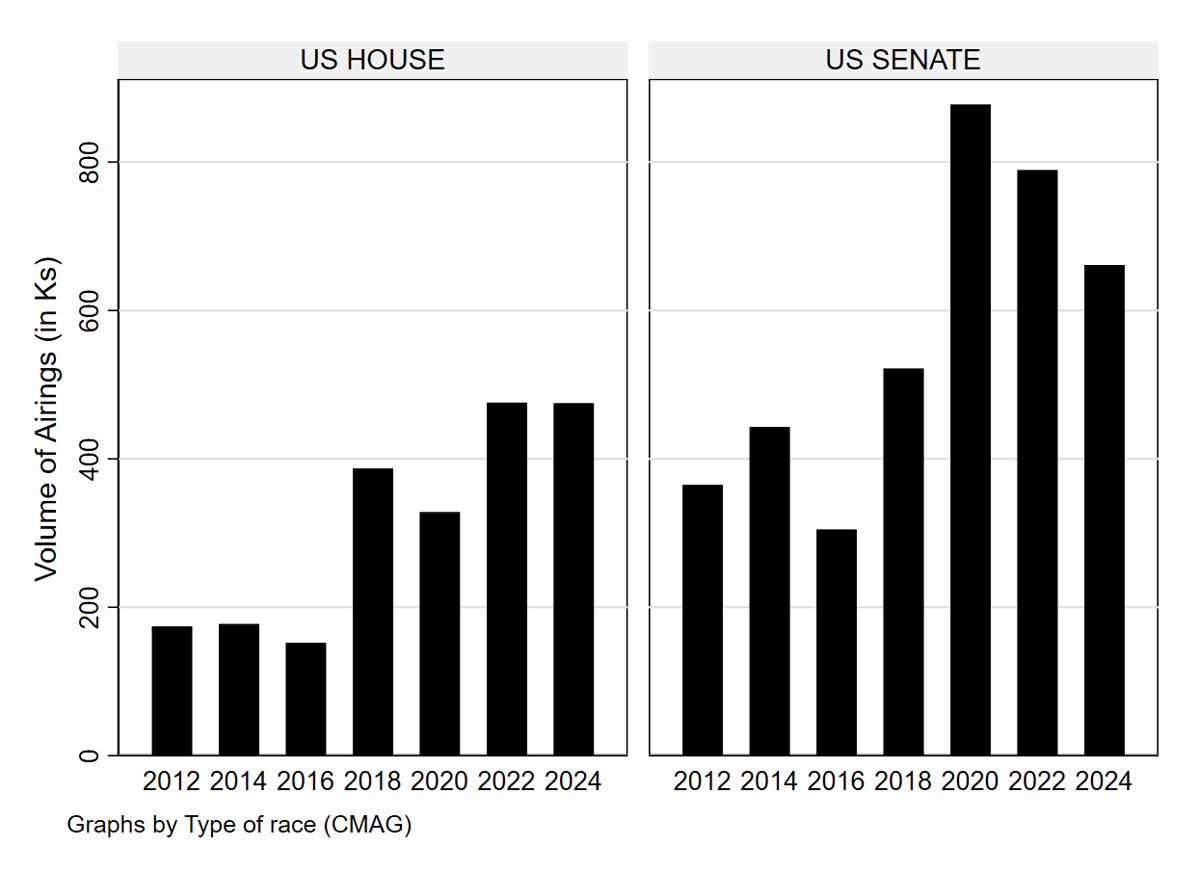
Figures are from January 1 of the off-year to August 25 of the election year.
Numbers include broadcast television for all sponsors.
CITE SOURCE OF DATA AS: Vivvix CMAG with analysis by the Wesleyan Media Project.
Table 5 shows spending in the full cycle to-date by party and sponsor type. And Table 6 shows the breakdown of spending in each Senate race along with the number of broadcast ad airings. Outside groups supporting Republican candidates—either in primary or general elections—have aired over 126,000 spots (nearly 44 percent of all advertising), just short of the 128,000 spots from Republican candidates. In contrast, Democratic candidates were far more active on TV than pro-Democratic groups, out-airing them 4 to 1. All told, in the cycle-to-date, broadcast television ads in Senate races have totaled over $320 million.
Table 5: U.S. Senate Airings and Spending by Party and Sponsor (Cycle to date)
| Candidate | Party/Coordinated | Group | Total | |
|---|---|---|---|---|
| Democratic Airings | 291,391 | 8,787 | 71,543 | 371,721 |
| Democratic Spend (in $Ms) | 116.6 | 6.3 | 57.3 | 180.2 |
| Republican Airings | 128,797 | 33,247 | 126,337 | 288,381 |
| Republican Spend (in $Ms) | 40.3 | 9.6 | 97.4 | 147.3 |
| Total Airings | 420,188 | 42,034 | 197,880 | 660,102 |
| Total Spend (in $Ms) | 156.9 | 15.9 | 154.6 | 327.5 |
| Figures are from January 1, 2023 to August 25, 2024. Numbers include broadcast television for all sponsors. CITE SOURCE OF DATA AS: Vivvix CMAG with analysis by the Wesleyan Media Project. |
||||
In terms of the number of ad airings with almost 200,000 to date, Montana’s Senate races has been by far the most intense this election season (see Table 6), though spending has been higher in Ohio, totaling almost $70 million. Groups have been particularly active in a number of contests, particularly West Virginia and Florida on the Democratic side and in Ohio, Pennsylvania, Michigan, and Utah on the Republican side.
Table 6: Ad Airings and Cost in U.S. Senate Races (Cycle to Date)
| State | Airings | Est. Spend (in $Ms) | Dem Airings | Rep Airings | % Dem Group | % Rep Group |
|---|---|---|---|---|---|---|
| MT | 192,787 | 49.4 | 109,301 | 83,486 | 23.9% | 34.6% |
| OH | 94,718 | 69.7 | 44,179 | 50,539 | 29.7% | 56.7% |
| WI | 60,638 | 28.1 | 28,137 | 32,501 | 13.6% | 30.6% |
| CA | 50,904 | 29.4 | 50,888 | 16 | 25.9% | 0.0% |
| PA | 47,079 | 35.7 | 22,399 | 24,680 | 19.6% | 75.8% |
| MD | 44,348 | 27.9 | 37,911 | 6,437 | 2.9% | 0.0% |
| NV | 40,508 | 22.1 | 27,285 | 13,223 | 19.7% | 39.9% |
| MI | 24,645 | 20.5 | 11,433 | 13,212 | 11.7% | 72.9% |
| AZ | 22,112 | 11.3 | 16,633 | 5,479 | 5.2% | 29.5% |
| WV | 17,744 | 6.2 | 2,620 | 15,124 | 69.4% | 53.6% |
| UT | 14,609 | 5.3 | 0 | 14,609 | 65.0% | |
| TX | 13,815 | 7.9 | 13,212 | 603 | 0.0% | 4.6% |
| MS | 9,328 | 1.3 | 0 | 9,328 | 9.4% | |
| NM | 6,412 | 1.4 | 2,241 | 4,171 | 0.0% | 10.2% |
| MO | 4,814 | 2.2 | 3,192 | 1,622 | 0.0% | 0.8% |
| FL | 4,193 | 5.6 | 842 | 3,351 | 48.8% | 0.0% |
| IN | 3,235 | 1.5 | 0 | 3,235 | 93.4% | |
| NE | 2,758 | 0.6 | 0 | 1,697 | 0.0% | |
| WY | 2,422 | 0.3 | 0 | 2,422 | 36.5% | |
| VA | 2,059 | 0.7 | 0 | 2,059 | 34.9% | |
| ND | 1,344 | 0.1 | 1,344 | 0 | 0.0% | |
| TN | 562 | 0.3 | 0 | 562 | 0.0% | |
| Figures are from January 1, 2023 to August 25, 2024. Numbers include broadcast television for all sponsors. CITE SOURCE OF DATA AS: Vivvix CMAG with analysis by the Wesleyan Media Project. |
||||||
Ad Spending in U.S. House Races Approaches $220 million
Tables 7 and 8 repeat the analysis but for U.S. House campaigns. For House races, outside groups advocating for Democrats, in either primary or general election campaigns, have nearly matched the spot totals of Democratic candidates. All told, outside groups have sponsored 42 percent of all ads in House races in the election cycle to-date. Total broadcast ad spending cycle-to-date in House races is almost $220 million.
Table 7: House Airings and Spending by Party and Sponsor (Cycle to date)
| Candidate | Party/Coordinated | Group | Total | |
|---|---|---|---|---|
| Democratic Airings | 92,114 | 7,194 | 89,815 | 189,123 |
| Democratic Spend (in $Ms) | 32.2 | 4.3 | 70.7 | 107.2 |
| Republican Airings | 168,755 | 5,836 | 109,855 | 284,446 |
| Republican Spend (in $Ms) | 42.7 | 2.1 | 66.7 | 111.5 |
| Total Airings | 260,869 | 13,030 | 199,670 | 473,569 |
| Total Spend (in $Ms) | 74.9 | 6.4 | 134.4 | 218.7 |
| Figures are from January 1, 2023 to August 25, 2024. Numbers include broadcast television for all sponsors. CITE SOURCE OF DATA AS: Vivvix CMAG with analysis by the Wesleyan Media Project. |
||||
The top House races, ranked by the number of ad airings, are shown in Table 8.
Table 8: Ad Airings and Cost in U.S. House Races (Cycle to Date)
| District | Airings | Est. Spend (in $Ms) | Dem Airings | Rep Airings | % Dem Group | % Rep Group |
|---|---|---|---|---|---|---|
| VA05 | 23,159 | 7.2 | 0 | 23,159 | 87.8% | |
| OK04 | 18,770 | 5.8 | 0 | 18,770 | 22.0% | |
| AK01 | 15,036 | 3.3 | 11,293 | 3,743 | 28.3% | 65.6% |
| AL02 | 11,291 | 2.6 | 5,043 | 6,248 | 63.7% | 0.9% |
| CA22 | 11,237 | 2.9 | 7,133 | 4,104 | 58.3% | 62.4% |
| NC13 | 10,991 | 5.5 | 0 | 10,991 | 13.2% | |
| MT02 | 10,898 | 1.5 | 0 | 10,898 | 8.2% | |
| SC01 | 10,454 | 4.8 | 290 | 10,164 | 38.3% | 90.6% |
| NY19 | 9,538 | 3.6 | 7,528 | 2,010 | 68.6% | 56.7% |
| MO01 | 9,519 | 9.3 | 9,519 | 0 | 64.2% | |
| MI08 | 9,463 | 3.1 | 2,737 | 6,726 | 0.0% | 10.5% |
| IN08 | 9,017 | 2.7 | 1,592 | 7,425 | 100.0% | 51.5% |
| NY03 | 8,978 | 13.4 | 6,006 | 2,972 | 44.9% | 73.9% |
| CO03 | 8,862 | 1.3 | 4,855 | 4,007 | 22.4% | 9.3% |
| MD03 | 8,604 | 4.6 | 8,604 | 0 | 24.0% | |
| IN03 | 8,543 | 2.5 | 0 | 8,543 | 49.0% | |
| AL01 | 8,320 | 1.9 | 0 | 8,320 | 44.0% | |
| IN06 | 7,863 | 2.8 | 0 | 7,863 | 0.0% | |
| NY16 | 7,270 | 14.3 | 7,270 | 0 | 68.9% | |
| AZ06 | 7,102 | 2.1 | 5,012 | 2,090 | 83.8% | 16.5% |
| Figures are from January 1, 2023 to August 25, 2024. Numbers include broadcast television for all sponsors. CITE SOURCE OF DATA AS: Vivvix CMAG with analysis by the Wesleyan Media Project. |
||||||
House Democrats Emphasize Abortion; Republicans Emphasize Immigration
Tables 9 and 10 show the top ten issues mentioned in ads in House and Senate races by party for both the full cycle to date (through August 25) and in the last two weeks. We combine all sponsors within party (e.g., Democratic candidates, Democratic party committees, and pro-Democratic groups). In the full cycle to date, pro-Democratic House ads have mentioned abortion in two of every five ad airings. Health care has appeared in nearly one in three airings. Pro-Democratic Senate ads, however, have focused far less on abortion and proportionately more on prescription drugs. Ads promoting Republicans in both House and Senate races have put immigration front and center in the campaign, when looking at airings across the full cycle to-date.
Table 9: Top 10 Issues in House and Senate Races, Cycle to Date
| Issue | % of airings | Issue | % of airings | ||
|---|---|---|---|---|---|
| House, pro-Democrats | Abortion | 41.4% | House, pro-Republicans | Immigration | 61.6% |
| (189,123 airings) | Health Care | 30.9% | (284,446 airings) | Public Safety | 26.9% |
| Public Safety | 19.2% | Budget | 24.9% | ||
| Prescription Drugs | 18.2% | Drug problems | 16.5% | ||
| Budget | 16.9% | Economy | 15.8% | ||
| Economy | 15.4% | Int'l affairs | 14.3% | ||
| Energy policy | 14.3% | Inflation | 13.4% | ||
| Women's rights | 14.2% | Taxes | 13.1% | ||
| Taxes | 13.0% | Energy and environment | 10.5% | ||
| Immigration | 12.8% | Prescription drugs | 9.0% | ||
| Senate, pro-Democrats | Prescription Drugs | 33.9% | Senate, pro-Republicans | Immigration | 45.3% |
| (371,721 airings) | Health care | 22.1% | (288,381 airings) | Budget | 31.6% |
| Housing | 16.6% | Public safety | 26.1% | ||
| Drug problems | 15.5% | Economy | 25.1% | ||
| Immigration | 15.2% | Inflation | 21.0% | ||
| Jobs | 13.6% | Taxes | 20.8% | ||
| Economy | 13.4% | Energy and environment | 15.5% | ||
| Opioids | 12.7% | Jobs | 13.9% | ||
| Energy and environment | 12.1% | Drug problems | 13.7% | ||
| Inflation | 11.0% | Health care | 11.2% | ||
| Figures are from January 1, 2023 to August 25, 2024. Numbers include broadcast television for all sponsors. CITE SOURCE OF DATA AS: Vivvix CMAG with analysis by the Wesleyan Media Project. |
|||||
In the last two weeks, however, pro-GOP advisers have elevated discussion of the economy and inflation alongside a continued focus on immigration. Democratic efforts in House races have also seen a shift in focus, with public safety and immigration the top two issue mentions in recent weeks. Pro-Democratic Senate ads remain focused on prescription drugs and health care.
Table 10: Top 10 Issues in U.S. House and U.S. Senate Races, 8/12 to 8/25
| Issue | % of airings | Issue | % of airings | ||
|---|---|---|---|---|---|
| House, pro-Democrats | Public Safety | 30.9% | House, pro-Republicans | Economy | 42.3% |
| (32,254 airings) | Immigration | 29.0% | (12,949 airings) | Inflation | 41.2% |
| Prescription drugs | 28.2% | Immigration | 38.6% | ||
| Abortion | 26.7% | Energy and environment | 35.7% | ||
| Health care | 25.3% | Budget | 30.8% | ||
| Jobs | 20.1% | Health care | 28.9% | ||
| Drug problems | 19.2% | Public Safety | 28.4% | ||
| Opioids | 17.4% | Prescription drugs | 19.3% | ||
| Energy and environment | 14.7% | Drug problems | 18.8% | ||
| Inflation | 14.6% | Taxes | 16.9% | ||
| Senate, pro-Democrats | Prescription drugs | 42.9% | Senate, pro-Republicans | Immigration | 45.3% |
| (44,717 airings) | Health care | 40.4% | (36,047 airings) | Economy | 43.3% |
| Drug problems | 22.8% | Inflation | 43.3% | ||
| Medicare | 21.6% | Budget | 42.5% | ||
| Public Safety | 19.0% | Public safety | 42.2% | ||
| Jobs | 18.8% | Taxes | 28.3% | ||
| Immigration | 18.8% | Energy and environment | 25.5% | ||
| China | 18.5% | Seniors | 18.4% | ||
| Int'l affairs | 18.5% | Housing | 18.3% | ||
| Opioids | 14.7% | Health care | 17.6% | ||
| Figures are from August 12 to August 25, 2024. Numbers include broadcast television for all sponsors. CITE SOURCE OF DATA AS: Vivvix CMAG with analysis by the Wesleyan Media Project. |
|||||
Philly Tops the List of Top Ad Markets
Spending on television ads can extend far down the ticket, as candidates for state, county, and local office sometimes make use of TV ads to reach overs. Ballot measures can also draw lots of spots. In Table 11, we show the top media markets for election-related television ads in the cycle to-date. Philadelphia tops the list with nearly 75,000 ad airings since January 2023—that’s about 630 hours of television time (or 26 continuous days of back-to-back ads). Among these spots, 32,000 have been about the presidential race, but over 9,000 have concerned the Senate race in Pennsylvania. Other top markets include Indianapolis, Las Vegas, Phoenix, and Milwaukee, all featuring a mix of ads for the presidential race, as well as legislative and other statewide races.
Table 11: Top Media Markets by Airings in All Races (Cycle to Date)
| Market | Total Airings | Senate Airings | House Airings | Governor Airings | Pres Airings | Est. Spend (in $Ms) |
|---|---|---|---|---|---|---|
| Philadelphia | 74,961 | 9,197 | 1,615 | 197 | 32,462 | 70.15 |
| Indianapolis | 67,760 | 1,638 | 13,436 | 27,029 | 5 | 23.79 |
| Las Vegas | 57,300 | 27,084 | 3,001 | 0 | 23,288 | 35.68 |
| Phoenix | 56,133 | 13,588 | 11,224 | 0 | 31,239 | 36.19 |
| Milwaukee | 55,639 | 14,000 | 3,417 | 25 | 15,853 | 33.20 |
| Pittsburgh | 53,960 | 11,932 | 1,686 | 994 | 19,547 | 43.46 |
| Green Bay | 52,123 | 14,527 | 3,417 | 1 | 13,336 | 20.17 |
| Norfolk | 50,962 | 877 | 6,638 | 0 | 11 | 8.05 |
| Washington DC | 48,163 | 17,474 | 6,520 | 2,233 | 58 | 35.09 |
| Cincinnati | 47,558 | 19,842 | 2,675 | 8,657 | 7 | 26.41 |
| Jacksonville | 45,545 | 79 | 490 | 0 | 4 | 6.66 |
| Missoula | 44,650 | 40,220 | 2,075 | 1,790 | 3 | 15.20 |
| Butte | 44,403 | 41,094 | 1,768 | 1,534 | 7 | 10.80 |
| Charleston, WV | 42,493 | 5,956 | 3,754 | 26,089 | 12 | 11.90 |
| Louisville | 41,788 | 0 | 0 | 36,257 | 4 | 17.79 |
| Billings | 41,111 | 33,703 | 4,931 | 1,464 | 7 | 11.58 |
| Great Falls | 40,638 | 35,120 | 3,884 | 1,280 | 354 | 9.28 |
| Helena | 40,233 | 36,588 | 2,077 | 1,174 | 394 | 6.13 |
| Lexington | 39,147 | 0 | 0 | 33,113 | 5 | 10.72 |
| Raleigh | 38,878 | 16 | 14,531 | 12,353 | 9,641 | 24.01 |
| Issue advocacy ads are excluded from the analysis, but broadcast ads for ballot measures, all federal races, statewide races and down ballot races are included in the numbers. Figures are from January 1, 2023 to August 25, 2024. CITE SOURCE OF DATA AS: Vivvix CMAG with analysis by the Wesleyan Media Project. |
||||||
Figure 5: Top Media Markets for Television Airings in All Races (Cycle-to-Date)
Issue advocacy ads are excluded from the analysis, but broadcast ads for ballot measures, all federal races, statewide races and down ballot races are included in the numbers.
Figures are from January 1, 2023 to August 25, 2024.
CITE SOURCE OF DATA AS: Vivvix CMAG with analysis by the Wesleyan Media Project.
IN, NC, and WV top Gubernatorial Spending in 2024 Election Cycle
Table 12 shows the gubernatorial races with the most ads on broadcast television. Indiana tops the list, with over 70,000 spots and over $21 million in spending—all on the Republican side in advance of the party primary in early May. The campaign in North Carolina has cost more, $33.4 million, and featured a large proportion of outside group spending on behalf of the Democratic candidate. Over 50,000 ads aired in the West Virginia gubernatorial campaign, but all of them were on the GOP side and concerned the competitive primary for the party nomination, which was held on May 14.
Table 12: Ad Airings and Cost in Gubernatorial Races (Cycle to Date)
| State | Airings | Est. Spend (in $Ms) | Dem Airings | Rep Airings | % Dem Group | %Rep Group |
|---|---|---|---|---|---|---|
| IN | 70,121 | 21.1 | 0 | 70,121 | 0.0% | 9.2% |
| NC | 55,642 | 33.4 | 34,305 | 21,337 | 24.3% | 0.0% |
| WV | 51,850 | 11.5 | 0 | 51,850 | 0.0% | 31.0% |
| MS | 42,177 | 8.7 | 20,263 | 21,914 | 0.0% | 0.0% |
| MO | 28,759 | 16.3 | 4,955 | 23,804 | 0.0% | 47.6% |
| ND | 14,505 | 2.2 | 0 | 14,505 | 0.0% | 0.0% |
| WA | 7,294 | 3.3 | 5,664 | 1,630 | 11.1% | 0.0% |
| MT | 7,242 | 1.0 | 2,796 | 4,446 | 0.0% | 0.0% |
| NH | 5,456 | 3.7 | 2,346 | 3,110 | 17.9% | 0.0% |
| DE | 1,385 | 0.5 | 1,385 | 0 | 38.3% | 0.0% |
| UT | 814 | 0.3 | 0 | 814 | 0.0% | 0.0% |
| Figures are from January 1, 2023 to August 25, 2024. Numbers include broadcast television for all sponsors. CITE SOURCE OF DATA AS: Vivvix CMAG with analysis by the Wesleyan Media Project. |
||||||
About the Data
Television ad totals reported here are from Vivvix CMAG and (unless otherwise specified) refer to broadcast television. All cost estimates for television are precisely that: estimates.
Meta spending data come from the aggregate reports, which provide spending information for each page name and disclaimer combination. Totals in this report reflect spending between January 1, 2023, July 22, 2024, and August 24, 2024. These totals are calculated by subtracting the reported cumulative spending (as reported by Facebook as the total spent since May 2018) for the August 24, 2022 report and subtracting the cumulative spending reported for January 1, 2023, and July 21, 2024.
Spending by Biden/Harris includes: spending on the Joe Biden page from Biden Victory Fund, DNC and Biden for President, Biden for President; spending on the Kamala HQ page from Biden Victory Fund and Harris Victory Fund; spending on the Kamala Harris page from Biden Victory Fund, DNC Services Corp., Harris for President and Harris Victory Fund; spending on the Tim Walz page by Harris Victory Fund; Biden for President spending on the Complex and The Daily Scroll pages, and Biden Victory Fund spending on the Democratic Party page. Spending by Trump includes: spending on the Donald J. Trump page by the Trump National Committee JFC, Donald J. Trump for President 2024, Inc., Trump 47 Committee, Inc., and Trump Save America Joint Fundraising Committee; Trump Save America Joint Fundraising Committee on the Team Trump page; Trump National Committee JFC and Trump 47 Committee, Inc. spending on the JD Vance page, and Trump National Committee JFC spending on Lara Trump’s page. Spending by supporting groups for Biden/Harris and Trump are listed in the table notes when they are used.
For Google ads, we downloaded the weekly reports from the platform’s Transparency Report. The totals reflected in this release are from the following time periods: January 1, 2023, or July 21, 2024, and August 24, 2024.
Spending by Biden/Harris includes the Biden for President, Harris for President, DNC Services Corp when it appears with Biden or Harris for President, Biden Victory Fund, and Harris Victory Fund advertisers. Spending by Trump includes advertisers Donald J. Trump for President 2024, Inc., Trump Save America Joint Fundraising Committee, and Trump National Committee JFC. Spending by supporting groups for Biden/Harris and Trump are listed in the table notes when they are used.
About this Report
The Wesleyan Media Project provides real-time tracking and analysis of all political television advertising in an effort to increase transparency in elections. Housed in Wesleyan’s Quantitative Analysis Center – part of the Allbritton Center for the Study of Public Life – the Wesleyan Media Project is the successor to the Wisconsin Advertising Project, which disbanded in 2009. It is directed by Erika Franklin Fowler, professor of government at Wesleyan University, Michael M. Franz, professor of government at Bowdoin College and Travis N. Ridout, professor of political science at Washington State University.WMP personnel include Breeze Floyd (Program Manager), Pavel Oleinikov (Associate Director, QAC), Yujin Kim (Post-Doctoral Fellow) and Meiqing Zhang (Post-Doctoral Fellow).
The Wesleyan Media Project’s real-time tracking in 2024 is supported by Wesleyan University and the John S. and James L. Knight Foundation. The Wesleyan Media Project is partnering again this year with OpenSecrets, to provide added information on outside group disclosure and candidate status.
Periodic releases of data will be posted on the project’s website and dispersed via LinkedIn, Bluesky @wesmediaproject.bsky.social and Twitter @wesmediaproject. To be added to our email update list, click here.
For more information contact: Ziba Kashef at mkashef92@wesleyan.edu (please also cc media@wesleyan.edu).
About Wesleyan University
Wesleyan University, in Middletown, Conn., is known for the excellence of its academic and co-curricular programs. With more than 2,900 undergraduates and 200 graduate students, Wesleyan is dedicated to providing a liberal arts education characterized by boldness, rigor and practical idealism. For more, visit www.wesleyan.edu.
About the John S. and James L. Knight Foundation
We are social investors who support democracy by funding free expression and journalism, arts and culture in community, research in areas of media and democracy, and in the success of American cities and towns where the Knight brothers once had newspapers. Learn more at kf.org and follow @knightfdn on social media.