Photo Gage Skidmore/Flickr
Harris focused on wide range of issues, while Trump camp goes hard on immigration and public safety
(MIDDLETOWN, CT) August 15, 2024 – The general election is in full swing, as both pro-Harris and pro-Trump ads are on the air in battleground states. In previous analyses, the Wesleyan Media Project reported that Trump was airing few television ads while Biden was spending considerable resources in general election battleground states. However, since mid-July, the Trump campaign has heavily ramped up advertising, sponsoring nearly 15,000 ads costing over $10 million. Trump was also backed with heavy buys from two groups, Make America Great Again (22,800 spots) and Preserve America PAC (6,100 airings). Both are Super PACs.
Overall, more ads have promoted Trump than Biden or Harris since July 12 (Table 1). Just under 44,000 ad airings promoted Trump, with half of those coming from Make America Great Again, Inc. By contrast, there have been about 32,700 airings promoting Biden or Harris, with the Harris campaign and FF PAC (also known as Future Forward) each airing about 12,000 ads. However, spending is greater on the Democratic side, with about $63 million in spending versus about $49 million spent on ads promoting Trump.
Table 1: TV Ad Airings and Spending by Sponsor in the Presidential Race
| Sponsor | Airings | Spend (in $Ms) |
|---|---|---|
| Biden, Joe | 4,479 | 6.8 |
| Harris, Kamala | 12,569 | 15.4 |
| AB PAC | 2,532 | 5.3 |
| Adbusters Media Foundation | 6 | 0.003 |
| Democracy First | 458 | 0.41 |
| FF PAC | 12,687 | 34.8 |
| Total (D) | 32,731 | 62.6 |
| Trump, Donald | 14,750 | 10.3 |
| America Next | 60 | 1.1 |
| Make America Great Again Inc. | 22,804 | 21.9 |
| Preserve America PAC | 6,109 | 15.9 |
| Securing American Greatness | 236 | 0.033 |
| Total (R) | 43,959 | 49.4 |
| Grand total | 76,690 | 112 |
| Figures are from July 12, 2024, to August 11, 2024. Numbers include broadcast television for all sponsors. CITE SOURCE OF DATA AS: Vivvix CMAG with analysis by the Wesleyan Media Project. |
||
Figure 1 compares the number of TV ads aired by week in the 2020 and 2024 presidential elections, inclusive of all ad sponsors. We show totals from early April through early August in both years. While ad volumes are similar in both years until early June, they are much lower in 2024 than in 2020 for the last part of June and July. Since Biden left the race on July 21, however, ad totals per week in 2024 have jumped to levels comparable to those in 2020.
“The shakeup in the presidential contest has given both parties new incentives to advertise, as Vice President Harris is not as well-known as former President Trump or President Biden,” said Travis Ridout, co-director of the Wesleyan Media Project.
Figure 1: 2020 and 2024 Presidential TV Airings by Week
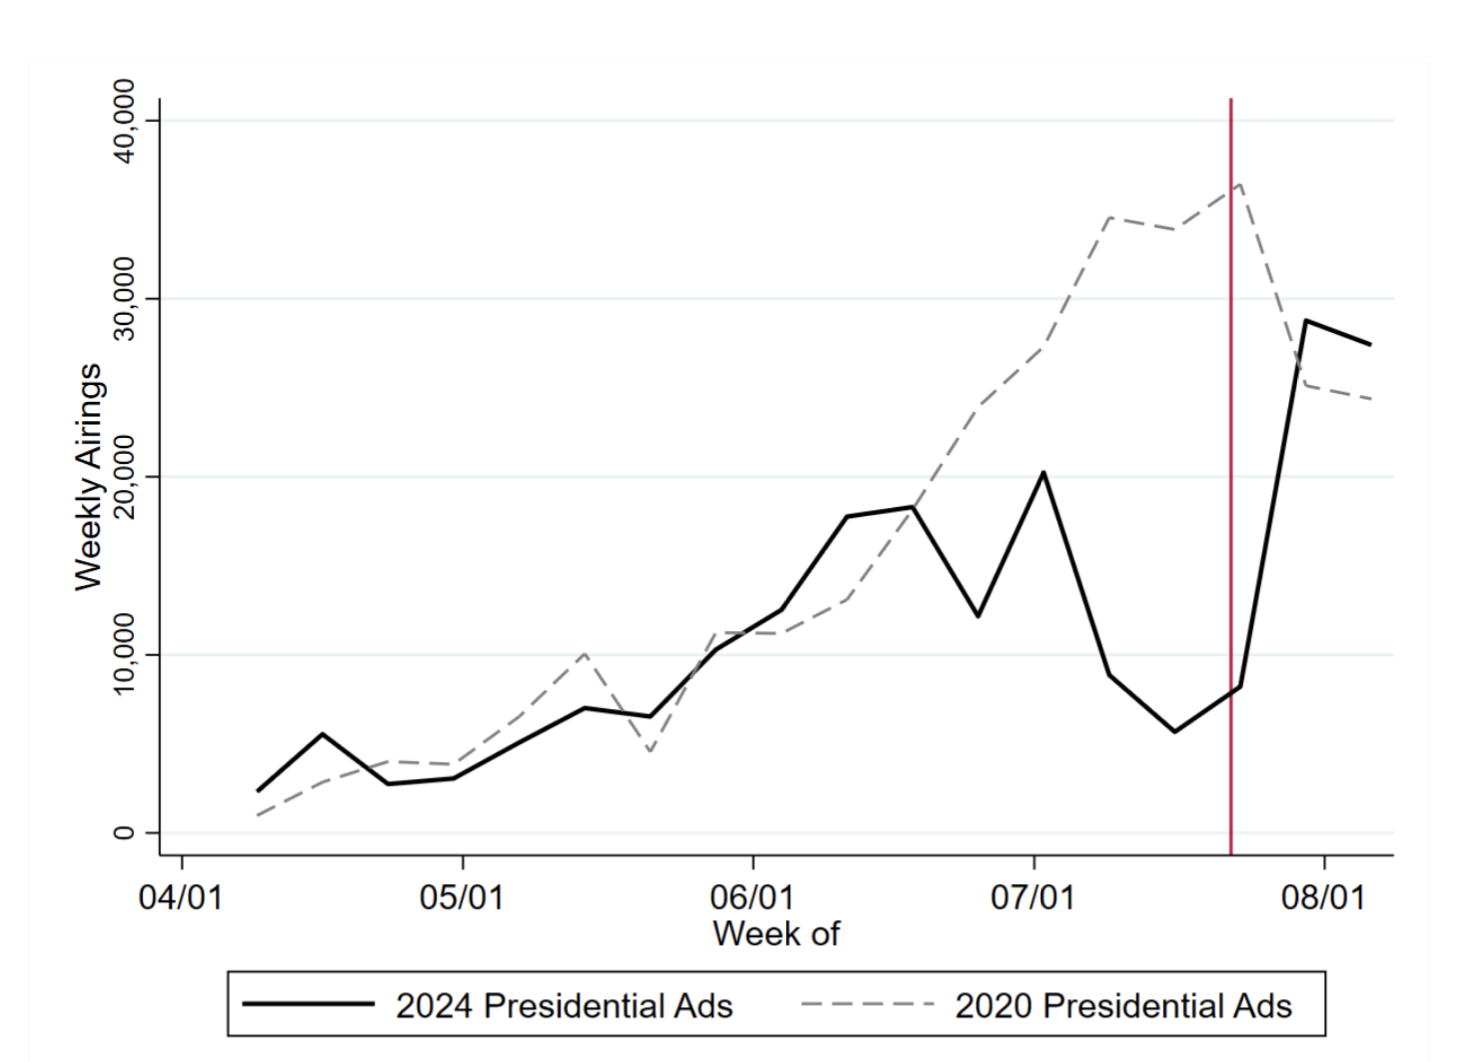
Numbers include broadcast television for all sponsors. Red line indicates the day Biden dropped out of the race.
CITE SOURCE OF DATA AS: Vivvix CMAG with analysis by the Wesleyan Media Project.
Trump Discusses Public Safety, Immigration; Harris Focuses on Housing, Healthcare
Table 2 shows the top issues mentioned by the Harris and Trump campaigns and by each candidate’s top supporting group. For Harris and FF PAC (a pro-Democratic super PAC), a bundle of traditional Democratic issues top the list, including health care, affordable housing, abortion (for FF PAC), and prescription drugs. But both Harris and FF PAC also focus on public safety (often in the context of Harris’ background as a prosecutor) in a majority of their ads.
For Trump and the pro-Trump Make America Great Again, Inc. Super PAC, the issue agenda is dominated by immigration, public safety, prescription drugs and opioids.
“Trump and his allies are airing ads attempting to tie Harris to the border security issues, illegal immigration, and crime while Harris and her allies are touting her record as a prosecutor, background as a daughter of an immigrant, and contrasting her work for for the middle class with that of Trump,” said Erika Franklin Fowler, co-director of the Wesleyan Media Project.
Table 2: Top Issue Mentions by Candidates and Top Groups in Presidential Race
| Housing | 90.2% | Public Safety | 100.0% |
| Health care | 84.7% | Immigration | 100.0% |
| Taxes | 84.7% | Prescription Drugs | 96.3% |
| Public Safety | 81.1% | Opioids | 96.3% |
| Prescription Drugs | 81.1% | Terrorism | 42.6% |
| Financial Services | 71.4% | ||
| Affordable Care Act | 65.8% | ||
| Retirement | 65.8% | ||
| Seniors Issues | 65.8% | ||
| Financial Reform | 29.3% | ||
| FF PAC (pro-Harris) | MAGA, Inc. (pro-Trump) | ||
| Abortion | 71.3% | Immigration | 89.2% |
| Economy | 61.5% | Public Safety | 53.4% |
| Financial Reform | 61.4% | Budget | 37.7% |
| Prescription Drugs | 61.4% | Drugs | 37.5% |
| Public Safety | 61.4% | Inflation | 17.2% |
| Financial Services | 61.4% | Economy | 17.2% |
| Housing | 36.7% | Education | 14.6% |
| Social Welfare | 36.0% | Transportation | 14.6% |
| Healthcare | 36.0% | Domestic Abuse | 8.3% |
| Jobs | 35.3% | ||
| Figures are from July 12, 2024, to August 11, 2024. CITE SOURCE OF DATA AS: Vivvix CMAG with analysis by the Wesleyan Media Project. |
|||
Pro-Trump Advertising Skyrockets in Past Two Weeks
Figure 2 shows the volume of pro-Democratic ads (either Biden or Harris) by week in the top left panel, while the volume of pro-Trump ads is shown in the top right panel. The number of pro-Democratic ads ramped up almost each week during the summer before dropping in early July. Very few pro-Democratic ads aired the week of July 23—the week that Biden dropped out of the race. But pro-Democratic advertising has rebounded the past two weeks. Pro-Trump ads, by contrast, aired at very low volumes until 3 weeks ago. They skyrocketed the week of July 30 before dropping some this past week.
The bottom panels in the figure show the tone of advertising by week. Over the past couple of weeks, pro-Democratic ads have been largely positive (touting Harris and her background), while pro-Republican ads have been almost exclusively negative (focused on Harris). The remainder of pro-Republican ads were contrast ads—those that both promote the favored candidate and attack the opponent.
Figure 2: Tone and Volume of Presidential Ads by Week
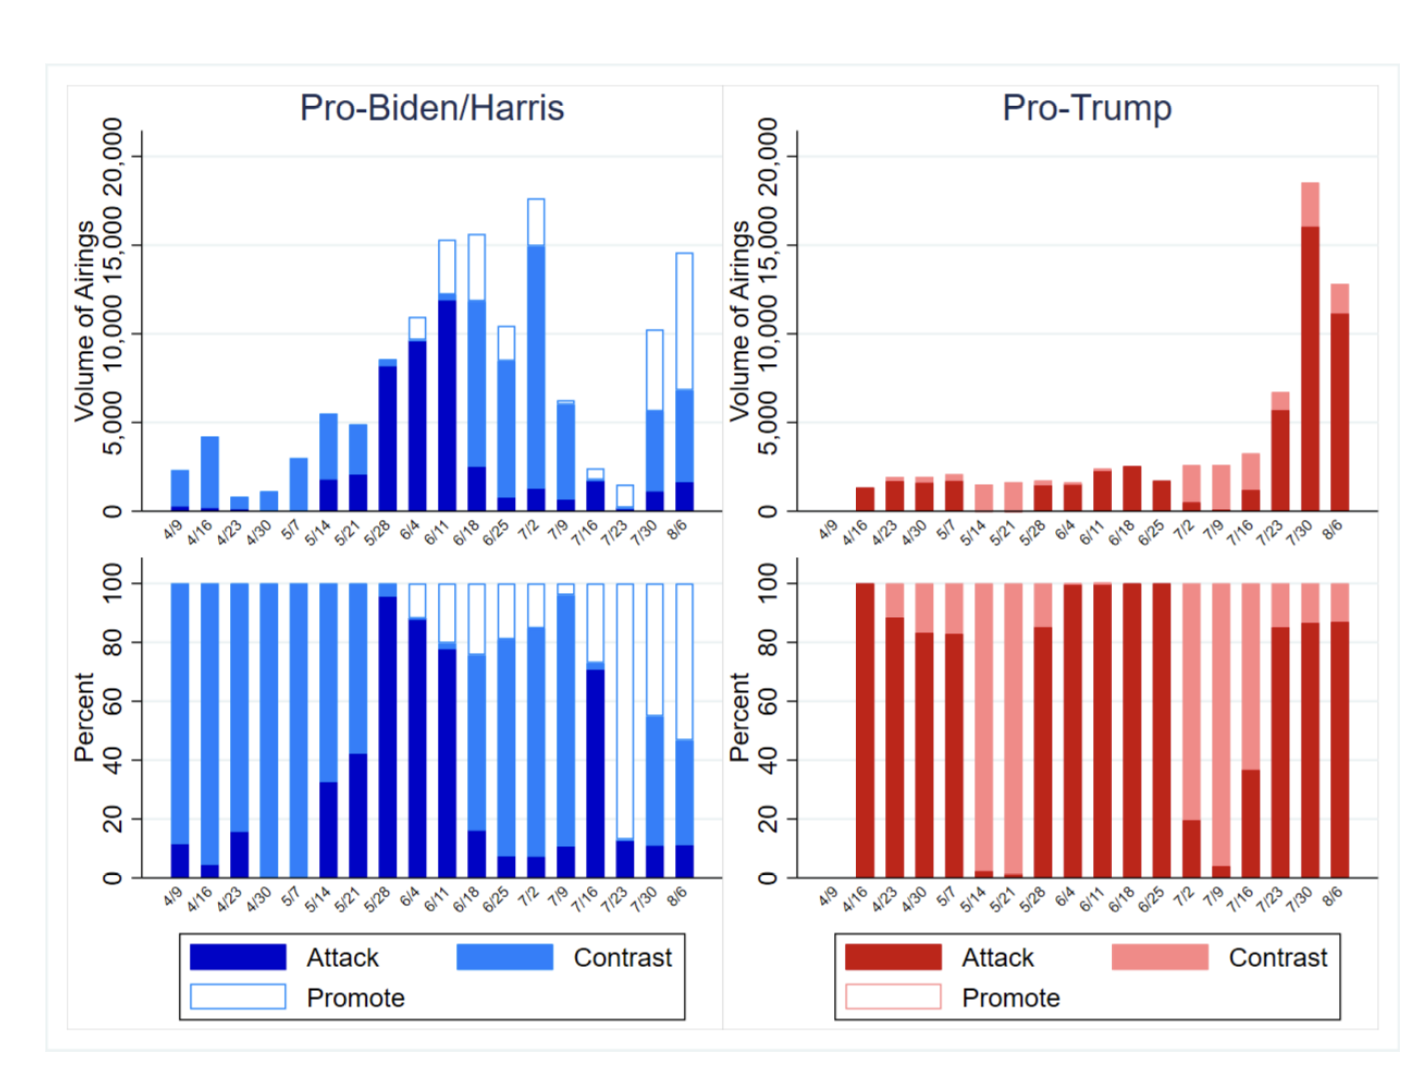
Numbers include broadcast television for all sponsors.
CITE SOURCE OF DATA AS: Vivvix CMAG with analysis by the Wesleyan Media Project.
Republican Presidential Ads Dominate Most Markets
Table 3 shows the number of ad airings—and spending—in the top media markets in the presidential race between July 12 and August 11. This includes advertising sponsored by candidate campaigns, parties and groups.
Phoenix, Philadelphia and Atlanta top the list, followed by two additional markets in Pennsylvania: Harrisburg and Pittsburgh. All told, media markets in Arizona, Pennsylvania, Georgia and Michigan top the list, with markets in Wisconsin, North Carolina and Nevada a bit further down.
Pro-Trump ads are more numerous than pro-Harris (or pro-Biden) ads in most media markets, with Michigan markets—and two Wisconsin markets—serving as exceptions. In Phoenix, for example, there is more than a two-to-one pro-Trump ad advantage, as shown by the last column, which lists the difference in the number of pro-Democratic and pro-Republican ads. Negative numbers indicate a Republican advantage. The pro-Republican ad advantage is also quite large in Georgia and other Arizona media markets.
Table 3: Airings and Spend by Media Market in Presidential Race
| Market | Airings | Spend Est (in $Ms) | Dem Airings | Rep Airings | Dem Spend Est (in $Ms) | Rep Spend Est (in $Ms) | Dem Adv |
|---|---|---|---|---|---|---|---|
| Phoenix | 6,728 | 4.31 | 1,966 | 4,762 | 1.62 | 2.7 | -2,796 |
| Philadelphia | 6,137 | 11.7 | 2,646 | 3,491 | 6.41 | 5.25 | -845 |
| Atlanta | 5,558 | 8.31 | 2,243 | 3,315 | 3.7 | 4.61 | -1,072 |
| Harrisburg | 4,542 | 4.91 | 1,933 | 2,609 | 2.64 | 2.27 | -676 |
| Pittsburgh | 4,494 | 7.61 | 2,053 | 2,441 | 4.21 | 3.4 | -388 |
| Tucson | 4,279 | 2.2 | 898 | 3,381 | 0.49 | 1.72 | -2,483 |
| Johnstown | 4,199 | 2.31 | 1,741 | 2,458 | 1.28 | 1.03 | -717 |
| Augusta (GA) | 3,714 | 0.6 | 781 | 2,933 | 0.21 | 0.39 | -2,152 |
| Savannah | 3,498 | 1.96 | 877 | 2,621 | 0.48 | 1.48 | -1,744 |
| Macon | 3,307 | 0.83 | 1,016 | 2,291 | 0.27 | 0.55 | -1,275 |
| Grand Rapids | 3,078 | 2.93 | 1,936 | 1,142 | 2.1 | 0.83 | 794 |
| Detroit | 2,767 | 5.61 | 1,620 | 1,147 | 3.43 | 2.19 | 473 |
| Wilkes Barre | 2,753 | 2.71 | 640 | 2,113 | 1.34 | 1.37 | -1,473 |
| Green Bay | 2,697 | 3.34 | 1,708 | 989 | 2.34 | 1 | 719 |
| Las Vegas | 2,418 | 1.75 | 1,029 | 1,389 | 1.07 | 0.68 | -360 |
| Madison | 2,136 | 1.66 | 1,055 | 1,081 | 0.98 | 0.68 | -26 |
| Flint | 1,945 | 1.67 | 1,001 | 944 | 1.12 | 0.55 | 57 |
| Milwaukee | 1,906 | 2.96 | 1,058 | 848 | 1.8 | 1.16 | 210 |
| Lansing | 1,428 | 0.96 | 822 | 606 | 0.82 | 0.14 | 216 |
| Raleigh | 989 | 0.63 | 370 | 619 | 0.33 | 0.3 | -249 |
| Charlotte | 857 | 0.58 | 301 | 556 | 0.13 | 0.45 | -255 |
| Greensboro | 821 | 0.17 | 289 | 532 | 0.06 | 0.11 | -243 |
| Reno | 736 | 0.17 | 62 | 674 | 0.01 | 0.16 | -612 |
| Traverse City | 724 | 0.32 | 408 | 316 | 0.26 | 0.06 | 92 |
| Columbus, Ga | 696 | 0.09 | 425 | 271 | 0.07 | 0.02 | 154 |
| Figures are from July 12, 2024, and August 11, 2024. Numbers include broadcast television for all sponsors. CITE SOURCE OF DATA AS: Vivvix CMAG with analysis by the Wesleyan Media Project. |
|||||||
House Airings match 2022 totals; Senate airings below last two cycles
Figure 3 shifts the focus to congressional races and shows the volume of advertising cycle-to-date in U.S. House and U.S. Senate races. Already, over 400,000 ads have aired in House races this cycle, even with the volume of 2022 and higher than any past election cycle going back to 2012. In the Senate, however, ad volumes are down from 2020 and 2022 but are still higher than any election cycle between 2012 and 2018.
Figure 3: Volume of Congressional Ads, 2012-2024
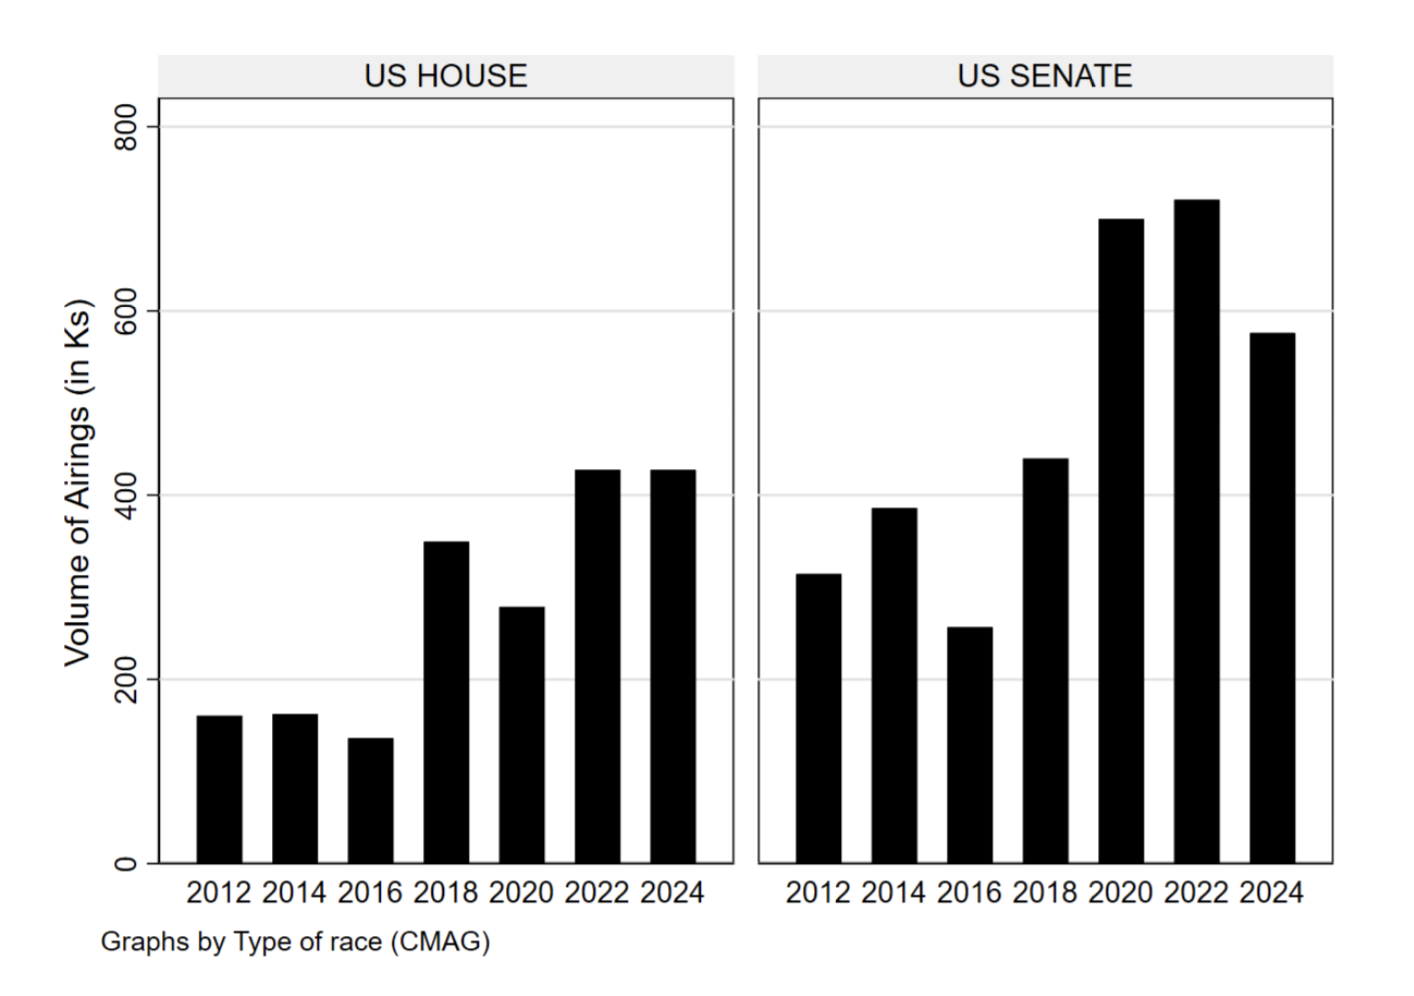
Figures are from January 1 of the off-year to August 11 of the election year for each cycle. Numbers include broadcast television for all sponsors.
CITE SOURCE OF DATA AS: Vivvix CMAG with analysis by the Wesleyan Media Project.
Montana, Ohio Top Senate Races
In terms of the number of ad airings, the Montana Senate race is by far the most intense, with almost 78,000 ad airings since May 20 (Table 4). That more than doubles the number of ad airings in Ohio and Wisconsin, each at just about 30,000. Airings in Pennsylvania and Nevada both top 20,000.
When it comes to spending, however, the Senate race in Ohio comes out on top with $24.6 million spent on ads since May 20, just above the $23.1 million spent in Montana and the $22.2 million spent in Pennsylvania.
Since May 20, Democratic ad airings have outnumbered Republican ad airings in most of the top Senate races, though Pennsylvania and Michigan are exceptions. Still, some of the ad spending in Senate races was for primary elections taking place after May 20. For example, the two candidates in Nevada aired ads for the Republican nomination, which was June 11th. Sam Brown defeated Jeff Gunter, and Brown will take on Democratic incumbent Jacky Rosen in the fall campaign.
In some states, outside groups have dominated the spending. For instance, over 95 percent of pro-Republican ads in Ohio were sponsored by groups, and over 90 percent of the pro-Republican ads in Pennsylvania were sponsored by groups.
“Control of the Senate is likely to be as hotly contested as the presidential race,” said Michael Franz, co-director of the Wesleyan Media Project. “Outside groups and the party committees will surely invest heavily in the tightest races, knowing that control of that chamber will have profound implications for the policy agenda of the new President.”
Table 4: Ad Airings and Cost in Senate Races (May 20-August 11)
| State | Airings | Est Spend (in $Ms) | Dem airings | Rep Airings | Dem grp % | Rep grp % | Primary Date |
|---|---|---|---|---|---|---|---|
| MT | 77,688 | $23.10 | 41,111 | 36,577 | 19.10% | 40.80% | 6/4/24 |
| OH | 29,827 | $24.60 | 22,160 | 7,667 | 36.30% | 95.50% | 3/19/24 |
| WI | 29,657 | $13.10 | 16,117 | 13,540 | 16.30% | 27.20% | 8/13/24 |
| PA | 28,786 | $22.20 | 13,968 | 14,818 | 30.20% | 92.40% | 4/23/24 |
| NV | 22,321 | $12.50 | 17,463 | 4,858 | 22.50% | 47.40% | 6/11/24 |
| AZ | 12,340 | $5.60 | 8,107 | 4,233 | 9.30% | 34.30% | 7/30/24 |
| MI | 11,532 | $6.90 | 5,374 | 6,158 | 6.50% | 76.00% | 8/6/24 |
| TX | 6,668 | $4.00 | 6,354 | 314 | 0.00% | 8.90% | 3/5/24 |
| UT | 6,549 | $2.80 | 0 | 6,549 | 66.00% | 6/25/24 | |
| NM | 4,641 | $1.00 | 1,781 | 2,860 | 0.00% | 0.00% | 6/4/24 |
| VA | 2,046 | $0.72 | 0 | 2,046 | 35.10% | 6/18/24 | |
| MD | 2,027 | $1.40 | 526 | 1,501 | 0.00% | 0.00% | 5/14/24 |
| FL | 1,521 | $1.50 | 78 | 1,443 | 0.00% | 0.00% | 8/20/24 |
| ND | 1,328 | $0.15 | 1,328 | 0 | 0.00% | 6/11/24 | |
| WY | 1,325 | $0.13 | 0 | 1,325 | 23.40% | 8/20/24 | |
| MO | 1,147 | $0.38 | 836 | 311 | 0.00% | 0.00% | 8/6/24 |
| TN | 557 | $0.25 | 0 | 557 | 0.00% | 8/1/24 | |
| NE | 146 | $0.01 | 0 | 0 | 5/14/24 | ||
| RI | 104 | $0.06 | 104 | 0 | 0.00% | 9/10/24 | |
| CA | 32 | $0.01 | 32 | 0 | 25.00% | 3/5/24 | |
| VT | 18 | $0.00 | 0 | 18 | 0.00% | 8/13/24 | |
| Figures are from May 20, 2024, to August 11, 2024. Numbers include broadcast television for all sponsors. CITE SOURCE OF DATA AS: Vivvix CMAG with analysis by the Wesleyan Media Project. |
|||||||
Virginia-05, Oklahoma-04 Top House Races
The battle for control of the House is also in full swing. Table 5 shows the top House races ordered by the number of ad airings. A competitive Republican primary in Virginia’s 5th congressional district—in which incumbent Bob Good was defeated—resulted in over 15,000 ad airings. A well-funded challenger in the Republican primary race in Oklahoma’s 4th district also put that race near the top.
In terms of spending, New York’s 16th congressional district was the most costly, with over $12 million in ad spending. George Latimer defeated incumbent Jamaal Bowman for the Democratic nomination in that district.
Outside groups have also been heavily involved in many of these races, as well, often in the competitive primaries of one of the parties.
Table 5: Ad Airings and Cost in U.S. House Races (May 20-August 11)
| District | Airings | Est Spend (in $Ms) | Dem airings | Rep Airings | Dem grp % | Rep grp % | Primary Date |
|---|---|---|---|---|---|---|---|
| VA05 | 15,383 | $4.85 | 0 | 15,383 | 87.2% | 6/18/24 | |
| OK04 | 12,464 | $3.67 | 0 | 12,464 | 21.7% | 6/18/24 | |
| AK01 | 10,463 | $1.20 | 8,573 | 1,890 | 30.2% | 68.2% | 8/20/24 |
| MO01 | 9,470 | $9.76 | 9,470 | 0 | 64.2% | 8/6/24 | |
| MI08 | 7,288 | $2.07 | 2,038 | 5,250 | 0.0% | 10.4% | 8/6/24 |
| NY16 | 6,890 | $12.63 | 6,890 | 0 | 67.4% | 6/25/24 | |
| MO03 | 5,872 | $5.01 | 0 | 5,872 | 80.8% | 8/6/24 | |
| CO03 | 5,853 | $0.77 | 1,846 | 4,007 | 0.0% | 9.3% | 6/25/24 |
| ND01 | 5,119 | $1.37 | 0 | 5,119 | 58.1% | 6/11/24 | |
| SC01 | 5,068 | $2.18 | 179 | 4,889 | 0.0% | 83.8% | 6/11/24 |
| MT02 | 4,758 | $0.68 | 0 | 4,758 | 15.2% | 6/4/24 | |
| CO05 | 4,733 | $1.14 | 0 | 4,733 | 83.7% | 6/25/24 | |
| AZ08 | 4,653 | $2.95 | 0 | 4,653 | 35.0% | 7/30/24 | |
| WA03 | 4,160 | $1.69 | 2,928 | 1,232 | 0.0% | 29.0% | 8/6/24 |
| NY22 | 3,398 | $0.38 | 3,094 | 304 | 6.7% | 100.0% | 6/25/24 |
| VA10 | 3,276 | $3.95 | 3,276 | 0 | 69.9% | 6/18/24 | |
| AZ01 | 3,148 | $2.10 | 2,754 | 394 | 0.1% | 100.0% | 7/30/24 |
| VA07 | 3,084 | $2.01 | 1,601 | 1,483 | 66.5% | 100.0% | 6/18/24 |
| WI08 | 3,038 | $1.13 | 0 | 3,038 | 40.2% | 8/13/24 | |
| AZ03 | 2,949 | $3.24 | 2,949 | 0 | 68.7% | 7/30/24 | |
| Figures are from May 20, 2024, to August 11, 2024. Numbers include broadcast television for all sponsors. CITE SOURCE OF DATA AS: Vivvix CMAG with analysis by the Wesleyan Media Project. |
|||||||
About the Data
Television ad totals reported here are from Vivvix CMAG (unless otherwise specified) and refer to broadcast television. All cost estimates for television are precisely that: estimates.
About this Report
The Wesleyan Media Project provides real-time tracking and analysis of all political television advertising in an effort to increase transparency in elections. Housed in Wesleyan’s Quantitative Analysis Center – part of the Allbritton Center for the Study of Public Life – the Wesleyan Media Project is the successor to the Wisconsin Advertising Project, which disbanded in 2009. It is directed by Erika Franklin Fowler, professor of government at Wesleyan University, Michael M. Franz, professor of government at Bowdoin College and Travis N. Ridout, professor of political science at Washington State University. WMP personnel include Breeze Floyd (Program Manager), Pavel Oleinikov (Associate Director, QAC), Yujin Kim (Post-Doctoral Fellow) and Meiqing Zhang (Post-Doctoral Fellow).
The Wesleyan Media Project’s real-time tracking in 2024 is supported by Wesleyan University and the John S. and James L. Knight Foundation. The Wesleyan Media Project is partnering again this year with OpenSecrets, to provide added information on outside group disclosure and candidate status.
Periodic releases of data will be posted on the project’s website and dispersed via LinkedIn, Bluesky @wesmediaproject.bsky.social and Twitter @wesmediaproject. To be added to our email update list, click here.
For more information contact: media@wesleyan.edu.
About Wesleyan University
Wesleyan University, in Middletown, Conn., is known for the excellence of its academic and co-curricular programs. With more than 2,900 undergraduates and 200 graduate students, Wesleyan is dedicated to providing a liberal arts education characterized by boldness, rigor and practical idealism. For more, visit www.wesleyan.edu.
About the John S. and James L. Knight Foundation
We are social investors who support democracy by funding free expression and journalism, arts and culture in community, research in areas of media and democracy, and in the success of American cities and towns where the Knight brothers once had newspapers. Learn more at kf.org and follow @knightfdn on social media.