Nearly $300 Million in Presidential Ad Spending Across Platforms Over Past Two Weeks
(MIDDLETOWN, CT) October 24, 2024 – During the past two weeks, pro-Trump ads outnumbered pro-Harris ads on broadcast television by about 10,000 airings, according to a new report from the Wesleyan Media Project. Table 1 shows that pro-Trump ads numbered about 71,000 during the October 7 to October 20 time period, while pro-Harris ads numbered about 61,000. This is a change from recent weeks, when pro-Harris ads heavily out-weighed pro-Trump spots. However, Harris and her allies are airing advertising on national network and national cable television, which count as one airing but air in every media market across the country, including battleground markets.
The Trump campaign accounted for the vast majority of the pro-Republican advertising, though MAGA, Inc., Preserve America PAC and Restoration PAC also chipped in about 16,000 ads. FF PAC accounted for over 40 percent of the pro-Harris advertising in the last two weeks.
Table 1: TV Ad Spending in Presidential Race (October 7 to 20)
| Party Lean | Ad Airings | Est. Cost (in $Ms) |
|
|---|---|---|---|
| Harris, Kamala | Dem | 31,314 | 35.93 |
| FF PAC | Dem | 25,144 | 54.46 |
| Trump, Donald | Rep | 52,323 | 39.02 |
| Make America Great Again Inc. | Rep | 10,163 | 27.68 |
| Preserve America PAC | Rep | 3,902 | 9.15 |
| Restoration PAC | Rep | 2,343 | 6.5 |
| All pro Harris | 61,166 | 104.76 | |
| All pro Trump | 71,344 | 95.44 | |
| Figures are from October 7 to 20, 2024. Numbers include local broadcast television, national network, and national cable for all sponsors. CITE SOURCE OF DATA AS: Vivvix CMAG with analysis by the Wesleyan Media Project. |
|||
Pro-Harris TV Ads Plummet Before Rebounding
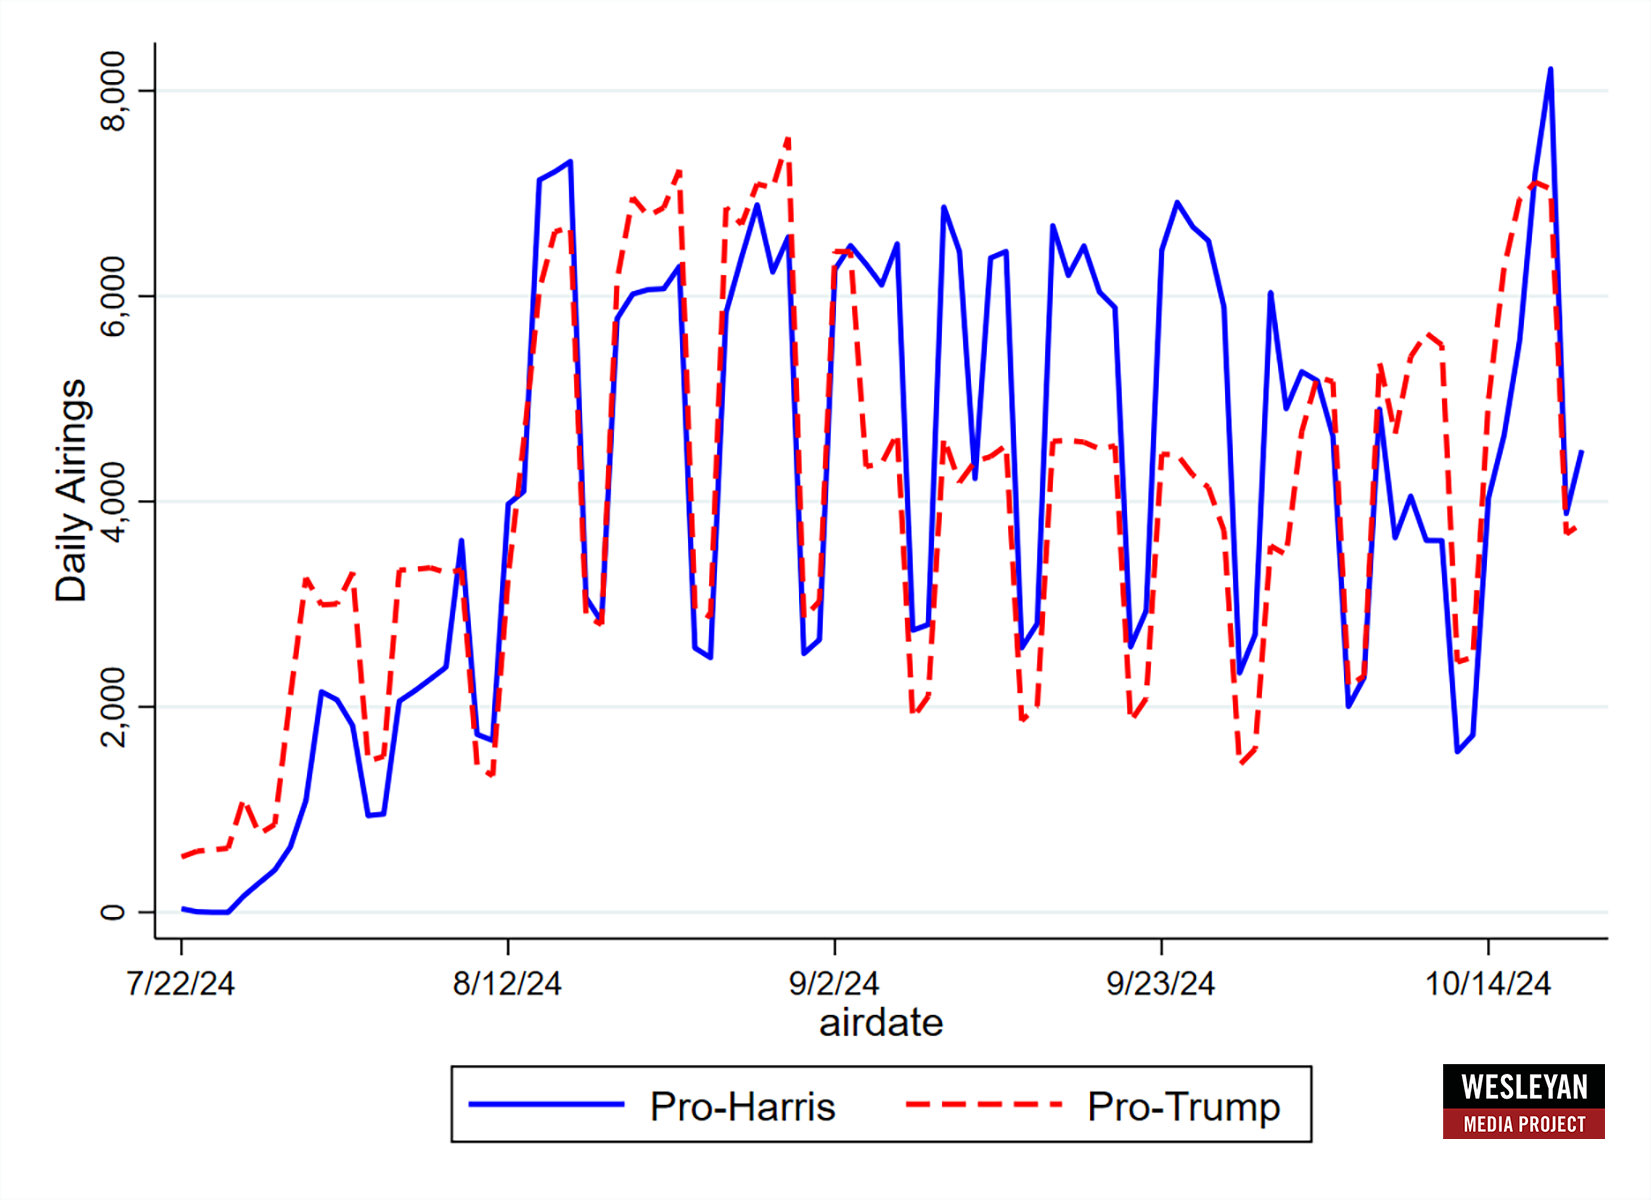
One reason for the pro-Trump ad advantage was a huge drop in the volume of pro-Harris ads from the last week of September until the middle of October, as Figure 1 shows. Pro-Harris ads dropped from well over 6,000 per weekday to under 4,000 per weekday. (As we note later in the report, some of Harris’ ad buys are at the national level, meaning they count as one airing but are seen in every battleground and non-battleground market. National cable advertising is typically a smaller audience than national network). However, pro-Harris ads spiked to over 8,000 on Friday of this past week, higher than the volume of pro-Trump ads.
“After dominating the airwaves for all of September, pro-Harris ads took a huge dive in the first couple weeks of October,” said Travis Ridout, co-director of the Wesleyan Media Project. “It’s hard to know whether Friday’s substantial boost in pro-Harris ads is a sign of things to come or whether we can expect Trump ads to be more dominant on the airwaves in the campaign’s homestretch.”
Figure 1: Volume of Pro-Harris and Pro-Trump Ad Airings by Day
Numbers include local broadcast television, national network, and national cable for all sponsors.
CITE SOURCE OF DATA AS: Vivvix CMAG with analysis by the Wesleyan Media Project.
TV and Radio Ads Top $250 Million over Last Two Weeks
Table 2 shows that while Harris and group allies aired fewer broadcast ads than Trump and supporters over the past two weeks, her camp did spend more money on advertising overall ($137 million to $112 million). Part of the reason for this is the disproportionate reliance by the Democrats on ads from FF PAC. As a group, it tends to pay higher rates than candidates. Moreover, as we show below, Harris has spent more money on national cable and national network buys. These ads air across the country, even in non-battleground states, and they cost significantly more than broadcast buys at the media market level.
In terms of ad placement, Harris and group allies had higher spending on local cable and radio ($31 million combined) than did Trump and group allies ($13 million). Spending by Trump and group allies was higher on satellite television, though spending totals there are lower overall.
Table 2: TV and Radio Ad Spending in Presidential Race (October 7-20)
| Party Lean | Total Ad Spending (in $Ms) | Local Cable (in $Ms) | National Cable (in $Ms) | Radio (in Ms) | Satellite TV (in $Ms) |
|
|---|---|---|---|---|---|---|
| FF PAC | Dem | 71 | 8.91 | 7.1 | 7.23 | 0.865 |
| Harris, Kamala | Dem | 48 | 6.66 | 5.07 | 4.53 | 1.119 |
| Project Freedom LLC | Dem | 6.7 | 1.43 | 0.032 | ||
| Republican Accountability PAC | Dem | 4 | 0.52 | 0.086 | ||
| FF PAC & Climate Power Act. & LCV Victory Fund | Dem | 3.4 | ||||
| Future Forward USA Action | Dem | 1.3 | 0.31 | |||
| United Association of Union Plumbers & Pipefitters | Dem | 0.91 | 0.016 | |||
| Black PAC | Dem | 0.37 | 0.37 | |||
| AB PAC | Dem | 0.33 | 0.33 | |||
| Anti-Psychopath PAC Inc. | Dem | 0.29 | 0.19 | 0.1 | ||
| America's Future Majority Fund | Dem | 0.23 | 0.23 | |||
| Voters of These 50 States of America | Dem | 0.21 | 0.21 | |||
| Somos PAC & FF PAC | Dem | 0.18 | 0.18 | |||
| Harris, Kamala & Democratic National Committee | Dem | 0.16 | 0.1 | |||
| Black Voters Matter Action PAC | Dem | 0.071 | 0.071 | |||
| Fair Future NC | Dem | 0.066 | 0.066 | |||
| Unite The Country | Dem | 0.054 | 0.019 | |||
| Defending Democracy Together | Dem | 0.052 | 0.017 | |||
| Nebraska IBEW State Electrical Council | Dem | 0.039 | 0.005 | |||
| Healthcare For Action | Dem | 0.016 | 0.016 | |||
| Make The Road Nevada | Dem | 0.006 | ||||
| Working Families Party PAC | Dem | 0.005 | 0.005 | |||
| All pro-Harris Advertising | 137.39 | 18.05 | 12.42 | 13.31 | 2 | |
| Trump, Donald | Rep | 49 | 6.18 | 1.23 | 2.056 | |
| Make America Great Again Inc. | Rep | 29 | 1.33 | 0.44 | 0.077 | 0.118 |
| Preserve America PAC | Rep | 10 | 1 | 0.257 | ||
| Right For America | Rep | 10 | 1.41 | 0.15 | 1.27 | 0.175 |
| Restoration PAC | Rep | 7.3 | 0.76 | 0.017 | ||
| Dan Newlin Injury Attorneys | Rep | 2.8 | 0.13 | |||
| RJC Victory Fund | Rep | 2.8 | 0.93 | |||
| Americas PAC | Rep | 0.44 | 0.44 | |||
| Majority PAC | Rep | 0.32 | 0.29 | |||
| NRA Political Victory Fund | Rep | 0.18 | 0.18 | |||
| Make America Healthy Again Alliance | Rep | 0.18 | ||||
| Conservatives For Effective Government | Rep | 0.14 | 0.14 | |||
| Article III Foundation | Rep | 0.064 | 0.064 | |||
| Americans For Constitutional Liberty | Rep | 0.029 | 0.029 | |||
| Fair Election Fund | Rep | 0.015 | 0.015 | |||
| Sticker PAC | Rep | 0.009 | 0.009 | |||
| Turning Point PAC | Rep | 0.005 | 0.005 | |||
| All pro-Trump Advertising | 112.27 | 11.32 | 2.77 | 2.01 | 2.61 | |
| Figures are from October 7-20, 2024. Total column includes spending for local broadcast TV airings and national network airings in addition to cable, radio, and satellite. CITE SOURCE OF DATA AS: Vivvix CMAG with analysis by the Wesleyan Media Project. |
||||||
Harris Continues Lead over Trump on Meta and Google
Despite recent spikes in pro-Trump ads on broadcast television, Harris continues to out-spend Trump on Meta and Google platforms. In the last two weeks, Harris spent about $27 million on both platforms, to Trump’s $8.6 million.
Notably, for this period, spending on Google is significantly smaller than what the Wesleyan Media Project reported in our last release. In the two weeks preceding the ones reported below, Harris spent $35 million on Google, and Trump spent $13 million. Spending by Harris and Trump on Meta is up slightly in these last two weeks compared to the two-week period at the end of September and beginning of October.
Table 3: Digital Spending by the Candidates on Meta and Google
| Harris | 14.9 | 11.8 | 26.6 |
| Trump | 3.7 | 4.9 | 8.6 |
| Figures for last two weeks are from October 6 (for Meta, which includes Facebook and Instagram) and October 6 (for Google, which includes search advertising, YouTube, and third-party advertising) to October 19, 2024. Numbers for campaigns include joint fundraising committee advertising. National party spending is excluded if it occurs only on the national party pages and/or does not contain any reference to a presidential sponsor in the disclaimer. CITE SOURCE OF DATA AS: Meta Ad Library and Google Transparency Report with analysis by the Wesleyan Media Project. |
|||
Atlanta Tops Markets for TV Ads in Presidential Race; Trump Out-Airs Harris in Top 5 Markets
Atlanta saw the most broadcast ads in the presidential races over the past two weeks, over 9,000 (Table 4 and Figure 2). Other top media markets were Phoenix, Philadelphia, Charlotte and Grand Rapids, Michigan. In all of these top markets, pro-Trump airings were higher than pro-Harris airings. In fact, pro-Trump ads in the last two weeks out-number pro-Harris ads in 16 of the top 20 markets.
Still, pro-Harris forces have aired nearly 2,000 spots on national cable and an additional 900 spots on national networks (Table 4). Because these ads are seen across the country, they could also count as part of Harris’ ad totals in battleground states, particularly for national network buys that have audiences similar to local broadcast. For example, while Trump has aired over 1,100 more ads than Harris in Atlanta, her national cable and national network advantage (totaling over 2,400 spots) more than makes up for that difference.
Table 4: Broadcast Ad Spending in Presidential Race by Market (October 7-20)
| Market | Total Ad Airings | Pro-Harris Airings | Pro-Trump Airings | Dem Ad Advantage | Est. Cost (in $Ms) | Pro-Harris (in $Ms) | Pro-Trump (in $Ms) |
|---|---|---|---|---|---|---|---|
| Atlanta | 9,225 | 4,038 | 5,187 | -1,149 | 19.58 | 9.33 | 10.3 |
| Phoenix | 8,182 | 3,746 | 4,432 | -686 | 15.11 | 6.73 | 8.38 |
| Philadelphia | 7,499 | 3,591 | 3,908 | -317 | 19.39 | 7.17 | 12.2 |
| Charlotte | 5,939 | 2,786 | 3,152 | -366 | 6.9 | 3.8 | 3.11 |
| Grand Rapids | 5,712 | 2,394 | 3,316 | -922 | 5.9 | 2.31 | 3.6 |
| Raleigh | 4,917 | 2,626 | 2,290 | 336 | 7.44 | 4.62 | 2.82 |
| Tucson | 4,862 | 2,837 | 2,025 | 812 | 3.11 | 2.27 | 0.84 |
| Detroit | 4,790 | 2,632 | 2,156 | 476 | 15.94 | 7.08 | 8.86 |
| Pittsburgh | 4,434 | 1,739 | 2,695 | -956 | 11.29 | 3.64 | 7.66 |
| Harrisburg | 4,351 | 1,820 | 2,530 | -710 | 6.56 | 2.7 | 3.87 |
| Las Vegas | 4,330 | 1,761 | 2,569 | -808 | 4.96 | 2.29 | 2.67 |
| Milwaukee | 4,119 | 2,186 | 1,932 | 254 | 7.92 | 4.01 | 3.91 |
| Greensboro | 3,781 | 1,607 | 2,173 | -566 | 3.6 | 2.54 | 1.06 |
| Green Bay | 3,755 | 1,846 | 1,908 | -62 | 5.19 | 2.28 | 2.92 |
| Flint | 3,302 | 1,376 | 1,924 | -548 | 3.06 | 1.19 | 1.87 |
| Savannah | 3,226 | 1,351 | 1,874 | -523 | 1.78 | 1.24 | 0.53 |
| Madison | 3,219 | 1,456 | 1,762 | -306 | 2.55 | 1.33 | 1.22 |
| Johnstown | 3,208 | 1,037 | 2,170 | -1,133 | 2.3 | 0.69 | 1.61 |
| Macon | 3,180 | 1,118 | 2,061 | -943 | 1 | 0.69 | 0.31 |
| Augusta | 3,148 | 1,148 | 1,999 | -851 | 1.22 | 0.78 | 0.44 |
| Greenville, NC | 3,041 | 1,225 | 1,815 | -590 | 1.54 | 0.72 | 0.82 |
| Wilkes Barre | 2,491 | 780 | 1,710 | -930 | 3.27 | 0.99 | 2.28 |
| Reno | 2,358 | 743 | 1,615 | -872 | 1.79 | 1.11 | 0.68 |
| Wilmington | 2,303 | 877 | 1,425 | -548 | 0.78 | 0.51 | 0.26 |
| National Cable | 2,237 | 1,916 | 321 | 1,595 | 15.19 | 12.4 | 2.77 |
| Columbus, GA | 2,202 | 874 | 1,327 | -453 | 0.63 | 0.35 | 0.28 |
| Albany, GA | 1,998 | 814 | 1,184 | -370 | 0.49 | 0.26 | 0.23 |
| Lansing | 1,847 | 452 | 1,394 | -942 | 1 | 0.47 | 0.53 |
| La Crosse | 1,782 | 750 | 1,031 | -281 | 1.21 | 0.56 | 0.66 |
| Traverse City | 1,721 | 627 | 1,094 | -467 | 0.3 | 0.1 | 0.2 |
| Wausau | 1,580 | 486 | 1,093 | -607 | 1.54 | 0.39 | 1.15 |
| Greenville, SC | 1,538 | 329 | 1,209 | -880 | 0.8 | 0.25 | 0.55 |
| Erie | 1,436 | 519 | 917 | -398 | 1.28 | 0.49 | 0.79 |
| Tallahassee | 1,234 | 472 | 761 | -289 | 0.24 | 0.11 | 0.12 |
| Marquette | 1,170 | 504 | 666 | -162 | 0.29 | 0.089 | 0.2 |
| National Network | 943 | 893 | 41 | 852 | 22.41 | 17.2 | 5.13 |
| Norfolk | 705 | 411 | 293 | 118 | 0.26 | 0.12 | 0.14 |
| South Bend | 546 | 222 | 323 | -101 | 0.12 | 0.064 | 0.058 |
| Minneapolis | 493 | 184 | 308 | -124 | 0.43 | 0.2 | 0.23 |
| Houston | 466 | 461 | 4 | 457 | 0.74 | 0.74 | 0 |
| Yuma-El Centro | 395 | 395 | 0 | 395 | 0.21 | 0.21 | 0 |
| Alpena | 356 | 107 | 249 | -142 | 0.28 | 0.12 | 0.16 |
| Youngstown | 291 | 288 | 2 | 286 | 0.11 | 0.11 | 0 |
| Omaha | 264 | 260 | 3 | 257 | 0.21 | 0.21 | 0 |
| Myrtle Beach | 232 | 226 | 5 | 221 | 0.05 | 0.054 | 0 |
| Toledo | 158 | 156 | 2 | 154 | 0.08 | 0.083 | 0 |
| Albuquerque | 157 | 154 | 2 | 152 | 0.02 | 0.02 | 0 |
| Chattanooga | 147 | 142 | 4 | 138 | 0.04 | 0.041 | 0 |
| Duluth | 133 | 131 | 2 | 129 | 0.06 | 0.063 | 0 |
Figures are from October 7 to October 20, 2024.
Numbers include local broadcast television for all sponsors in each market. National cable and national network airings are shown in separate rows.
CITE SOURCE OF DATA AS: Vivvix CMAG with analysis by the Wesleyan Media Project.
Figure 2: Presidential Advertising Advantages by Media Market and Party
Figures are from July 22 to October 20, 2024 and October 7 to October 20, 2024.
Numbers include local broadcast television for all presidential sponsors (excluding national network and cable airings, which advantage Harris).
CITE SOURCE OF DATA AS: Vivvix CMAG with analysis by the Wesleyan Media Project.
Harris Increases Focus on Abortion; Trump Continues Attack on Gender Identity
The top issues for the Harris campaign in the past two weeks were abortion and women’s rights, which appeared in about a third of her ads (Table 5). Harris also focused on national defense, the economy, and inflation. FF PAC, a super PAC supportive of Harris, by contrast, focused most of its advertising on taxes, particularly the Trump tax cuts.
Trump’s ads over the past two weeks focused on taxes, and a considerable number (41 percent) mentioned the topic of gender identity in terms of transgender rights, more specifically on Harris’ comments about sex change access for prisoners. MAGA, Inc. focused on public safety, while Preserve America PAC had immigration as its top issue (with gender identity mentioned in nearly 80 percent of their airings, as well).
Table 5: Top Issues by Sponsor in Presidential Race (October 7-20)
| % of Airings | % of Airings | |||||
|---|---|---|---|---|---|---|
| Harris, Kamala | Abortion | 32.0% | Trump, Donald | Taxes | 98.5% | |
| (31,314 Airings) | Women's Rights | 30.4% | (52,323 Airings) | Gender identity | 41.1% | |
| National Defense | 25.7% | Jobs | 31.5% | |||
| Economy | 24.5% | Economy | 31.3% | |||
| Inflation | 20.7% | Immigration | 27.4% | |||
| Health Care | 20.4% | Seniors | 25.8% | |||
| Taxes | 19.5% | Social Security | 25.6% | |||
| Inflation | 23.8% | |||||
| FF PAC | Taxes | 73.4% | Budget | 23.5% | ||
| (25,144 Airings) | Oil/Gas Prices | 27.9% | Int'l affairs/war | 23.5% | ||
| Economy | 25.4% | |||||
| Inflation | 25.4% | MAGA Inc. | Public safety | 100.0% | ||
| Social Security | 15.9% | (10,163 Airings) | Immigration | 13.0% | ||
| Retirement | 14.0% | |||||
| Preserve America PAC | Immigration | 85.8% | ||||
| (3,902 Airings) | Taxes | 78.6% | ||||
| Health care | 78.6% | |||||
| Gender identity | 78.6% | |||||
| Jobs | 39.4% | |||||
| Economy | 39.2% | |||||
| Inflation | 39.2% | |||||
| Public safety | 21.4% | |||||
| Restoration PAC | Inflation | 100.0% | ||||
| (2,343 Airings) | Minimum wage | 100.0% | ||||
| Economy | 100.0% | |||||
| Figures are from October 7-20, 2024. Numbers include local broadcast television, national network, and national cable for all sponsors. CITE SOURCE OF DATA AS: Vivvix CMAG with analysis by the Wesleyan Media Project. |
||||||
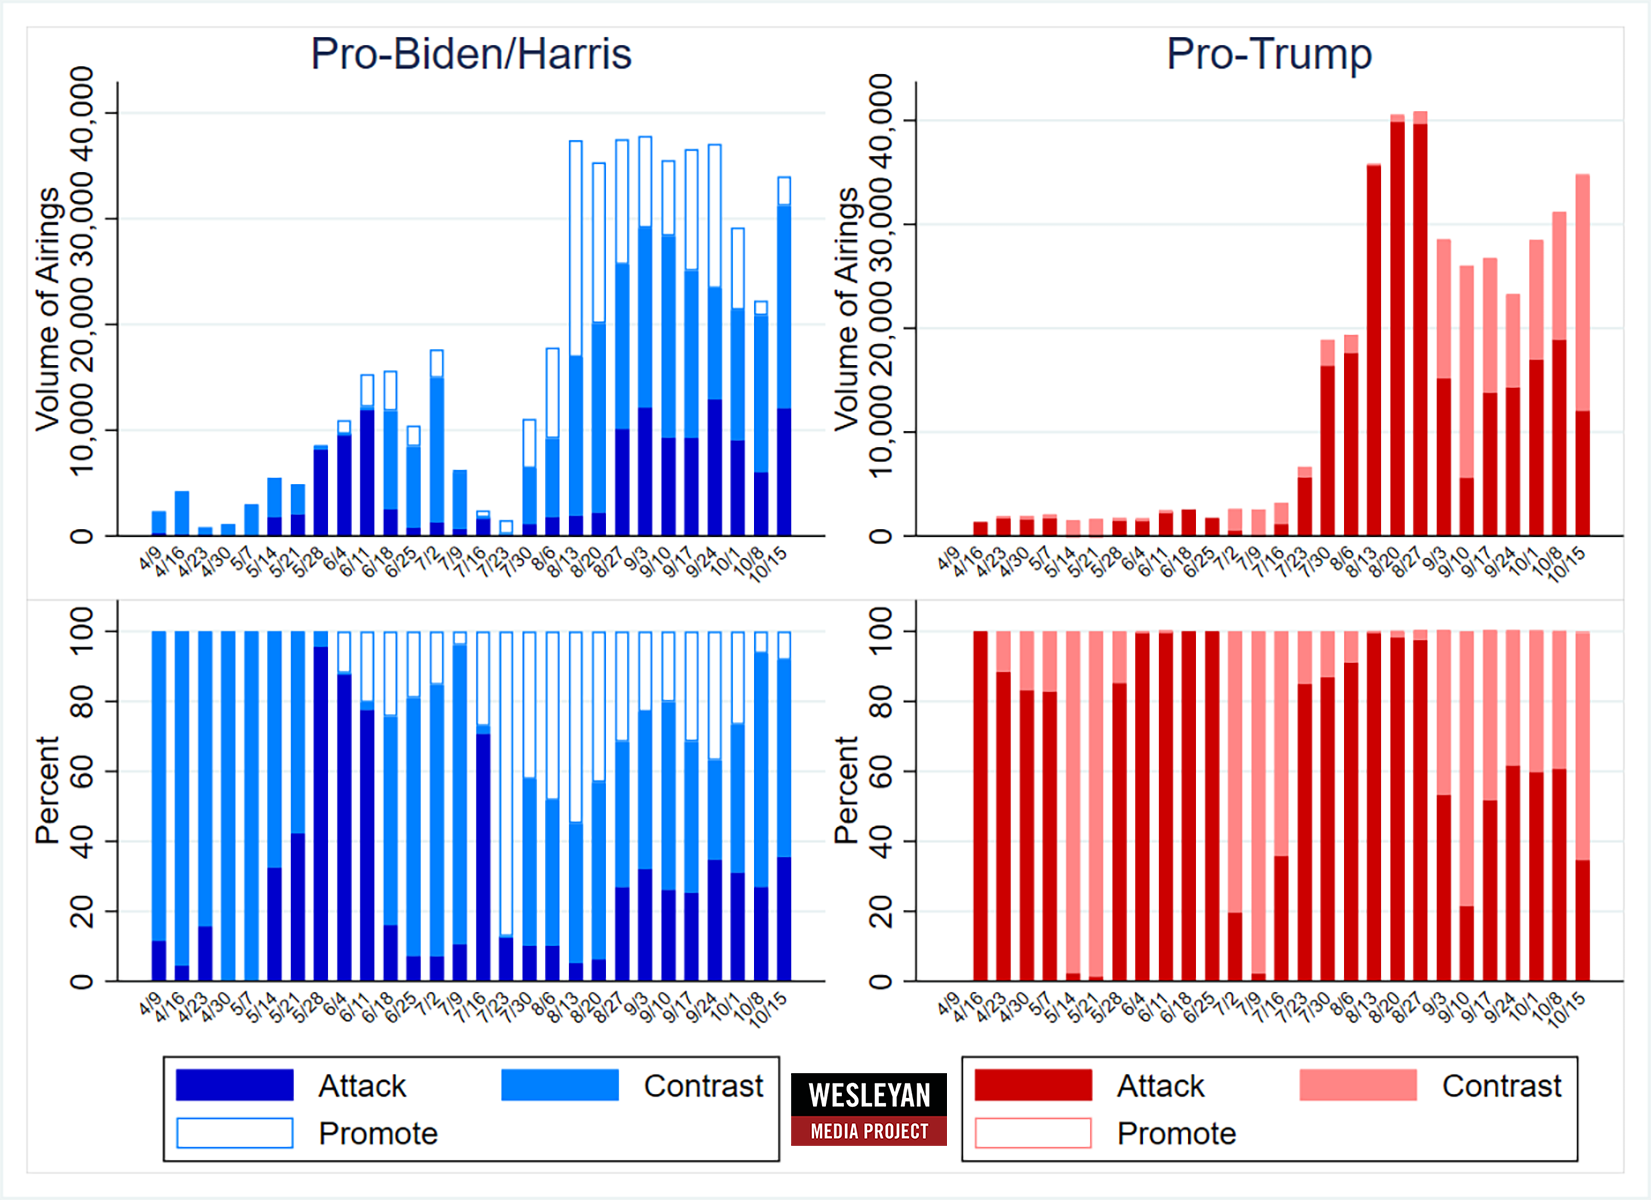
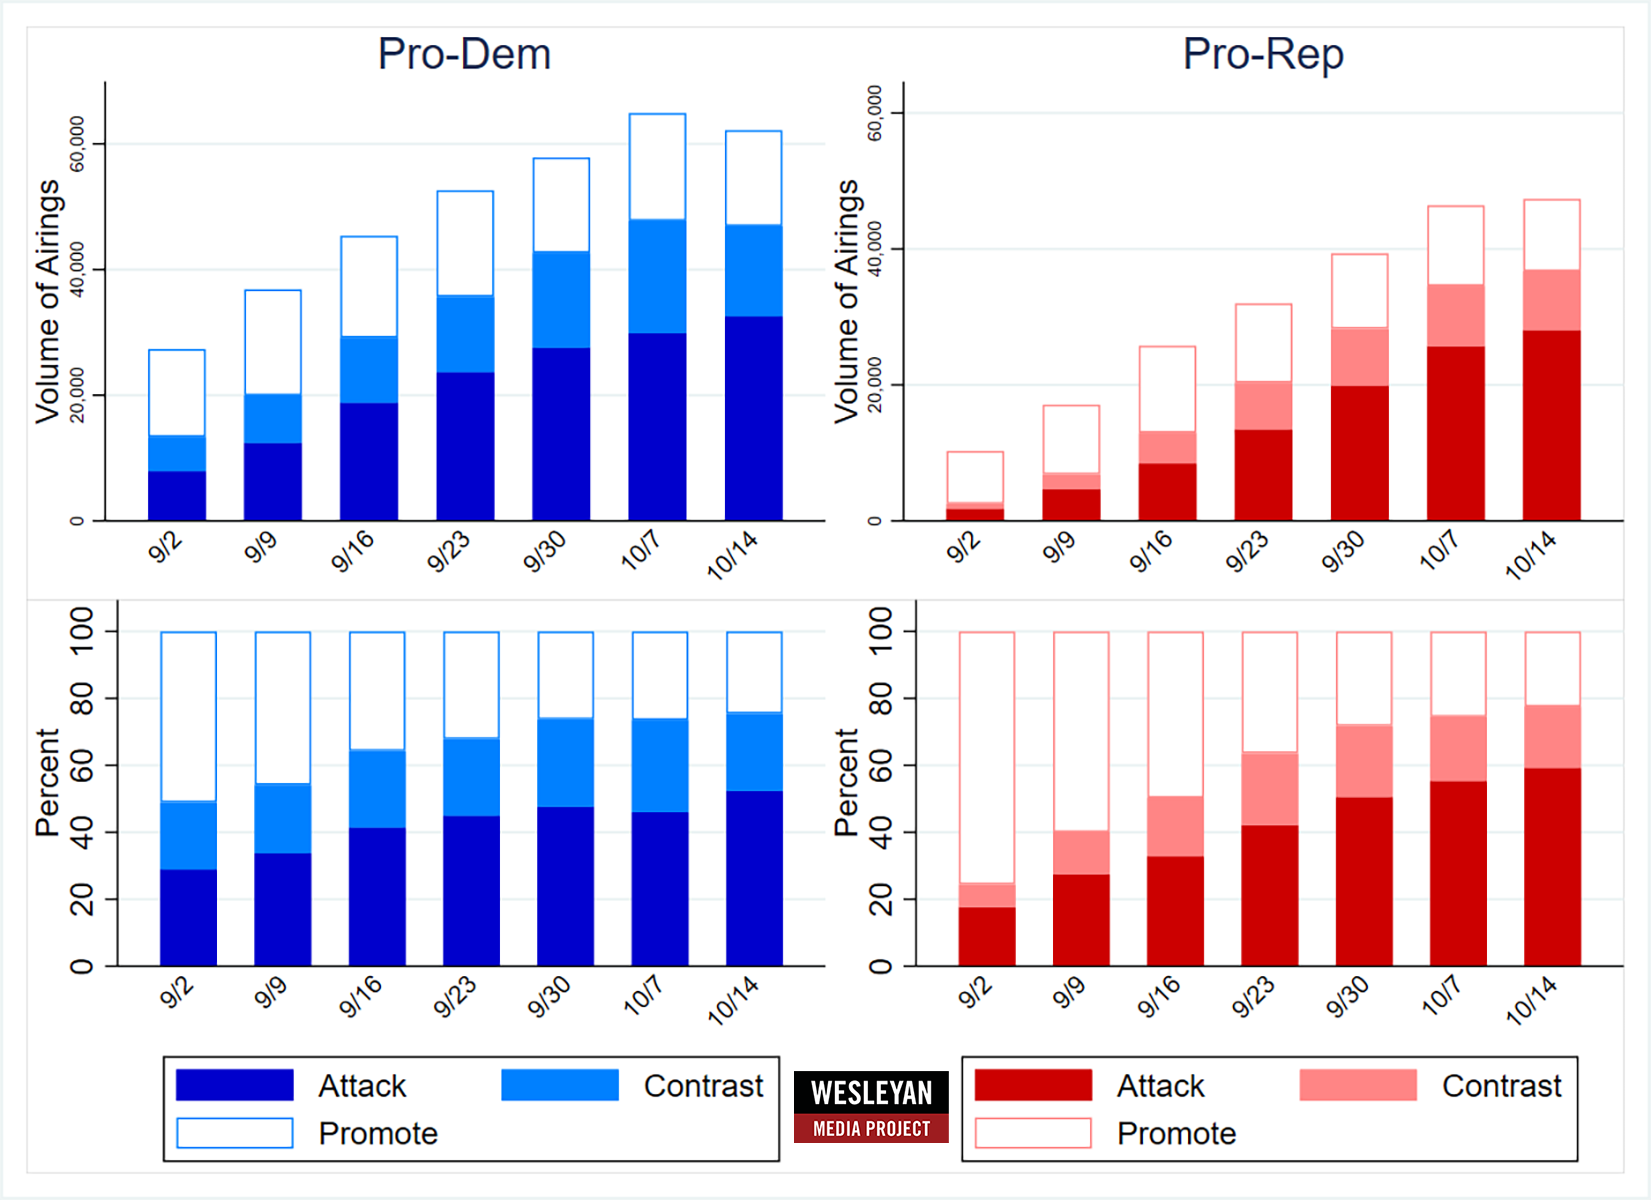
Positive Ads in Pres Race Almost Disappear
Figure 3 shows the tone of political advertising in the presidential race by week, with the top panels showing the percentage of ads that are attack, contrast (mentioning both the favored candidate and an opponent) and positive (mentioning only the favored candidate). The top panels show the volume of ads in each category, while the bottom panels show the percentage of ads in each category.
A couple of things stand out. First, while pro-Harris advertisers had been running a considerable number of positive ads, they have almost disappeared over the past two weeks, with fewer than one in ten ads focused on the favored candidate. At the same time, there have been no pro-Trump positive ads the entire campaign. Second, campaigns are eschewing attack ads in favor of contrast ads, with the vast majority of pro-Harris and pro-Trump ads falling into this category.
“The decline in positive ads from Harris likely reflects the campaign’s sense that the outcome of the election will rest on swing voters still deciding between the two candidates,” said Michael Franz, co-director of the Wesleyan Media Project. “Harris previously spent considerable sums re-introducing herself to voters. Now, her campaign likely sees the need to make comparisons with Trump and establish the high stakes at play.”
Figure 3: Volume and Tone of Presidential Ads by Week (April 9 to October 20)
Numbers include local broadcast television, national network, and national cable for all sponsors.
CITE SOURCE OF DATA AS: Vivvix CMAG with analysis by the Wesleyan Media Project.
OH and MT Top List of Senate Ad Airings; Dems Remain Very Active in TX Race and Independent Candidate in NE Out-airing GOP
The Senate races in Ohio and Montana continued to see the most ad airings over the past two weeks, with over 35,000 airings in each (Table 6). The majority of those ads in both races were sponsored by outside groups. The Senate race in Texas is third on the list, with ads favoring Democrat Colin Allred more than double the number favoring Republican Ted Cruz.
The Senate race in Nebraska is heating up as well. Independent candidate Dan Osborn has benefited from nearly 8,000 ads in his favor over the past two weeks, much more than the 6,700 favoring incumbent Republican Deb Fischer.
Table 6: Volume of Ad Airings and Spending in Senate Races (October 7-20)
| State | Airings | Est. Cost (in $Ms) | Pro-Dem Airings | Pro-GOP Airings | Dem Airing Advantage | % D from Groups | % R from Groups |
|---|---|---|---|---|---|---|---|
| OH | 38,404 | 42.74 | 22,197 | 16,207 | 5,990 | 51.6% | 74.5% |
| MT | 35,385 | 26.52 | 19,262 | 16,123 | 3,139 | 48.4% | 65.9% |
| TX | 26,581 | 16.7 | 18,085 | 8,496 | 9,589 | 0.0% | 36.0% |
| WI | 19,742 | 22.48 | 9,205 | 10,537 | -1,332 | 39.6% | 29.1% |
| PA | 16,815 | 30.39 | 7,908 | 8,907 | -999 | 46.8% | 57.1% |
| MI | 15,603 | 24.65 | 7,806 | 7,797 | 9 | 34.4% | 40.0% |
| NE+ | 14,625 | 6.68 | 0 | 6,736 | -6,736 | 33.7% | |
| NV | 12,184 | 12.99 | 6,744 | 5,440 | 1,304 | 34.4% | 8.3% |
| AZ | 10,318 | 15.65 | 7,391 | 2,927 | 4,464 | 41.1% | 46.3% |
| MD | 10,191 | 13.44 | 5,529 | 4,662 | 867 | 37.3% | 74.6% |
| VA | 6,955 | 1.72 | 5,563 | 1,392 | 4,171 | 0.0% | 0.0% |
| FL | 6,792 | 6.35 | 4,199 | 2,593 | 1,606 | 0.0% | 0.0% |
| NM | 5,612 | 1.82 | 2,546 | 3,066 | -520 | 11.5% | 0.0% |
| TN | 5,185 | 0.82 | 1,883 | 3,302 | -1,419 | 0.0% | 0.0% |
| MO | 3,297 | 1.76 | 2,008 | 1,289 | 719 | 8.0% | 0.2% |
| WA | 3,085 | 0.84 | 3,053 | 32 | 3,021 | 0.0% | 0.0% |
| CA | 1,958 | 0.83 | 274 | 1,684 | -1,410 | 0.0% | 0.0% |
| ND | 1,607 | 0.31 | 564 | 1,043 | -479 | 0.0% | 0.0% |
| NY | 1,524 | 1.64 | 1,524 | 0 | 1,524 | 0.0% | |
| MN | 1,338 | 0.47 | 1,338 | 0 | 1,338 | 0.0% | |
| ME+ | 1,115 | 0.44 | 0 | 186 | -186 | 0.0% | |
| RI | 638 | 0.17 | 638 | 0 | 638 | 0.0% | |
| CT | 538 | 0.15 | 538 | 0 | 538 | 0.0% | |
| WY | 473 | 0.022 | 0 | 473 | -473 | 48.2% | |
| HI | 444 | 0.3 | 444 | 0 | 444 | 0.0% | |
| DE | 357 | 0.53 | 357 | 0 | 357 | 0.0% | |
| IN | 242 | 0.16 | 0 | 242 | -242 | 0.0% | |
| MA | 80 | 0.14 | 0 | 80 | -80 | 0.0% | |
| WV | 47 | 0.021 | 0 | 47 | -47 | 0.0% | |
| VT | 20 | 0.003 | 0 | 20 | -20 | 0.0% |
Figures are from October 7-20, 2024. Numbers include broadcast television for all sponsors.
+The Independent candidate (and supportive groups) aired ads not shown in Dem/Rep columns.
CITE SOURCE OF DATA AS: Vivvix CMAG with analysis by the Wesleyan Media Project.
Figure 4 shows that the tone of ads in the Senate races remains quite negative. The top panels show the volume of pro-Democratic and pro-Republican ads by tone by week, while the bottom panels do the same but with percentages. First, one sees that the volume of pro-Democratic ads has been higher than the volume of pro-Republican ads in each week since early September. Second, levels of negativity are high regardless of party, though pro-Democratic ads are more likely to be contrast ads than are pro-Republican ads. Finally, in the last week, negative ads as a share of airings remained flat for Democrats over the previous week but declined slightly for Republicans. Positive ads for both parties only account for about 1 in 5 ad airings.
Figure 4: Tone of Ad Airings in Senate Races by Week (September 2 to October 20)
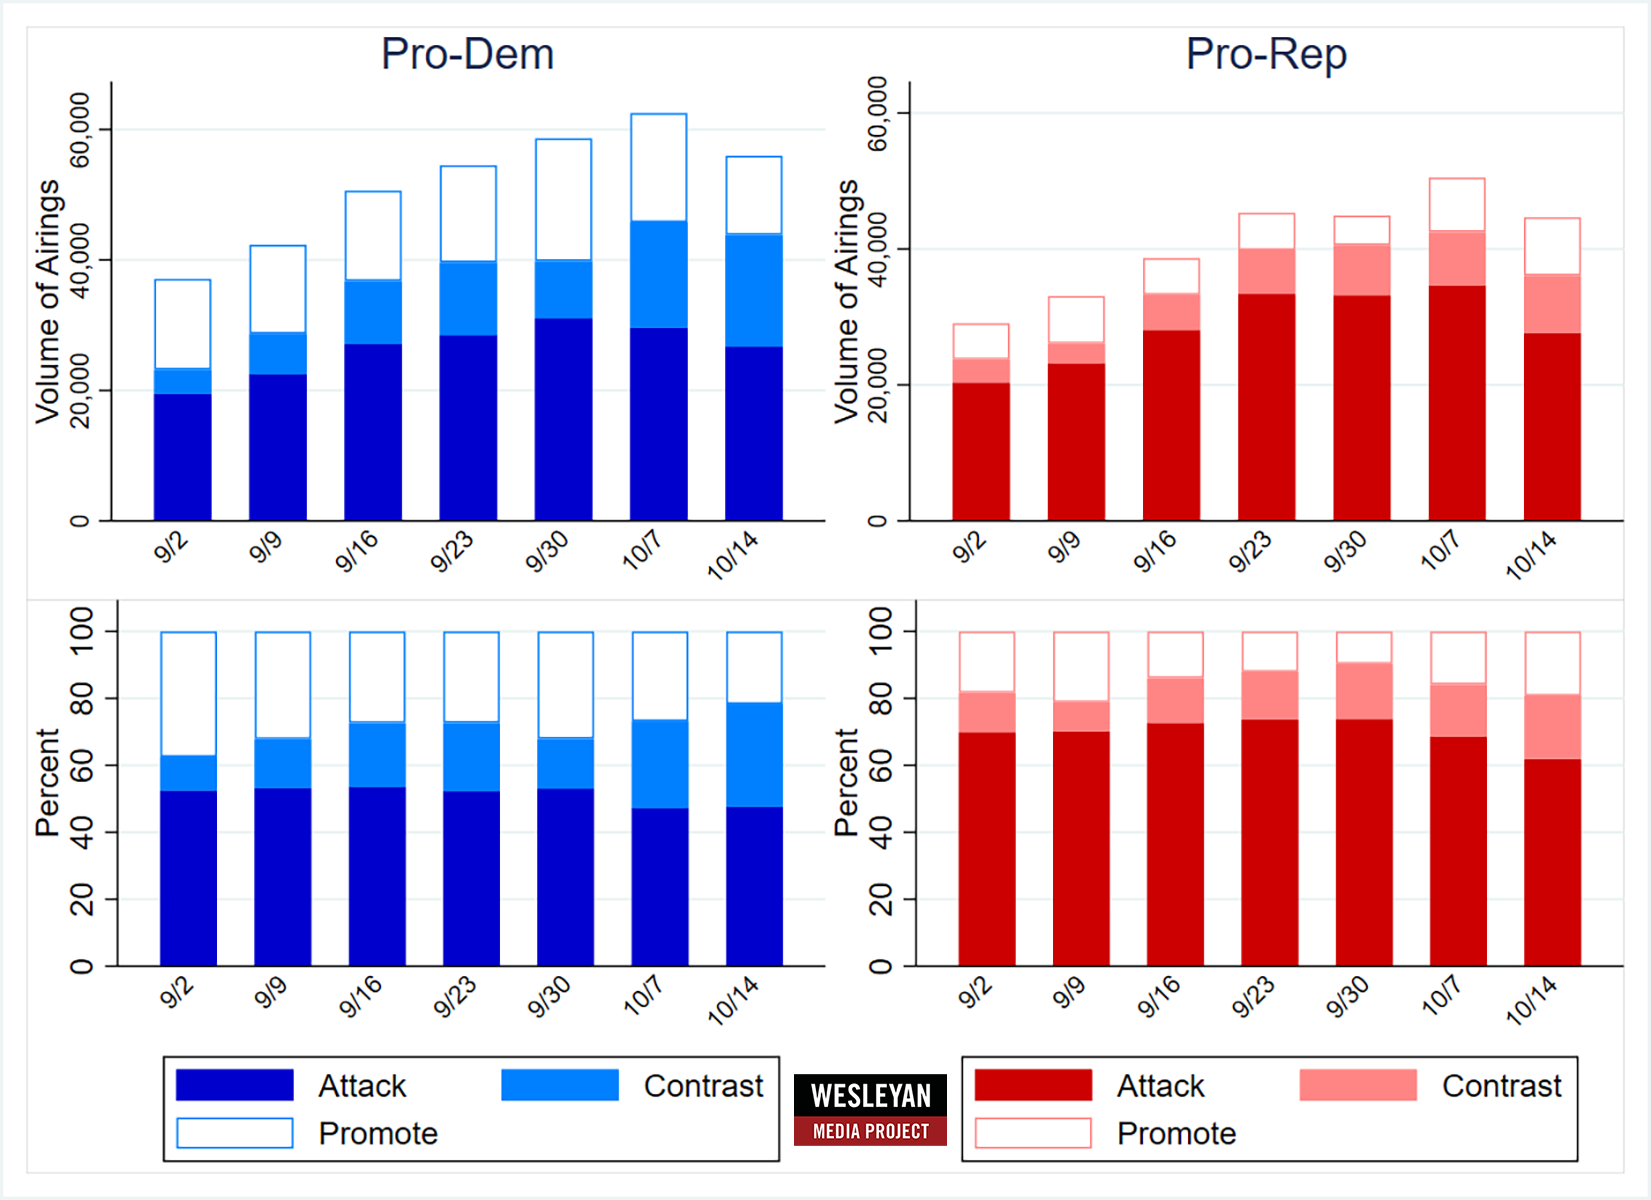
Numbers include broadcast television for all sponsors.
CITE SOURCE OF DATA AS: Vivvix CMAG with analysis by the Wesleyan Media Project.
Pro-Republican Senate Ads Focus on Immigration
Since September 1, top issues in Senate advertising on the Democratic side include health care, abortion and prescription drugs, while pro-Republican ads have focused on immigration, the budget, and taxes (Table 7). Immigration has appeared in nearly half of about 300,000 broadcast television spots on behalf of Republican Senate candidates.
Table 7: Top Issues by Party in Senate Races (September 1 to October 20)
| Pro-Dem | % of Airings | Pro-Rep | % of Airings | ||
|---|---|---|---|---|---|
| (368,027 airings) | Health Care | 36.9% | (292,043 airings) | Immigration | 46.6% |
| Abortion | 34.3% | Budget | 34.4% | ||
| Prescription Drugs | 22.5% | Taxes | 33.8% | ||
| Women's rights | 15.4% | Health Care | 29.3% | ||
| Immigration | 14.4% | Economy | 28.0% | ||
| Social Security | 13.3% | Public Safety | 27.1% | ||
| Economy | 11.9% | Inflation | 25.6% | ||
| Medicare | 11.7% | Gender identity | 22.4% | ||
| Jobs | 11.5% | Energy policy | 20.5% | ||
| Energy Policy | 11.5% | Social Security | 18.7% | ||
| Numbers include broadcast television for all sponsors. CITE SOURCE OF DATA AS: Vivvix CMAG with analysis by the Wesleyan Media Project. |
|||||
In Table 8, we break out the issue focus across the parties in the top-ten Senate races by ad volume since September 1. (We combine all ads across sponsors on behalf of each major candidate.) We also show the top 10 issues in each party in these races, which can be accessed by clicking on the link in the footer of the table. In five races (Arizona, Maryland, Nevada, Ohio, and Pennsylvania), the top issue for Democrats is abortion. In four other states, the top Democratic issue is health care. For Republicans, immigration tops the list in five states (Arizona, Montana, Nebraska, Ohio, and Pennsylvania). Notably, the top issue for Ted Cruz and allies in his Texas race is gender identity, a topic in 70 percent of his ad airings back to September 1.
Table 8: Top Issues By Party Lean in Specific Senate Races (September 1-October 20)
on Issue | Airings |
|||
|---|---|---|---|---|
| AZ | Pro-Dem | Abortion | 9,610 | 36.3% |
| AZ | Pro-Rep | Immigration | 6,924 | 74.5% |
| MD | Pro-Dem | Abortion | 10,339 | 64.6% |
| MD | Pro-Rep | Taxes | 7,925 | 77.8% |
| MI | Pro-Dem | Health Care | 14,183 | 52.2% |
| MI | Pro-Rep | Jobs | 11,600 | 61.3% |
| MT | Pro-Dem | Health Care | 35,856 | 52.7% |
| MT | Pro-Rep | Immigration | 37,597 | 61.6% |
| NE | Pro-Ind | Campaign finance | 8,369 | 58.4% |
| NE | Pro-Rep | Immigration | 9,132 | 69.8% |
| NV | Pro-Dem | Abortion | 7,974 | 46.5% |
| NV | Pro-Rep | Inflation | 7,270 | 66.0% |
| OH | Pro-Dem | Abortion | 22,753 | 35.9% |
| OH | Pro-Rep | Immigration | 31,783 | 50.7% |
| PA | Pro-Dem | Abortion | 9,873 | 38.0% |
| PA | Pro-Rep | Immigration | 17,230 | 52.5% |
| TX | Pro-Dem | Health care | 30,582 | 64.3% |
| TX | Pro-Rep | Gender identity | 14,976 | 70.4% |
| WI | Pro-Dem | Health care | 12,189 | 45.8% |
| WI | Pro-Rep | Budget | 13,612 | 56.0% |
| Numbers include broadcast television for all sponsors in each race. CITE SOURCE OF DATA AS: Vivvix CMAG with analysis by the Wesleyan Media Project. Download top 10 issues in these races here. |
||||
Three House Races Top 10K Ads in Last Two Weeks; Dems Out-Air GOP in Most Races
Races in California and New York may be key to control of the U.S. House after November. As shown in Table 9, three races in those states have seen over 10,000 ad airings over the past two weeks: California-22, New York-19 and California-13. Pro-Democratic ads outnumbered pro-Republican ads in the majority of the top races over the past two weeks. In general, Republican candidates have relied much more on ads from outside groups than have Democratic candidates. In California-22, for example, over 3 in every 5 ad airings on behalf of the Republican candidate were from outside groups.
Table 9: Volume of Ad Airings and Spending in Top House Races (October 7-20)
| State | District | Airings | Est. Cost (in $Ms) | Pro-Dem Airings | Pro-Rep Airings | Dem Airing Advantage | % D from Groups | % R from Groups |
|---|---|---|---|---|---|---|---|---|
| CA | 22 | 12,640 | 5.56 | 6,383 | 6,257 | 126 | 18.7% | 63.8% |
| NY | 19 | 11,548 | 6.09 | 5,631 | 5,917 | -286 | 46.8% | 34.1% |
| CA | 13 | 10,197 | 7.47 | 6,900 | 3,297 | 3,603 | 24.1% | 30.0% |
| NM | 2 | 8,815 | 3.88 | 6,270 | 2,545 | 3,725 | 21.3% | 61.7% |
| AK | 1 | 8,375 | 4.44 | 4,767 | 3,608 | 1,159 | 33.5% | 62.0% |
| ME | 2 | 8,066 | 5.44 | 4,420 | 3,646 | 774 | 20.7% | 35.5% |
| NC | 1 | 7,979 | 5.96 | 4,789 | 3,190 | 1,599 | 52.5% | 53.0% |
| NY | 22 | 7,931 | 2.7 | 4,347 | 3,584 | 763 | 14.5% | 39.0% |
| OR | 5 | 7,811 | 5.62 | 5,006 | 2,805 | 2,201 | 16.6% | 38.2% |
| CA | 41 | 7,498 | 6.69 | 3,493 | 4,005 | -512 | 19.5% | 57.7% |
| AZ | 6 | 6,242 | 6.04 | 3,560 | 2,682 | 878 | 31.7% | 52.2% |
| CO | 8 | 6,017 | 6.21 | 3,335 | 2,682 | 653 | 32.8% | 40.4% |
| IA | 1 | 5,974 | 4.13 | 3,567 | 2,407 | 1,160 | 25.7% | 45.2% |
| CO | 3 | 5,822 | 1.07 | 3,980 | 1,842 | 2,138 | 0.0% | 0.0% |
| MT | 1 | 5,063 | 2.65 | 2,218 | 2,845 | -627 | 37.8% | 0.0% |
| IA | 3 | 4,820 | 3.05 | 2,348 | 2,472 | -124 | 25.2% | 40.9% |
| WI | 3 | 4,712 | 4.49 | 3,104 | 1,608 | 1,496 | 57.8% | 24.1% |
| CA | 27 | 4,643 | 8.78 | 2,266 | 2,377 | -111 | 41.9% | 63.1% |
| NE | 2 | 4,612 | 4.01 | 2,287 | 2,325 | -38 | 34.1% | 52.2% |
| MI | 7 | 4,414 | 10.21 | 2,305 | 2,109 | 196 | 42.8% | 60.3% |
| CA | 45 | 4,375 | 8.55 | 1,388 | 2,987 | -1,599 | 90.6% | 83.9% |
| AZ | 1 | 4,132 | 6.98 | 2,014 | 2,118 | -104 | 22.1% | 48.8% |
| OH | 9 | 3,660 | 2.37 | 2,233 | 1,427 | 806 | 28.5% | 46.8% |
| MI | 8 | 3,526 | 3.6 | 1,961 | 1,565 | 396 | 40.7% | 56.0% |
| CT | 5 | 3,468 | 1.45 | 2,197 | 1,271 | 926 | 0.0% | 0.0% |
| VA | 2 | 3,417 | 2.13 | 1,649 | 1,768 | -119 | 48.4% | 41.5% |
| VA | 7 | 3,346 | 4.55 | 2,269 | 1,077 | 1,192 | 26.4% | 78.4% |
| PA | 8 | 3,045 | 4.32 | 1,881 | 1,164 | 717 | 12.9% | 45.9% |
| NY | 17 | 2,970 | 5.2 | 1,616 | 1,354 | 262 | 0.0% | 79.8% |
| WA | 3 | 2,923 | 3.73 | 2,105 | 818 | 1,287 | 4.3% | 0.0% |
| NY | 4 | 2,873 | 6.01 | 1,630 | 1,243 | 387 | 49.5% | 72.8% |
| PA | 10 | 2,776 | 3.25 | 1,743 | 1,033 | 710 | 32.6% | 70.3% |
| OH | 13 | 2,703 | 4.94 | 1,391 | 1,312 | 79 | 0.0% | 79.1% |
| PA | 7 | 2,626 | 6.39 | 1,420 | 1,206 | 214 | 51.0% | 85.6% |
| IL | 17 | 2,390 | 0.69 | 1,403 | 987 | 416 | 8.0% | 0.0% |
| CA | 49 | 2,190 | 0.93 | 525 | 1,665 | -1,140 | 100.0% | 0.0% |
| CA | 47 | 1,894 | 5.02 | 1,362 | 532 | 830 | 90.5% | 0.6% |
| OR | 6 | 1,873 | 0.75 | 1,807 | 66 | 1,741 | 0.0% | 0.0% |
| NJ | 7 | 1,854 | 2.73 | 417 | 1,437 | -1,020 | 0.0% | 63.7% |
| OR | 4 | 1,823 | 0.27 | 1,676 | 147 | 1,529 | 21.5% | 0.0% |
| AL | 2 | 1,805 | 0.38 | 1,161 | 644 | 517 | 0.0% | 0.0% |
| TX | 34 | 1,691 | 1.73 | 928 | 763 | 165 | 69.2% | 23.9% |
| KS | 3 | 1,641 | 0.66 | 1,563 | 78 | 1,485 | 0.0% | 0.0% |
| CA | 9 | 1,528 | 0.89 | 749 | 779 | -30 | 0.0% | 0.0% |
| NY | 18 | 1,524 | 2.43 | 1,315 | 209 | 1,106 | 5.1% | 0.0% |
| MN | 2 | 1,509 | 1.13 | 1,185 | 324 | 861 | 5.9% | 0.0% |
| CA | 3 | 1,405 | 0.65 | 556 | 849 | -293 | 0.0% | 0.0% |
| TX | 15 | 1,346 | 0.8 | 522 | 824 | -302 | 88.9% | 0.0% |
| NV | 2 | 1,188 | 0.34 | 0 | 181 | -181 | 0.0% | |
| MI | 10 | 1,174 | 3.31 | 643 | 531 | 112 | 86.0% | 63.5% |
Figures are from October 7-20, 2024. Numbers include broadcast television for all sponsors.
CITE SOURCE OF DATA AS: Vivvix CMAG with analysis by the Wesleyan Media Project.
House Ads Become More Negative
Ads in House races have become more negative as Election Day approaches. The top panels in Figure 5 show the number of ads by tone in each week of the campaign broken down by party, while the bottom panels speak to the percentage of ads falling into each tone category. Regardless of party, attack ads have become more prominent week over week, and positive ads have fallen. Also visible in the figure is that the volume of pro-Democratic ads has been greater than the volume of pro-Republican ads in each week of the fall campaign.
Figure 5: Tone of Ad Airings in House Races by Week (September 2 to October 20)
Numbers include broadcast television for all sponsors.
CITE SOURCE OF DATA AS: Vivvix CMAG with analysis by the Wesleyan Media Project.
Abortion Top Democratic Issue in House; Public Safety Top GOP Issue
Pro-Democratic and pro-Republican ads are largely emphasizing different issues in the U.S. House (Table 10). On the Democratic side, abortion, health care and public safety top the issue agenda, while on the Republican side, the top issues are public safety, immigration and the budget.
Table 10: Top Issues by Party in House Races (September 1 to October 20)
Airings | Airings |
||||
|---|---|---|---|---|---|
| (350,941 airings) | Abortion | 39.6% | (220,105 airings) | Public Safety | 37.7% |
| Health care | 32.9% | Immigration | 33.6% | ||
| Public Safety | 29.8% | Budget | 25.8% | ||
| Prescription drugs | 27.5% | Economy | 24.9% | ||
| Budget | 14.6% | Inflation | 23.4% | ||
| Immigration | 14.3% | Taxes | 22.8% | ||
| Women's rights | 12.4% | Energy policy | 21.3% | ||
| Taxes | 11.5% | Drug problems | 16.8% | ||
| Social security | 11.4% | Oil/gas prices | 15.3% | ||
| Jobs | 11.2% | Food | 14.8% | ||
| Numbers include broadcast television for all sponsors. CITE SOURCE OF DATA AS: Vivvix CMAG with analysis by the Wesleyan Media Project. |
|||||
Table 11 shows the top issues being mentioned in some of the House races that have seen the most advertising–specifically, the six House races with the most ad airings since September 1. Each has featured over 20,000 ad airings in that time period. The issue agenda is quite different depending on the race, with top Democratic issues including jobs, health care, prescription drugs, public safety and abortion. Top Republican issues also vary and include inflation, oil/gas prices, energy policy, the economy and public safety.
Table 11: Top Issues By Party Lean in House Races with the Most Airings in Fall (September 1-October 20)
on Issue | Airings |
||||
|---|---|---|---|---|---|
| AK | 1 | Pro-Dem | Jobs | 11,120 | 76.9% |
| AK | 1 | Pro-Rep | Inflation | 5,778 | 67.2% |
| CA | 13 | Pro-Dem | Health Care | 12,610 | 74.7% |
| CA | 13 | Pro-Rep | Oil/gas prices | 5,787 | 74.7% |
| CA | 22 | Pro-Dem | Prescription drugs | 5,813 | 42.2% |
| CA | 22 | Pro-Rep | Energy policy | 10,517 | 71.4% |
| ME | 2 | Pro-Dem | Health Care | 5,668 | 44.3% |
| ME | 2 | Pro-Rep | Economy | 4,854 | 56.5% |
| NM | 2 | Pro-Dem | Public safety | 10,090 | 59.0% |
| NM | 2 | Pro-Rep | Public safety | 4,970 | 78.8% |
| NY | 19 | Pro-Dem | Abortion | 5,297 | 37.5% |
| NY | 19 | Pro-Rep | Immigration | 9,368 | 67.6% |
| Numbers include broadcast television for all sponsors in each race. CITE SOURCE OF DATA AS: Vivvix CMAG with analysis by the Wesleyan Media Project. Download top 10 issues in these races here. |
|||||
NH and IN Top List of Gov Ads
Most races for governor have been relatively quiet over the past two weeks. Republican Kelly Ayotte has an ad advantage over Democrat Joyce Craig in New Hampshire. In Indiana, by contrast, Democrat Jennifer McCormick has an ad advantage over Republican Mike Braun, despite the race being rated as “likely Republican” by Cook Political Report. Only pro-Democratic ads have aired in North Carolina over the past two weeks.
All told, outside groups are largely on the sidelines in most gubernatorial contests, with the exception being outside group support for the Democratic candidate in Washington state.
Table 12: Volume of Ad Airings and Spending in Gubernatorial Races (October 7-20)
| State | Airings | Est. Cost (in $Ms) | Pro-Dem Airings | Pro-Rep Airings | Dem Airing Advantage | % D from Groups | % R from Groups |
|---|---|---|---|---|---|---|---|
| NH | 11,743 | 7.01 | 4,749 | 6,994 | -2,245 | 0.0% | 0.0% |
| IN | 10,102 | 1.54 | 7,008 | 3,094 | 3,914 | 0.0% | 0.0% |
| NC | 7,462 | 4.57 | 7,462 | 0 | 7,462 | 0.0% | |
| WA | 4,140 | 2.45 | 3,605 | 535 | 3,070 | 49.2% | 0.4% |
| WV | 1,147 | 0.14 | 0 | 1,147 | -1,147 | 0.0% | |
| MT | 1,067 | 0.2 | 0 | 1,067 | -1,067 | 0.0% | |
| MO | 436 | 0.2 | 436 | 0 | 436 | 0.0% | |
| VT | 197 | 0.04 | 0 | 197 | -197 | 0.0% | |
| Figures are from October 7-20, 2024. Numbers include broadcast television for all sponsors in each race. CITE SOURCE OF DATA AS: Vivvix CMAG with analysis by the Wesleyan Media Project. |
|||||||
Discussion of Abortion, Immigration at Historically High Levels
Zooming out to look at the full 2023-2024 election cycle in federal races compared to the prior six cycles for U.S. Congress and prior three presidential cycles, the data show a bifurcation between pro-Democratic sponsors focusing more on abortion and pro-Republican sponsors who are focusing more on immigration.
“Election cycles vary in the extent to which they feature a common top issue – sometimes topics like the economy or health care dominate the issue space with both parties devoting high levels of attention to a common issue. This year, we have the two topics receiving historically high attention: abortion for Democrats and immigration for Republicans,” said Erika Franklin Fowler, co-director of the Wesleyan Media Project. “The difference likely reflects what each side believes to be their best talking point.”
Table 13 shows the percentage of ads in House races by year and party lean that mention three issues: abortion, health care and immigration. Pro-Democratic abortion mentions ads in the current cycle are outpacing pro-Democratic or pro-Republican ads in any cycle since 2012, while pro-Republican ads are putting historically high attention on immigration. Health care, while mentioned in almost a third of pro-Democratic ads this cycle, is not being mentioned as much as in the previous three cycles.
Table 13: Percentage of House Ads Discussing Each Issue by Year (Full Cycle)
| Year | Pro-Dem | Pro-Rep | Pro-Dem | Pro-Rep | Pro-Dem | Pro-Rep |
| 2012 | 5.6% | 2.4% | 7.5% | 26.9% | 0.5% | 0.4% |
| 2014 | 5.2% | 5.2% | 8.1% | 5.6% | 1.7% | 5.0% |
| 2016 | 11.0% | 9.3% | 13.0% | 6.5% | 4.5% | 13.3% |
| 2018 | 1.7% | 4.9% | 51.4% | 27.3% | 5.1% | 17.3% |
| 2020 | 1.6% | 6.5% | 50.6% | 22.8% | 2.7% | 14.7% |
| 2022 | 31.9% | 7.2% | 33.5% | 6.0% | 2.9% | 19.1% |
| 2024 | 39.9% | 4.7% | 31.9% | 8.8% | 14.2% | 49.2% |
| Numbers include broadcast television for all pro-Dem or pro-Rep sponsors in each race for the full two-year cycle beginning on January 1 of the off-year and ending on October 20 of the election year. CITE SOURCE OF DATA AS: Vivvix CMAG with analysis by the Wesleyan Media Project. |
||||||
Table 14 shows the same data for Senate races, and the story is similar: discussion of abortion is at a historically high level in pro-Democratic ads, while discussion of immigration is at historically high levels in pro-Republican ads.
Table 14: Percentage of Senate Ads Discussing Each Issue by Year (Full Cycle)
| Year | Pro-Dem | Pro-Rep | Pro-Dem | Pro-Rep | Pro-Dem | Pro-Rep |
| 2012 | 1.8% | 1.8% | 7.6% | 29.8% | 0.6% | 2.8% |
| 2014 | 7.2% | 2.3% | 6.2% | 5.1% | 2.1% | 8.1% |
| 2016 | 6.2% | 3.0% | 5.9% | 8.4% | 2.8% | 11.7% |
| 2018 | 0.5% | 5.9% | 36.8% | 14.3% | 4.4% | 20.8% |
| 2020 | 0.8% | 8.5% | 51.5% | 33.7% | 1.7% | 7.8% |
| 2022 | 19.1% | 9.4% | 20.4% | 4.7% | 3.0% | 28.5% |
| 2024 | 22.2% | 3.7% | 30.1% | 20.4% | 14.9% | 46.2% |
| Numbers include broadcast television for all pro-Dem or pro-Rep sponsors in each race for the full two-year cycle beginning on January 1 of the off-year and ending on October 20 of the election year. CITE SOURCE OF DATA AS: Vivvix CMAG with analysis by the Wesleyan Media Project. |
||||||
This Democratic focus on abortion and Republican focus on immigration is evident in the presidential race as well (Table 15), with 22 percent of pro-Democratic ads mentioning abortion and 36 percent of pro-Republican ads mentioning immigration.
Table 15: Percentage of Presidential Ads Discussing Each Issue by Year (Full Cycle)
| Year | Pro-Dem | Pro-Rep | Pro-Dem | Pro-Rep | Pro-Dem | Pro-Rep |
| 2012 | 6.3% | 2.4% | 12.4% | 15.5% | 0.8% | 1.7% |
| 2016 | 1.3% | 2.9% | 17.5% | 3.4% | 3.7% | 21.0% |
| 2020 | 2.5% | 0.0% | 50.8% | 24.5% | 3.2% | 18.2% |
| 2024 | 21.7% | 0.4% | 31.8% | 6.7% | 9.0% | 35.7% |
| Numbers include broadcast television, national network, and national cable airings for all sponsors in the presidential race for the full two-year cycle beginning on January 1 of the prior off-year and ending on October 20 of the election year. CITE SOURCE OF DATA AS: Vivvix CMAG with analysis by the Wesleyan Media Project. |
||||||
About the Data
All television, satellite (which includes connected TV from LG Ad Sales), and radio data reported here are from Vivvix CMAG. Unless otherwise specified to include national network and national cable, most advertising references refer to broadcast television. All cost estimates for television are precisely that: estimates.
Meta spending data come from the aggregate reports, which provide spending information for each page name and disclaimer combination. Totals in this report reflect spending between January 1, 2023, or October 6, 2024, and October 19, 2024. These totals are calculated by subtracting the reported cumulative spending (as reported by Facebook as the total spent since May 2018) for the October 19, 2024 report and subtracting the cumulative spending reported for December 31, 2022, or October 5, 2024.
Spending by Biden/Harris includes: spending on the Joe Biden page from Biden Victory Fund, DNC and Biden for President, Biden for President; spending on the Kamala HQ page from Biden Victory Fund and Harris Victory Fund; spending on the Kamala Harris page from Biden Victory Fund, DNC Services Corp., Harris for President and Harris Victory Fund; spending on the Tim Walz, Gwen Walz, Aurora Jamesand Douglas Emhoff pages by Harris Victory Fund; Biden for President spending on the Complex, Headlines 2024, The Voices of Today and The Daily Scroll pages, Biden Victory Fund spending on the Democratic Party page, and Harris for President spending on the Essence, Glamour, Headlines 2024, The Voices of Today and Memericans pages. Spending by Trump includes: spending on the Donald J. Trump page by the Trump National Committee JFC, Donald J. Trump for President 2024, Inc., Trump 47 Committee, Inc., and Trump Save America Joint Fundraising Committee; Trump Save America Joint Fundraising Committee and Save American Joint Fundraising Committee spending on the Team Trump page; Donald J. Trump for President 2024, Inc, Trump National Committee JFC and Trump 47 Committee, Inc. spending on the JD Vance page; Trump National Committee JFC spending on the Alina Habba, Karoline Leavitt, and Ronny Jackson pages, and Trump National Committee JFC and Donald J. Trump for President 2024 spending on Lara Trump’s page. Spending by supporting groups for Biden/Harris and Trump are listed in the table notes when they are used.
For Google ads, we downloaded the weekly reports from the platform’s Transparency Report. The totals reflected in this release are current as of October 22, 2024, the day on which we pulled the transparency report. Google only includes spending in federal and state races and only includes weekly totals but lists the sponsor’s EIN or FEC committee ID. Google spending is from the following time periods: January 1, 2023, or October 6, 2024 and October 19, 2024.
Spending by Biden/Harris includes the Biden for President, Harris for President, DNC Services Corp when it appears with Biden or Harris for President, Biden Victory Fund, and Harris Victory Fund advertisers. Spending by Trump includes advertisers Donald J. Trump for President 2024, Inc., Trump Save America Joint Fundraising Committee, and Trump National Committee JFC. Spending by supporting groups for Biden/Harris and Trump are listed in the table notes when they are used.
About this Report
The Wesleyan Media Project provides real-time tracking and analysis of all political television advertising in an effort to increase transparency in elections. Housed in Wesleyan’s Quantitative Analysis Center – part of the Allbritton Center for the Study of Public Life – the Wesleyan Media Project is the successor to the Wisconsin Advertising Project, which disbanded in 2009. It is directed by Erika Franklin Fowler, professor of government at Wesleyan University, Michael M. Franz, professor of government at Bowdoin College and Travis N. Ridout, professor of political science at Washington State University. WMP personnel include Breeze Floyd (Program Manager), Pavel Oleinikov (Associate Director, QAC), Yujin Kim (Post-Doctoral Fellow) and Meiqing Zhang (Post-Doctoral Fellow).
The Wesleyan Media Project’s real-time tracking in 2024 is supported by Wesleyan University and the John S. and James L. Knight Foundation. The Wesleyan Media Project is partnering again this year with OpenSecrets, to provide added information on outside group disclosure and candidate status.
The Wesleyan Media Project’s digital advertising tracking is supported by the contributions of students in Delta Lab, an interdisciplinary research collaborative focusing on computationally-driven and innovative analyses and visualizations of media messaging. We are also grateful to our Coding Supervisors Akhil Joondeph, Cecilia Smith, Saul Ferholt-Kahn, and Emmett Perry and the numerous student research assistants who facilitate additional content analysis of television and digital advertising.
Periodic releases of data will be posted on the project’s website and dispersed via LinkedIn, Bluesky @wesmediaproject.bsky.social and Twitter @wesmediaproject. To be added to our email update list, click here.
For more information contact: media@wesleyan.edu.
About Wesleyan University
Wesleyan University, in Middletown, Conn., is known for the excellence of its academic and co-curricular programs. With more than 2,900 undergraduates and 200 graduate students, Wesleyan is dedicated to providing a liberal arts education characterized by boldness, rigor and practical idealism. For more, visit www.wesleyan.edu.
About the John S. and James L. Knight Foundation
We are social investors who support democracy by funding free expression and journalism, arts and culture in community, research in areas of media and democracy, and in the success of American cities and towns where the Knight brothers once had newspapers. Learn more at kf.org and follow @knightfdn on social media.


