Photo Gage Skidmore/flickr
But Harris Still Has Large Ad Advantages, especially on Digital
(MIDDLETOWN, CT) October 10, 2024 – According to a new report from the Wesleyan Media Project, about 71,000 pro-Harris ads have run on broadcast television over the past two weeks, substantially more than the 51,000 pro-Trump ads that have run during the same time period. But pro-Trump advertisers have been narrowing that gap in recent days.
The Harris campaign has sponsored over 53,000 ad airings since September 23 (Table 1), and has been supported by another 17,000 ads from outside groups, including FF PAC, Project Freedom LLC, and Republican Accountability PAC. The Trump campaign has aired 39,000 ads in the past two weeks and has been aided by MAGA Inc., Preserve America PAC and Right for America.
Table 1: Broadcast Ad Spending in Presidential Race (September 23 to October 6)
| Party Lean | Ad Airings | Est Cost (in $Ms) |
|
|---|---|---|---|
| Harris, Kamala | DEM | 53,602 | 41.47 |
| FF PAC | DEM | 13,309 | 28.49 |
| FF PAC (W/LCV Victory Fund, EDF Action, & Climate Power Action) | DEM | 589 | 1.44 |
| FF PAC (W/Somos PAC) | DEM | 952 | 1.59 |
| Project Freedom LLC | DEM | 947 | 3.24 |
| Republican Accountability PAC | DEM | 1,065 | 2.96 |
| Trump, Donald | REP | 39,170 | 25.16 |
| Make America Great Again Inc. | REP | 5,687 | 11.69 |
| Preserve America PAC | REP | 3,820 | 8.24 |
| Right For America | REP | 1,156 | 5.42 |
| All pro Harris | 70,793 | 83.54 | |
| All pro Trump | 51,321 | 57.1 | |
| Figures are from September 23 to October 6, 2024. Numbers include broadcast television for all sponsors. CITE SOURCE OF DATA AS: Vivvix CMAG with analysis by the Wesleyan Media Project. |
|||
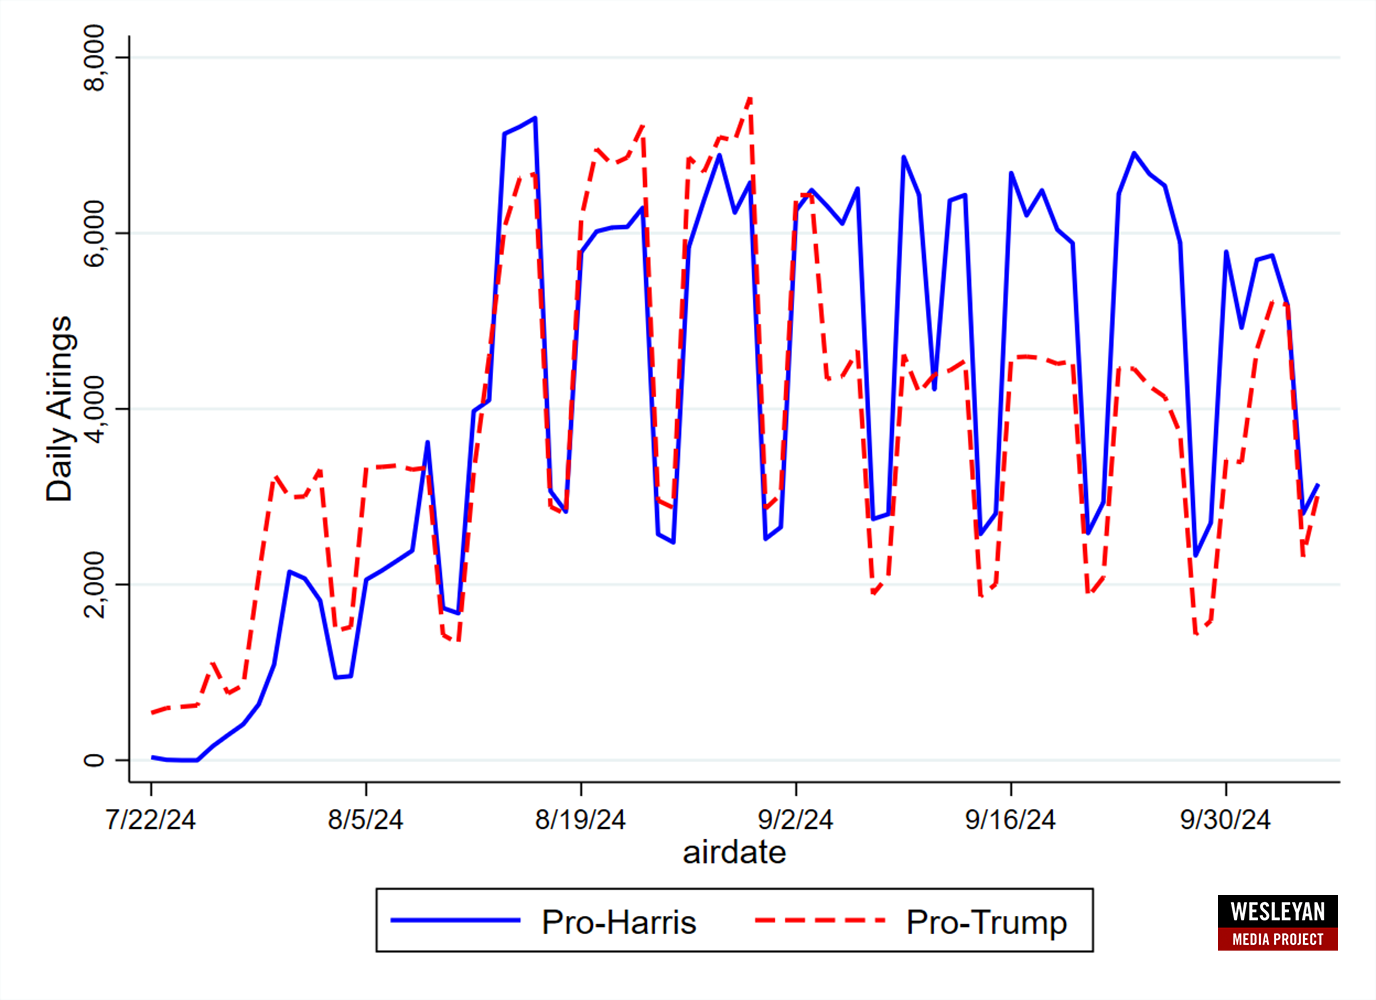
Figure 1 shows the daily volume of pro-Harris and pro-Trump ads over time. Pro-Harris ads dropped to below 6,000 ads per weekday in the past week—a decline from previous weeks—while pro-Trump ads increased at the end of the past week, considerably narrowing the gap with pro-Harris ads.
“The big question is whether this is the start of a more sustained investment from Trump and his group allies,” said Michael Franz, co-director of the Wesleyan Media Project. “Harris has vastly out-spent Trump on the air since the start of September.”
Figure 1: Volume of Pro-Harris and Pro-Trump Ad Airings by Day
Numbers include broadcast television for all sponsors.
CITE SOURCE OF DATA AS: Vivvix CMAG with analysis by the Wesleyan Media Project.
Harris Leads Trump in Cable and Radio Ad Spending
The advantage for Harris extends beyond just broadcast television spots. Table 2 shows that the Harris campaign leads the Trump campaign in spending across media. For example, in the last two weeks Harris has spent $8.7 million on local cable compared to $4.29 million from Trump. Harris has spent $4.37 million on national cable compared to just $800,000 for Trump. Trump, however, has spent more on satellite TV over the past two weeks: $1.84 million to $147,000.
All told, pro-Harris sponsors have spent over $109 million in television and radio ads in the last two weeks compared to about $71 million for pro-Trump sponsors.
Table 2: Broadcast Ad Spending in Presidential Race (September 23 to October 6)
| Party lean | Total TV/Radio spending (in $Ms) | Local cable (in $Ms) | Nat’l cable (in $Ms) | Radio (in $Ms) | Satellite TV (in $Ms) |
|
|---|---|---|---|---|---|---|
| Harris, Kamala | DEM | 55.32 | 8.72 | 4.37 | 4.98 | 0.147 |
| FF PAC | DEM | 36.42 | 3.76 | 4.66 | 3.91 | 0.255 |
| AB PAC | DEM | 5.34 | 0.622 | 0.735 | ||
| Project Freedom LLC | DEM | 3.96 | 0.716 | 0.458 | ||
| Republican Accountability PAC | DEM | 3.77 | 0.715 | 0.095 | ||
| Somos PAC & FF PAC | DEM | 1.95 | 0.038 | 0.32 | ||
| FF PAC & Climate Power Action & LCV Victory Fund | DEM | 1.44 | ||||
| Nebraska IBEW State Electrical Council | DEM | 0.237 | 0.03 | |||
| America's Future Majority Fund | DEM | 0.168 | 0.168 | |||
| Anti-Psychopath PAC Inc. | DEM | 0.163 | 0.063 | 0.1 | ||
| Fair Future NC | DEM | 0.066 | 0.066 | |||
| Defending Democracy Together | DEM | 0.064 | 0.01 | |||
| Unite The Country | DEM | 0.063 | 0.063 | |||
| American Federation Of Teachers Solidarity Fund | DEM | 0.06 | 0.06 | |||
| Black PAC | DEM | 0.015 | 0.015 | |||
| Local Voices | DEM | 0.013 | 0.013 | |||
| People For The American Way | DEM | 0.011 | 0.011 | |||
| All pro-Harris Advertising | 109.06 | 14.69 | 9.59 | 10.36 | 0.47 | |
| Trump, Donald | REP | 32.12 | 4.29 | 0.804 | 1.84 | |
| Make America Great Again Inc. | REP | 12.51 | 0.752 | 0.064 | ||
| Preserve America PAC | REP | 9.36 | 0.917 | 0.206 | ||
| Right For America | REP | 8.29 | 1.34 | 0.15 | 1.527 | |
| Restoration PAC | REP | 4.53 | 0.303 | 0.033 | ||
| Dan Newlin Injury Attorneys | REP | 1.51 | 0.152 | |||
| RJC Victory Fund | REP | 0.992 | 0.299 | |||
| Conservatives For Effective Government | REP | 0.341 | 0.341 | |||
| Americas PAC | REP | 0.279 | 0.279 | |||
| Article III Foundation | REP | 0.259 | 0.217 | 0.042 | ||
| Women Speak Out PAC | REP | 0.226 | 0.15 | 0.036 | ||
| Students For Life Action | REP | 0.225 | 0.225 | |||
| Turning Point PAC | REP | 0.067 | 0.067 | |||
| Stop The Madness AZ | REP | 0.047 | ||||
| Americans For Constitutional Liberty | REP | 0.029 | 0.029 | |||
| Protecting America Initiative | REP | 0.005 | 0.005 | |||
| We Must Unite | REP | 0.001 | 0.001 | |||
| All pro-Trump Advertising | 70.79 | 8.77 | 1.2 | 1.98 | 2.11 | |
| Figures are from September 23 to October 6, 2024. Total column includes spending for local broadcast TV airings and national network airings in addition to cable, radio, and satellite. CITE SOURCE OF DATA AS: Vivvix CMAG with analysis by the Wesleyan Media Project. |
||||||
Phoenix, Atlanta Top Markets in Presidential Race
Top markets in terms of ad airings in the presidential race over the past two weeks are Phoenix, Atlanta and Philadelphia—each with over $10 million in broadcast ads. In each of these markets, pro-Harris ads outnumber pro-Trump ads. The biggest advantage for Harris is in the Las Vegas media market, where Harris has out-aired Trump by nearly 2,400 spots in the last two weeks. Within the top 10 markets by ad volume, Trump holds an ad lead in only one: Grand Rapids, Michigan.
Table 3: Broadcast Ad Spending in Presidential Race by Market (September 23 to October 6)
| Market | Total ad airings | Pro-Harris airings | Pro-Trump airings | Dem Ad Advantage | Est. Cost (in $Ms) | Pro-Harris (in $Ms) | Pro-Trump (in $Ms) |
|---|---|---|---|---|---|---|---|
| Phoenix | 7,672 | 4,527 | 3,145 | 1,382 | 10.17 | 5.54 | 4.63 |
| Atlanta | 7,544 | 4,037 | 3,507 | 530 | 10.79 | 4.75 | 6.04 |
| Philadelphia | 5,755 | 3,590 | 2,165 | 1,425 | 11.74 | 5.54 | 6.2 |
| Las Vegas | 5,207 | 3,783 | 1,424 | 2,359 | 4.56 | 3.52 | 1.04 |
| Raleigh | 5,061 | 3,390 | 1,671 | 1,719 | 3.95 | 2.74 | 1.21 |
| Charlotte | 4,999 | 2,997 | 2,002 | 995 | 4.26 | 2.72 | 1.54 |
| Tucson | 4,675 | 2,864 | 1,811 | 1,053 | 1.93 | 1.4 | 0.53 |
| Grand Rapids | 4,661 | 2,309 | 2,352 | -43 | 4.23 | 2 | 2.23 |
| Pittsburgh | 4,318 | 2,355 | 1,963 | 392 | 9.03 | 4.32 | 4.71 |
| Green Bay | 4,251 | 2,728 | 1,523 | 1,205 | 4.21 | 1.98 | 2.24 |
| Harrisburg | 4,069 | 2,179 | 1,890 | 289 | 5.12 | 2.8 | 2.32 |
| Milwaukee | 3,999 | 2,354 | 1,627 | 727 | 5.46 | 2.36 | 3.09 |
| Detroit | 3,812 | 2,337 | 1,475 | 862 | 9.79 | 4.5 | 5.28 |
| Greensboro | 3,490 | 1,852 | 1,638 | 214 | 1.71 | 1.33 | 0.38 |
| Johnstown | 3,342 | 1,552 | 1,790 | -238 | 1.99 | 0.86 | 1.13 |
| Wilkes Barre | 3,104 | 1,543 | 1,561 | -18 | 3.04 | 1.48 | 1.55 |
| Madison | 3,034 | 1,577 | 1,437 | 140 | 1.64 | 0.72 | 0.92 |
| Flint | 2,900 | 1,549 | 1,351 | 198 | 1.74 | 0.91 | 0.83 |
| Columbus, GA | 2,776 | 1,671 | 1,105 | 566 | 0.865 | 0.648 | 0.218 |
| Reno | 2,749 | 1,403 | 1,346 | 57 | 1.5 | 1.2 | 0.3 |
| Macon | 2,676 | 1,336 | 1,340 | -4 | 0.619 | 0.428 | 0.191 |
| Wilmington | 2,492 | 1,288 | 1,204 | 84 | 0.551 | 0.367 | 0.184 |
| Greenville, NC | 2,420 | 1,127 | 1,293 | -166 | 0.829 | 0.461 | 0.368 |
| Savannah | 2,163 | 1,202 | 961 | 241 | 1.14 | 0.75 | 0.38 |
| Augusta | 2,032 | 986 | 1,046 | -60 | 0.7 | 0.379 | 0.321 |
| Albany, GA | 1,997 | 1,029 | 968 | 61 | 0.479 | 0.311 | 0.168 |
| La Crosse | 1,965 | 914 | 1,045 | -131 | 0.946 | 0.554 | 0.392 |
| Lansing | 1,854 | 933 | 921 | 12 | 1.19 | 0.88 | 0.3 |
| Wausau | 1,760 | 875 | 879 | -4 | 1.29 | 0.61 | 0.68 |
| National Cable | 1,640 | 1,464 | 176 | 1,288 | 10.8 | 9.58 | 1.21 |
| Traverse City | 1,637 | 739 | 898 | -159 | 0.347 | 0.186 | 0.161 |
| Marquette | 1,367 | 676 | 691 | -15 | 0.285 | 0.138 | 0.146 |
| Erie | 1,351 | 719 | 632 | 87 | 0.74 | 0.459 | 0.281 |
| Tallahassee | 1,108 | 288 | 820 | -532 | 0.197 | 0.079 | 0.118 |
| Greenville, SC | 1,100 | 263 | 837 | -574 | 0.656 | 0.235 | 0.421 |
| Omaha | 788 | 785 | 3 | 782 | 0.477 | 0.477 | 0 |
| National Network | 665 | 635 | 30 | 605 | 20.22 | 15 | 5.18 |
| Alpena | 483 | 243 | 240 | 3 | 0.308 | 0.161 | 0.146 |
| Myrtle Beach | 318 | 316 | 2 | 314 | 0.061 | 0.061 | 0 |
| Youngstown | 289 | 287 | 2 | 285 | 0.117 | 0.117 | 0 |
| South Bend | 278 | 276 | 2 | 274 | 0.061 | 0.061 | 0 |
| Houston | 219 | 214 | 5 | 209 | 0.351 | 0.351 | 0 |
| Toledo | 193 | 191 | 2 | 189 | 0.108 | 0.108 | 0 |
| Duluth | 191 | 188 | 3 | 185 | 0.062 | 0.062 | 0 |
| Minneapolis | 149 | 146 | 3 | 143 | 0.244 | 0.244 | 0 |
| Yuma-El Centro | 114 | 111 | 3 | 108 | 0.059 | 0.059 | 0 |
Figures are from September 23 to October 6, 2024.
Numbers include broadcast television for all sponsors.
CITE SOURCE OF DATA AS: Vivvix CMAG with analysis by the Wesleyan Media Project.
Figure 2 shows the difference in the volume of advertising in the presidential race. Use the dropdown menu to display these data for the July 22 to October 6 period or the September 23 to October 6 period. Darker blue indicates a greater pro-Democratic advantage, while darker red indicates a greater pro-Republican advantage. For the longer time period, there are several markets with a Democratic ad advantage and several with a Republican advantage. But for the most recent two weeks, most markets are colored blue, indicating a Democratic ad advantage in most locations.
Figure 2: Presidential Advertising Advantages by Media Market and Party
Figures are from July 22 to October 6, 2024 and September 23 to October 6, 2024.
Numbers include broadcast television for all presidential sponsors.
CITE SOURCE OF DATA AS: Vivvix CMAG with analysis by the Wesleyan Media Project.
Gap Has Narrowed but Trump Still Trailing in Digital Spending
In the two weeks ending October 6, digital spending continued to be heavy, with both campaigns increasing their spending overall. Although the Harris campaign still leads on both Meta and Google properties, the gap between the two campaigns has narrowed substantially, particularly on Meta where Harris leads by a factor of more than 6:1 (compared to 16:1 in the prior period). This narrowing was driven primarily by lower spending on Meta by Harris. Both campaigns nearly doubled the amount of money they spent on Google compared to the prior two week period.
Table 4: Digital Spending by the Candidates on Meta and Google (September 23 to October 6)
(in $Ms) | (in $Ms) | (in $Ms) |
|
|---|---|---|---|
| Harris | 13.6 | 35.3 | 48.9 |
| Trump | 2.1 | 13.4 | 15.5 |
| Figures are from September 23 (for Meta, which includes Facebook and Instagram) and September 21 (for Google, which includes search advertising, YouTube, and third-party advertising) to October 5, 2024. Numbers for campaigns include joint fundraising committee advertising. National party spending is excluded if it occurs only on the national party pages and/or does not contain any reference to a presidential sponsor in the disclaimer. CITE SOURCE OF DATA AS: Meta Ad Library and Google Transparency Report with analysis by the Wesleyan Media Project. |
|||
“The gap between Google and Meta for each candidate is notable,” said Erika Franklin Fowler, co-director of the Wesleyan Media Project. “In the last two weeks, Harris has spent over three times as much on Google compared to Meta. For Trump, the difference is much greater, nearly seven times as much on Google.”
Presidential Race Still Focused on Economy, but Harris Increases Focus on Health Care and Trump Targets Harris on Transgender Rights
The presidential campaign on the air continues to be focused on economic issues with Trump talking mostly about taxes and jobs while Harris continues to talk about the economy, housing and inflation in roughly one of every five ads. Harris’ top issue over the past two weeks, however, was health care, with nearly 1 in 3 ads mentioning it. Abortion is still a topic of discussion but has featured less prominently, mentioned in only 16 percent of her ad buys back to September 23.
FF PAC, which has sponsored over 13,000 ads in the last two weeks, has focused almost exclusively on taxes, both on Harris’s plan to raise taxes on the wealthy and a critique of Trump’s tax cuts when he was President.
While pro-Trump groups remain focused on crime and public safety, a majority of ad spots from the Trump campaign in the last two weeks have mentioned taxes and jobs. In addition, nearly half of his spots have also focused on transgender issues. In one ad, for example, Trump attacks Harris for supporting transgender rights for prisoners. The tagline of the ad says, “Kamala’s agenda is they/them, not you.”
Table 5: Top Issues by Sponsor in Presidential Race (September 23 to October 6)
| % of airings | % of airings |
|||||
|---|---|---|---|---|---|---|
| Harris, Kamala | Health care | 32.7% | Trump, Donald | Taxes | 64.1% | |
| (53,602 airings) | Prescription drugs | 27.3% | (39,170 airings) | Jobs | 51.8% | |
| Economy | 21.0% | Gender identity | 48.2% | |||
| Housing | 21.0% | Economy | 39.3% | |||
| Inflation | 21.0% | Oil/gas prices | 38.6% | |||
| Taxes | 20.6% | Inflation | 35.6% | |||
| Abortion | 15.7% | Housing | 32.2% | |||
| Public safety | 15.0% | Health care | 30.8% | |||
| Drug problems | 15.0% | Senior citizens | 13.1% | |||
| Manufacturing | 13.1% | Social security | 12.5% | |||
| FF PAC | Taxes | 96.9% | Make America Great Again Inc. | Public safety | 100.0% | |
| (13,309 airings) | Economy | 20.7% | (5,687 airings) | Budget | 44.8% | |
| Inflation | 20.7% | Preserve America PAC | Public safety | 100.0% | ||
| (3,820 airings) | Budget | 66.5% | ||||
| Immigration | 33.5% | |||||
| Guns | 33.5% | |||||
| Figures are from September 23 to October 6, 2024. Numbers include broadcast television for all sponsors. CITE SOURCE OF DATA AS: Vivvix CMAG with analysis by the Wesleyan Media Project. |
||||||
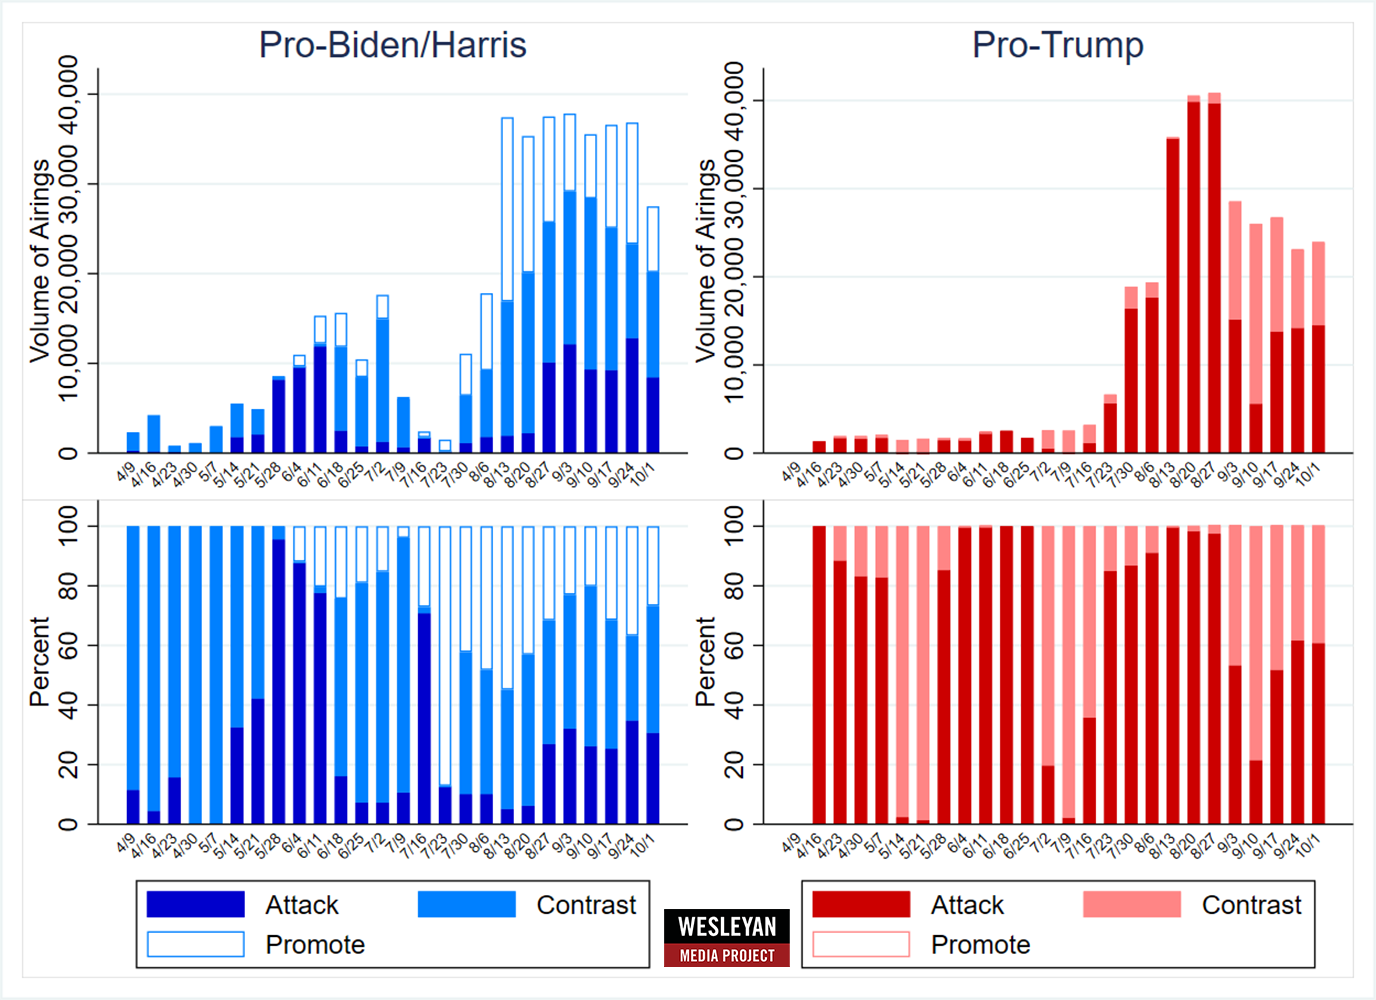
In Figure 3, we show the volume and percent of ads by tone since April 2024. In these calculations, we consider ads that only mention the favored candidate as promotional; ads that only mention the opponent as attack spots; and ads that mention both the favored and opposing candidate as contrast ads. The number of pro-Harris ad buys in the last week dropped compared to earlier weeks (top left panel), though the number of pro-Trump ads bumped up slightly. In recent weeks, pro-Trump ads have also stepped up attacks on Harris. Attack spots now constitute 60 percent of pro-Trump ad buys in each of the last two weeks, though this is still lower as a share of pro-Trump ads compared to August.
Figure 3: Volume and Tone of Presidential Ads by Week (April 9 to October 6)
Numbers include broadcast television for all sponsors.
CITE SOURCE OF DATA AS: Vivvix CMAG with analysis by the Wesleyan Media Project.
OH and MT Top List of Senate Ad Airings; Dems Very Active in TX Race
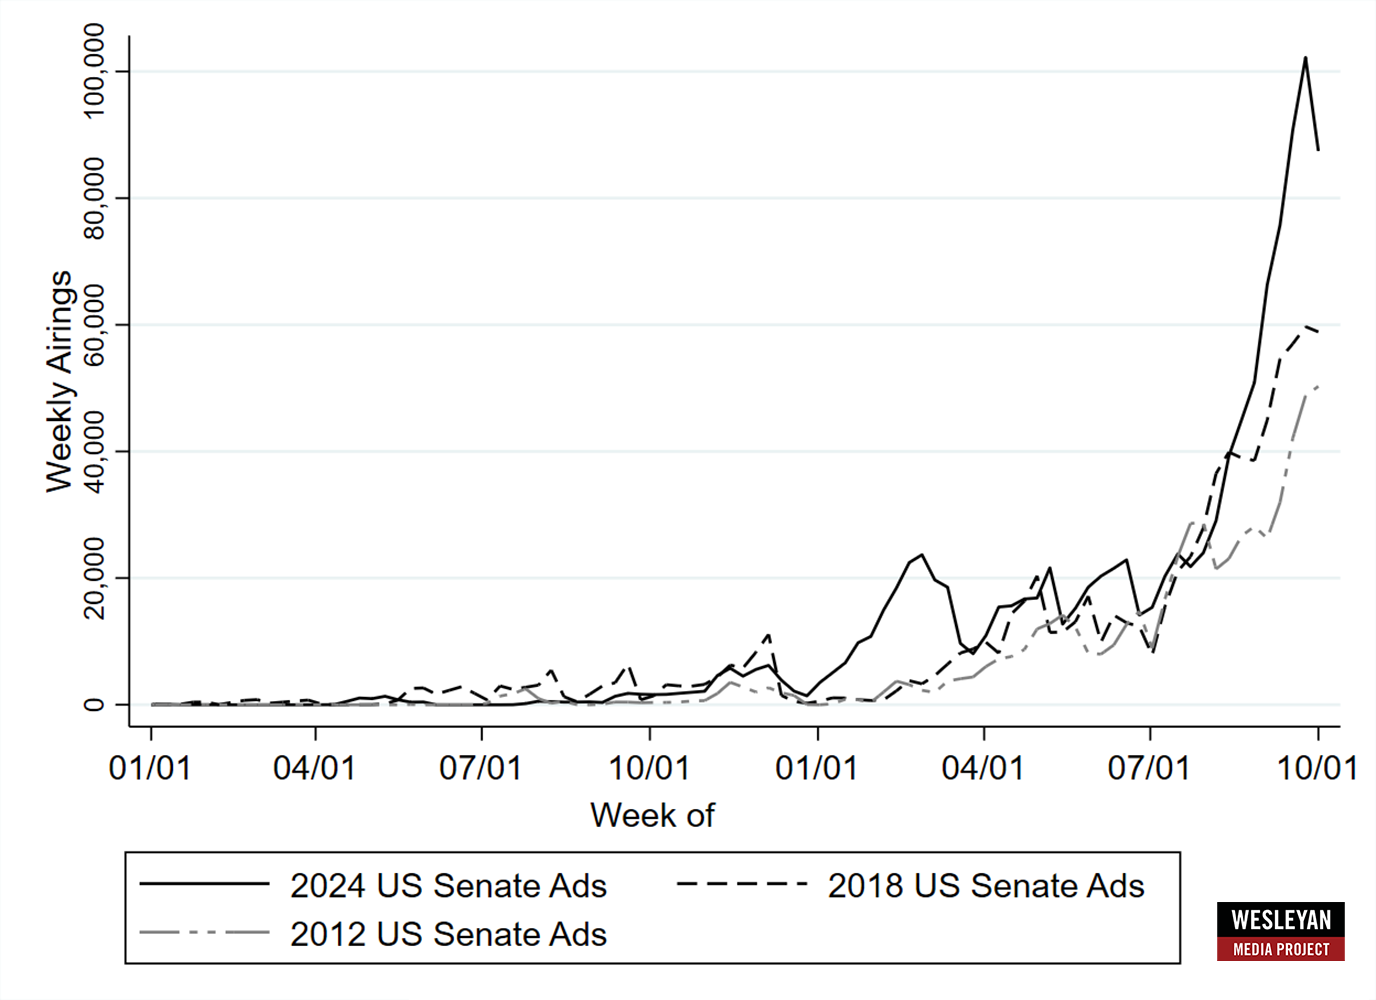
Turning to U.S. Senate races, this election cycle is breaking records for ad buys on broadcast stations. In Figure 4 we show the weekly ad totals over the course of the election year compared to prior cycles with races in the same states (2012 and 2018). Weekly ad buys this year now exceed 80,000 or higher, whereas totals in prior weeks (through early October) top out at 60,000.
Figure 4: Volume of U.S. Senate Ads by Week (2024, 2018, 2012)
Numbers include broadcast television for all sponsors.
CITE SOURCE OF DATA AS: Vivvix CMAG with analysis by the Wesleyan Media Project.
Table 6 highlights ad totals and spending in Senate races over the last two weeks. In Ohio and Montana, ad spots in each totaled nearly 40,000, costing over $43 million in Ohio and $24 million in Montana. Democrats have out-aired the Republicans in seven of the top ten races in Table 6 (including in Nebraska, where the Independent candidate has the backing of Democrats). Republicans have out-aired Democrats in Montana (by 432 ads of nearly 40,000 total), Pennsylvania, and in Maryland (by 50 spots of over 9,000 airings).
Texas Sees Infusion of Democratic Senate Ads
In Texas, Colin Allred and the Democratic Senatorial Campaign Committee have aired over 16,000 spots in the last two weeks, vastly out-airing pro-Cruz efforts by about 2:1. The race is a long-shot for Democrats (it’s rated as Lean Republican by Cook Political Report), but some recent polling has given Democrats hope for an upset.
Table 6: Volume of Ad Airings and Spending in Senate Races (September 23 to October 6)
| State | Airings | Est Cost (in $Ms) | Pro-Dem airings | Pro-GOP airings | Dem airing advantage | % D airings from groups | % R airings from groups |
|---|---|---|---|---|---|---|---|
| OH | 39,573 | 43.46 | 20,671 | 18,902 | 1,769 | 49.5% | 83.5% |
| MT | 39,435 | 23.77 | 19,393 | 19,832 | -439 | 40.1% | 52.7% |
| TX | 23,966 | 16.6 | 16,450 | 7,516 | 8,934 | 0.0% | 35.6% |
| PA | 16,740 | 26.18 | 7,518 | 9,222 | -1,704 | 46.8% | 71.2% |
| WI | 13,515 | 13.54 | 7,319 | 5,379 | 1,940 | 22.0% | 30.3% |
| MI | 13,115 | 21.56 | 7,227 | 4,781 | 2,446 | 31.0% | 37.0% |
| AZ | 10,579 | 14.85 | 7,634 | 2,945 | 4,689 | 46.4% | 64.8% |
| NE+ | 9,714 | 2.76 | 0 | 4,356 | -4,356 | 0.0% | 14.2% |
| MD | 9,012 | 11.36 | 4,481 | 4,531 | -50 | 24.0% | 69.7% |
| NV | 7,630 | 9.75 | 4,714 | 2,916 | 1,798 | 44.3% | 6.6% |
| FL | 5,631 | 5.4 | 4,275 | 1,356 | 2,919 | 0.0% | 36.5% |
| VA | 3,953 | 0.8 | 3,953 | 0 | 3,953 | 0.0% | |
| MO | 3,366 | 2.48 | 1,708 | 1,658 | 50 | 0.0% | 18.0% |
| NM | 2,605 | 0.81 | 1,763 | 842 | 921 | 0.0% | 0.0% |
| MN | 1,509 | 0.565 | 1,509 | 0 | 1,509 | 0.0% | |
| ND | 1,151 | 0.276 | 339 | 812 | -473 | 0.0% | 0.0% |
| TN | 1,102 | 0.352 | 0 | 1,102 | -1,102 | 0.0% | |
| ME* | 925 | 0.289 | 0 | 0 | 0 | ||
| NY | 783 | 1.3 | 783 | 0 | 783 | 0.0% | |
| RI | 655 | 0.178 | 655 | 0 | 655 | 0.0% | |
| CT | 496 | 0.135 | 496 | 0 | 496 | 0.0% | |
| DE | 262 | 0.369 | 262 | 0 | 262 | 0.0% | |
| WY | 109 | 0.005 | 0 | 109 | -109 | 100.0% | |
| MA | 35 | 0.071 | 0 | 35 | -35 | 100.0% | |
| VT | 33 | 0.005 | 0 | 33 | -33 | 0.0% | |
| CA | 6 | 0.005 | 0 | 6 | -6 | 0.0% | |
| Figures are from September 23 to October 6, 2024. +The Independent candidate (and supportive groups) have aired 5,174 ads. *All ads aired have been from the Independent candidate. CITE SOURCE OF DATA AS: Vivvix CMAG with analysis by the Wesleyan Media Project. |
|||||||
U.S. Senate Races are Unusually Negative this Fall
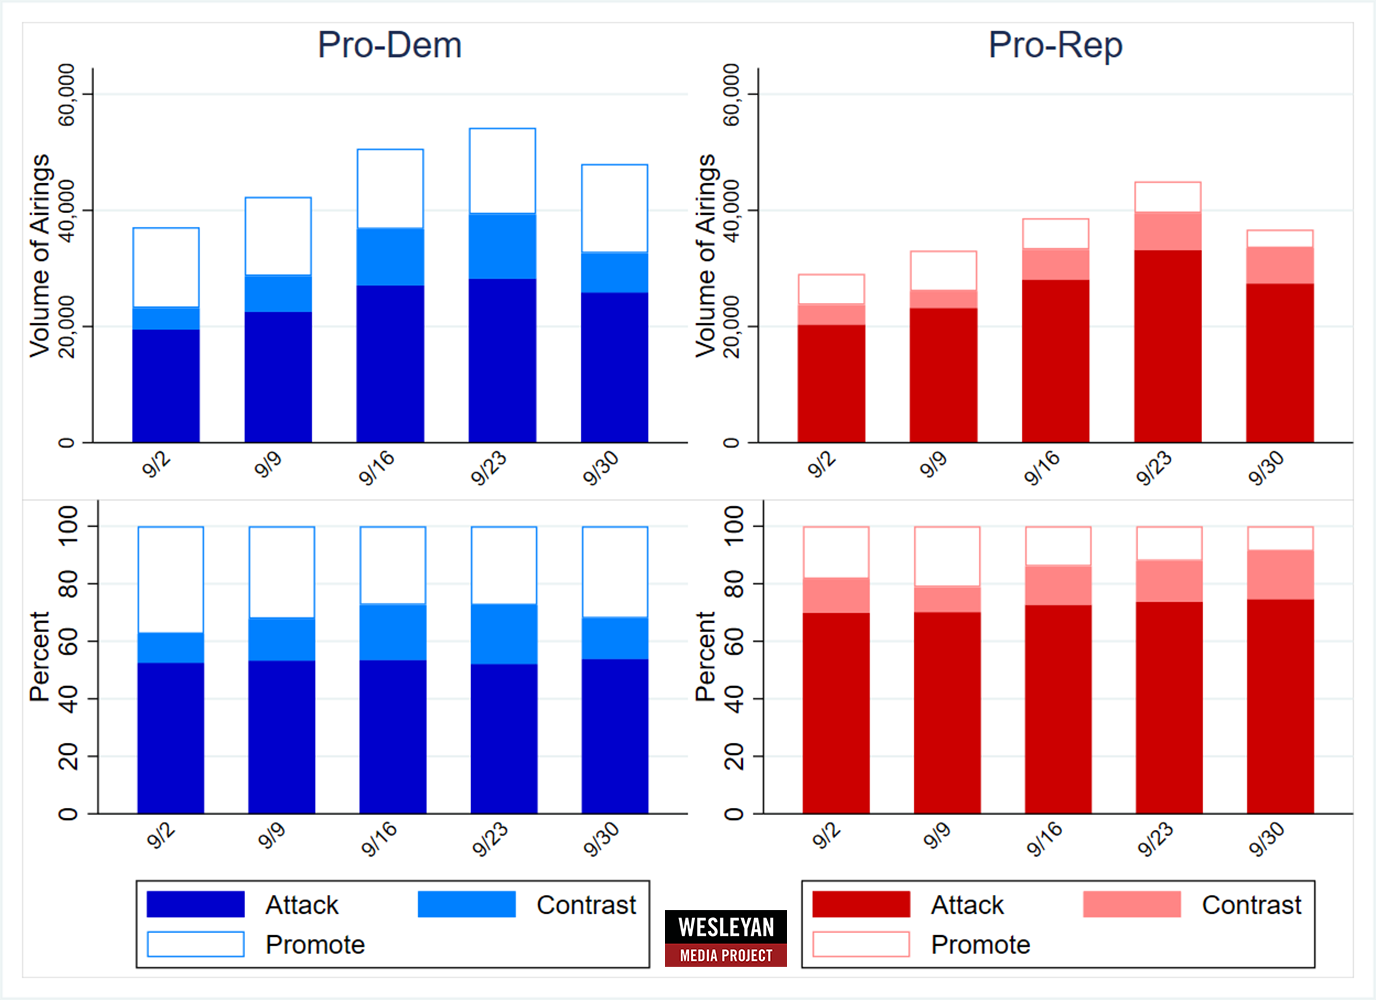
In recent weeks, ads in Senate races overall have become a bit more negative, especially on the Republican side. Nearly 3 in 4 pro-GOP ads in recent weeks have focused on attacking Democratic opponents (Figure 5). On the Democratic side, the attack ads have ticked up to about 50 percent of airings over the last month.
Figure 5: Tone of Ad Airings in Senate Races by Week (September 2 to October 6)
Numbers include broadcast television for all sponsors.
CITE SOURCE OF DATA AS: Vivvix CMAG with analysis by the Wesleyan Media Project.
In Table 7, we show rates of attack ads by Senate race back to September 1. In Montana, for example, over 50 percent of pro-Democratic spots have been attacks on the Republican candidate, while 81 percent of pro-GOP airings have been attacks on the Democrat, Jon Tester. The Senate race in Pennsylvania has been the most negative Senate race since September 1, with over 80 percent of 42,000 ad airings focused on attacking the other candidate.
Table 7: Tone of Ad Airings In Senate Races (September 1 to October 6)
| State | Airings | Pro-Dem | Pro-Rep | % attack | Pro-D attack | Pro-R attack |
|---|---|---|---|---|---|---|
| MT | 93,472 | 48,706 | 44,766 | 65.3% | 51.2% | 80.6% |
| OH | 87,468 | 41,085 | 46,383 | 66.0% | 68.8% | 63.5% |
| TX | 42,162 | 29,394 | 12,768 | 53.3% | 40.2% | 83.6% |
| PA | 41,926 | 18,041 | 23,885 | 80.9% | 78.5% | 82.7% |
| WI | 31,125 | 17,383 | 13,742 | 79.8% | 78.8% | 80.9% |
| MI | 30,442 | 19,343 | 11,099 | 58.4% | 59.9% | 55.7% |
| AZ | 25,387 | 19,040 | 6,347 | 47.8% | 32.3% | 94.2% |
| MD | 15,960 | 10,452 | 5,508 | 53.0% | 55.4% | 48.6% |
| NV | 15,945 | 10,388 | 5,557 | 57.6% | 57.1% | 58.7% |
| NE | 12,712 | 184 | 6,302 | 26.6% | 0.0% | 53.6% |
| MO | 8,808 | 4,890 | 3,918 | 51.4% | 47.6% | 56.0% |
| FL | 8,573 | 5,631 | 2,942 | 40.8% | 10.0% | 99.7% |
| NM | 6,671 | 3,968 | 2,703 | 45.1% | 25.8% | 73.4% |
| VA | 3,966 | 3,953 | 13 | 0.0% | 0.0% | 0.0% |
| MN | 2,038 | 2,038 | 0 | 0.0% | 0.0% | |
| ND | 1,768 | 956 | 812 | 0.0% | 0.0% | 0.0% |
| RI | 1,588 | 1,588 | 0 | 0.0% | 0.0% | |
| ME* | 1,549 | 0 | 0 | 0.0% | ||
| TN | 1,150 | 0 | 1,150 | 0.0% | 0.0% | |
| NY | 783 | 783 | 0 | 0.0% | 0.0% | |
| CT | 496 | 496 | 0 | 0.0% | 0.0% | |
| MA | 263 | 0 | 263 | 0.0% | 0.0% | |
| DE | 262 | 262 | 0 | 0.0% | 0.0% | |
| WY | 109 | 0 | 109 | 0.0% | 0.0% | |
| VT | 33 | 0 | 33 | 0.0% | 0.0% | |
| CA | 6 | 0 | 6 | 0.0% | 0.0% | |
| Figures are from September 1 to October 6, 2024. *All ads aired have been from the Independent candidate. CITE SOURCE OF DATA AS: Vivvix CMAG with analysis by the Wesleyan Media Project. |
||||||
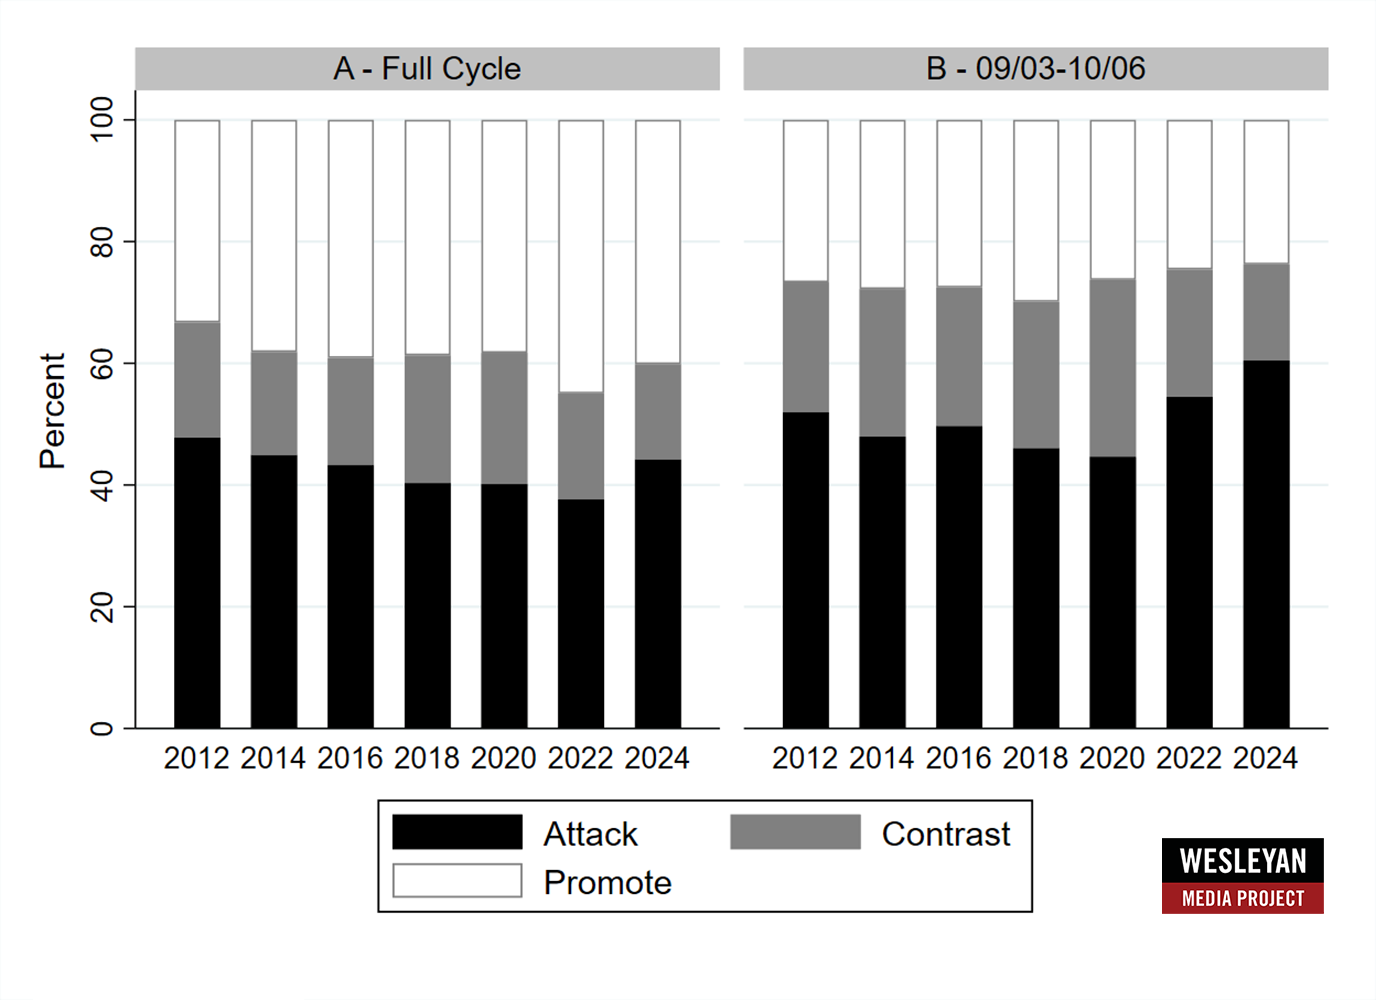
As an additional comparison, we show rates of promotional, attack, and contrast spots in the six previous election cycles in addition to 2024 (Figure 6). For the full cycle (Panel A), 2024 is more negative than any previous campaign back to 2014. For the comparable period in September and early October of each cycle (Panel B), 2024 is the most negative Senate election back to 2012.
“Senate ads in the last month stand out as quite negative,” said Travis Ridout, co-director of the Wesleyan Media Project. “Three in five airings are solely about the negative characteristics of the opponent. And there are fewer purely promotional spots in this period than in previous cycles.”
Figure 6: Tone of Ad Airings in U.S. Senate Races by Year (2012-2024)
Numbers include broadcast television for all sponsors.
CITE SOURCE OF DATA AS: Vivvix CMAG with analysis by the Wesleyan Media Project.
CA-22 Tops 10K Ads in Last Two Weeks; Dems Out-Air GOP in Most Races
Advertising in U.S. House races is also heating up, with more than 10,000 ad airings in the past two weeks in California’s 22nd congressional district (Table 8). The race features Republican incumbent David Valadao facing off against Democrat Rudy Salas. California’s 13th district race and the race in New York’s 19th district also top the list. In most of the top races, the Democratic candidate is benefitting from more ads than the Republican candidate.
Table 8: Volume of Ad Airings and Spending in Top House Races (September 23 to October 6)
| State | District | Airings | Est Cost (in $Ms) | Pro-Dem airings | Pro-GOP airings | Dem airing advantage | % D airings from groups | % R airings from groups |
|---|---|---|---|---|---|---|---|---|
| CA | 22 | 10,108 | 4.07 | 5,294 | 4,814 | 480 | 17.5% | 57.7% |
| CA | 13 | 8,896 | 4.64 | 5,450 | 3,446 | 2,004 | 9.8% | 26.2% |
| NY | 19 | 7,960 | 3.28 | 3,597 | 4,363 | -766 | 20.9% | 21.8% |
| NM | 2 | 7,578 | 3.07 | 5,495 | 2,083 | 3,412 | 3.0% | 43.6% |
| AK | 1 | 6,918 | 3.45 | 4,391 | 2,527 | 1,864 | 47.9% | 61.3% |
| ME | 2 | 6,415 | 3.6 | 3,959 | 2,456 | 1,503 | 5.1% | 28.4% |
| OR | 5 | 5,979 | 5.09 | 3,517 | 2,462 | 1,055 | 3.9% | 57.1% |
| NC | 1 | 5,531 | 4.53 | 3,914 | 1,617 | 2,297 | 12.8% | 54.1% |
| NY | 22 | 5,192 | 1.72 | 3,026 | 2,166 | 860 | 0.0% | 37.4% |
| CO | 3 | 4,924 | 0.861 | 3,531 | 1,393 | 2,138 | 0.0% | 0.0% |
| AZ | 6 | 4,849 | 2.95 | 3,504 | 1,345 | 2,159 | 16.7% | 0.0% |
| IA | 3 | 4,643 | 3.34 | 2,579 | 2,064 | 515 | 14.4% | 54.5% |
| CA | 41 | 4,240 | 2.14 | 2,804 | 1,436 | 1,368 | 0.0% | 6.5% |
| NE | 2 | 3,943 | 3.08 | 2,018 | 1,925 | 93 | 11.8% | 46.0% |
| IA | 1 | 3,885 | 2.22 | 2,311 | 1,574 | 737 | 0.0% | 27.6% |
| CO | 8 | 3,856 | 4.36 | 2,545 | 1,311 | 1,234 | 23.9% | 36.3% |
| MT | 1 | 3,639 | 1.1 | 1,927 | 1,712 | 215 | 7.2% | 0.0% |
| OH | 9 | 3,612 | 2.65 | 2,271 | 1,341 | 930 | 16.7% | 45.7% |
| IL | 17 | 3,436 | 1.4 | 2,318 | 1,118 | 1,200 | 45.6% | 0.0% |
| PA | 8 | 3,166 | 4.22 | 2,044 | 1,122 | 922 | 4.6% | 38.1% |
| AZ | 1 | 3,137 | 5 | 1,785 | 1,352 | 433 | 25.1% | 40.9% |
| WA | 3 | 3,010 | 2.74 | 2,338 | 672 | 1,666 | 0.0% | 0.0% |
| CA | 49 | 2,865 | 0.877 | 0 | 2,865 | -2,865 | 0.0% | |
| MI | 7 | 2,715 | 4.93 | 1,553 | 1,162 | 391 | 2.9% | 41.4% |
| VA | 2 | 2,625 | 0.875 | 1,235 | 1,390 | -155 | 48.9% | 34.8% |
| CA | 3 | 2,394 | 1.23 | 1,174 | 1,220 | -46 | 0.0% | 0.0% |
| PA | 10 | 2,303 | 2.23 | 1,988 | 315 | 1,673 | 12.1% | 16.2% |
| MI | 8 | 2,286 | 2.11 | 1,347 | 939 | 408 | 45.4% | 35.9% |
| CT | 5 | 2,178 | 0.691 | 1,510 | 668 | 842 | 0.0% | 0.0% |
| WI | 3 | 2,124 | 1.31 | 1,052 | 1,072 | -20 | 0.0% | 0.0% |
| AL | 2 | 2,061 | 0.594 | 691 | 1,370 | -679 | 0.0% | 0.0% |
| NY | 17 | 2,030 | 3.09 | 1,186 | 844 | 342 | 0.0% | 51.3% |
| CA | 27 | 1,905 | 1.77 | 1,041 | 864 | 177 | 1.0% | 69.9% |
| PA | 7 | 1,878 | 4.27 | 1,390 | 488 | 902 | 33.1% | 79.3% |
| OH | 13 | 1,842 | 2.82 | 1,362 | 480 | 882 | 0.0% | 84.6% |
| NV | 4 | 1,788 | 2.51 | 1,784 | 4 | 1,780 | 22.1% | 0.0% |
| CA | 9 | 1,787 | 1.34 | 815 | 972 | -157 | 0.0% | 0.0% |
| VA | 7 | 1,787 | 1.71 | 1,515 | 272 | 1,243 | 0.0% | 100.0% |
| KS | 3 | 1,616 | 0.481 | 1,598 | 18 | 1,580 | 0.0% | 0.0% |
| MN | 2 | 1,528 | 1.7 | 1,528 | 0 | 1,528 | 41.4% | |
| NY | 18 | 1,519 | 3.05 | 1,341 | 178 | 1,163 | 51.4% | 0.0% |
| OR | 4 | 1,509 | 0.207 | 1,038 | 471 | 567 | 0.0% | 0.0% |
| OR | 6 | 1,458 | 0.411 | 1,458 | 0 | 1,458 | 0.0% | |
| NY | 4 | 1,449 | 3.19 | 1,040 | 409 | 631 | 0.0% | 46.0% |
| CA | 45 | 1,234 | 0.692 | 13 | 1,221 | -1,208 | 0.0% | 25.8% |
| CA | 47 | 1,153 | 2 | 740 | 413 | 327 | 42.6% | 0.0% |
| WI | 1 | 1,079 | 0.844 | 451 | 628 | -177 | 0.0% | 0.0% |
| TX | 34 | 1,071 | 0.82 | 475 | 596 | -121 | 57.9% | 0.0% |
| NV | 2 | 1,036 | 0.241 | 0 | 165 | -165 | 0.0% |
Figures are from September 23 to October 6, 2024.
CITE SOURCE OF DATA AS: Vivvix CMAG with analysis by the Wesleyan Media Project.
Negativity Increases in U.S. House Races Over the Last Month
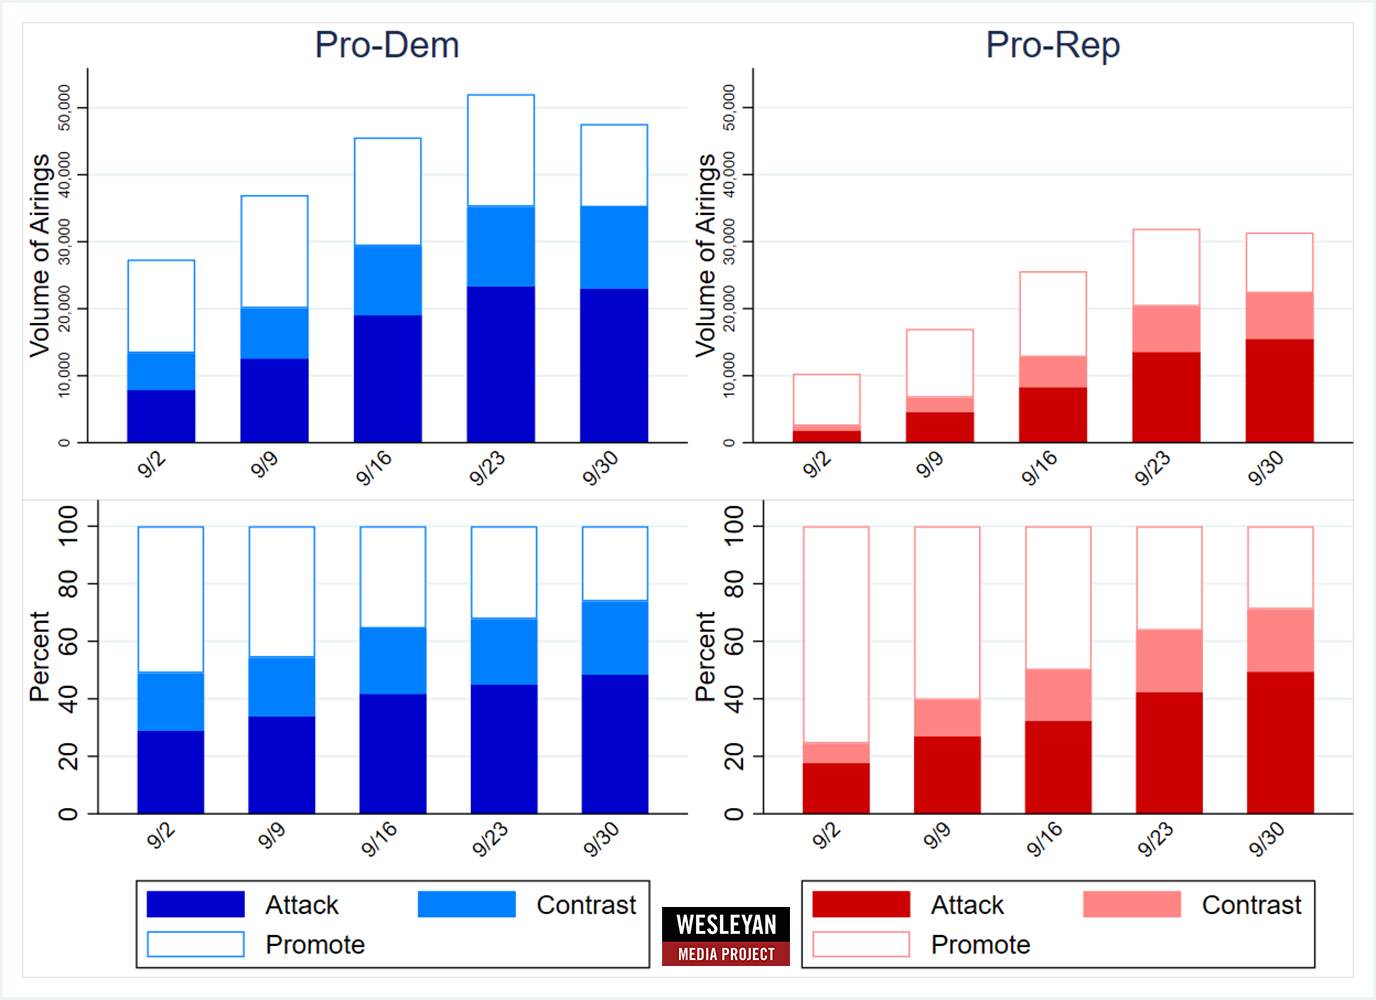
Figure 7 shows the tone of advertising in House races, with the top panels speaking to the absolute number of pro-Democratic and pro-Republican ads by tone, and the bottom panels speaking to the percentage of pro-Democratic and pro-Republican ads by tone.
A few things stand out. First, the number of pro-Democratic ads overall is substantially higher than the number of pro-Republican ads–just under 50,000 this past week on the Democratic side compared to just over 30,000 this past week on the Republican side. Second, negative and contrast ads have been increasing as the election approaches, with positive ads on the decline. Third, ads supporting Democratic candidates have been more negative than ads supporting Republican candidates, though the rates of Republican negativity have caught up in the past week.
Figure 7: Tone of Ad Airings in House Races by Week (September 2 to October 6)
Numbers include broadcast television for all sponsors.
CITE SOURCE OF DATA AS: Vivvix CMAG with analysis by the Wesleyan Media Project.
Table 9 looks at the tone of individual House races, for ads airing back to September 1. The two races with the most ads over this period—NY-19 and CA-22—are also the most negative, with over 60 percent of the ad airings in both races focused on attacking the opposing candidate.
Table 9: Tone of Ad Airings in Top House Races (September 1 to October 6)
| State | District | Airings | Pro-Dem | Pro-Rep | % negative | Pro-D negative | Pro-R negative |
|---|---|---|---|---|---|---|---|
| NY | 19 | 16,381 | 8,098 | 8,283 | 60.70% | 57.8% | 63.6% |
| CA | 22 | 15,817 | 7,365 | 8,452 | 69.90% | 72.3% | 67.7% |
| AK | 1 | 14,662 | 9,679 | 4,983 | 45.60% | 38.8% | 58.7% |
| NM | 2 | 14,605 | 10,836 | 3,769 | 50.80% | 43.3% | 72.4% |
| CA | 13 | 14,398 | 9,960 | 4,438 | 56.80% | 66.5% | 34.9% |
| ME | 2 | 13,294 | 8,362 | 4,932 | 35.70% | 37.5% | 32.7% |
| OR | 5 | 12,167 | 8,046 | 4,121 | 53.00% | 62.9% | 33.7% |
| NC | 1 | 11,261 | 9,220 | 2,041 | 43.80% | 36.9% | 75.3% |
| AZ | 6 | 10,258 | 6,896 | 3,362 | 51.20% | 72.6% | 7.5% |
| CO | 3 | 9,502 | 7,829 | 1,673 | 0.00% | 0.0% | 0.0% |
| NY | 22 | 9,274 | 5,808 | 3,466 | 39.80% | 47.1% | 27.6% |
| MT | 1 | 9,232 | 4,887 | 4,345 | 9.50% | 5.7% | 13.7% |
| IA | 3 | 9,176 | 5,202 | 3,974 | 42.30% | 51.0% | 30.8% |
| NE | 2 | 8,004 | 4,216 | 3,788 | 46.70% | 45.8% | 47.8% |
| CA | 41 | 7,891 | 5,617 | 2,274 | 24.40% | 15.3% | 47.0% |
| CO | 8 | 7,575 | 5,742 | 1,833 | 27.00% | 16.6% | 59.7% |
| PA | 8 | 7,533 | 5,269 | 2,264 | 30.40% | 25.1% | 42.8% |
| OH | 9 | 7,235 | 4,241 | 2,994 | 52.40% | 53.5% | 50.9% |
| WA | 3 | 6,729 | 5,556 | 1,173 | 57.10% | 61.5% | 35.9% |
| IA | 1 | 6,679 | 4,244 | 2,435 | 18.20% | 20.9% | 13.5% |
| IL | 17 | 5,539 | 4,114 | 1,425 | 37.70% | 50.8% | 0.0% |
| CA | 49 | 5,468 | 0 | 5,468 | 0.00% | 0.0% | |
| CT | 5 | 5,312 | 3,786 | 1,526 | 6.30% | 0.0% | 22.0% |
| MI | 8 | 4,879 | 2,622 | 2,257 | 48.70% | 31.6% | 68.5% |
| VA | 2 | 4,853 | 2,393 | 2,460 | 38.90% | 40.0% | 37.9% |
| MI | 7 | 4,595 | 2,898 | 1,697 | 62.00% | 78.7% | 33.4% |
| WI | 3 | 4,589 | 2,533 | 2,056 | 44.00% | 41.4% | 47.1% |
| PA | 10 | 4,557 | 4,114 | 443 | 50.90% | 55.9% | 4.5% |
| NY | 17 | 4,318 | 3,159 | 1,159 | 44.30% | 43.3% | 46.9% |
| AZ | 1 | 3,996 | 2,414 | 1,582 | 57.80% | 36.7% | 89.9% |
| KS | 3 | 3,881 | 3,863 | 18 | 54.20% | 54.5% | 0.0% |
| CA | 3 | 3,717 | 1,675 | 2,042 | 26.00% | 49.4% | 6.8% |
| PA | 7 | 3,637 | 3,149 | 488 | 27.10% | 15.8% | 100.0% |
| OR | 4 | 3,512 | 2,391 | 1,121 | 53.10% | 61.8% | 34.6% |
| OR | 6 | 3,340 | 3,340 | 0 | 0.00% | 0.0% | |
| CA | 9 | 3,226 | 1,256 | 1,970 | 17.80% | 35.4% | 6.6% |
| MN | 2 | 2,956 | 2,956 | 0 | 0.00% | 0.0% | |
| NV | 4 | 2,934 | 2,924 | 10 | 37.00% | 37.1% | 0.0% |
| CA | 27 | 2,748 | 1,884 | 864 | 60.20% | 42.0% | 100.0% |
| OH | 13 | 2,644 | 2,164 | 480 | 49.40% | 41.6% | 84.6% |
| VA | 7 | 2,622 | 2,350 | 272 | 69.40% | 77.4% | 0.0% |
| AL | 2 | 2,597 | 832 | 1,765 | 0.00% | 0.0% | 0.0% |
| TX | 15 | 2,508 | 702 | 1,806 | 0.00% | 0.0% | 0.0% |
| WI | 1 | 2,398 | 1,051 | 1,347 | 20.70% | 0.0% | 36.8% |
| TX | 34 | 2,218 | 601 | 1,617 | 17.60% | 26.0% | 14.5% |
| MI | 3 | 1,991 | 1,991 | 0 | 33.10% | 33.1% | |
| NV | 1 | 1,810 | 1,810 | 0 | 48.60% | 48.6% | |
| NV | 2 | 1,774 | 0 | 165 | 0.00% | 0.0% | |
| CA | 47 | 1,764 | 1,202 | 562 | 68.10% | 100.0% | 0.0% |
| CA | 45 | 1,659 | 13 | 1,646 | 46.20% | 100.0% | 45.8% |
| NY | 4 | 1,633 | 1,224 | 409 | 86.50% | 100.0% | 46.0% |
| NJ | 7 | 1,618 | 744 | 874 | 10.00% | 0.0% | 18.4% |
| NY | 18 | 1,519 | 1,341 | 178 | 0.00% | 0.0% | 0.0% |
| PA | 17 | 1,472 | 682 | 790 | 21.90% | 47.4% | 0.0% |
| MI | 10 | 1,439 | 668 | 771 | 19.80% | 0.0% | 37.0% |
| NV | 3 | 1,098 | 1,098 | 0 | 24.00% | 24.0% |
Figures are from September 1 to October 6, 2024.
CITE SOURCE OF DATA AS: Vivvix CMAG with analysis by the Wesleyan Media Project.
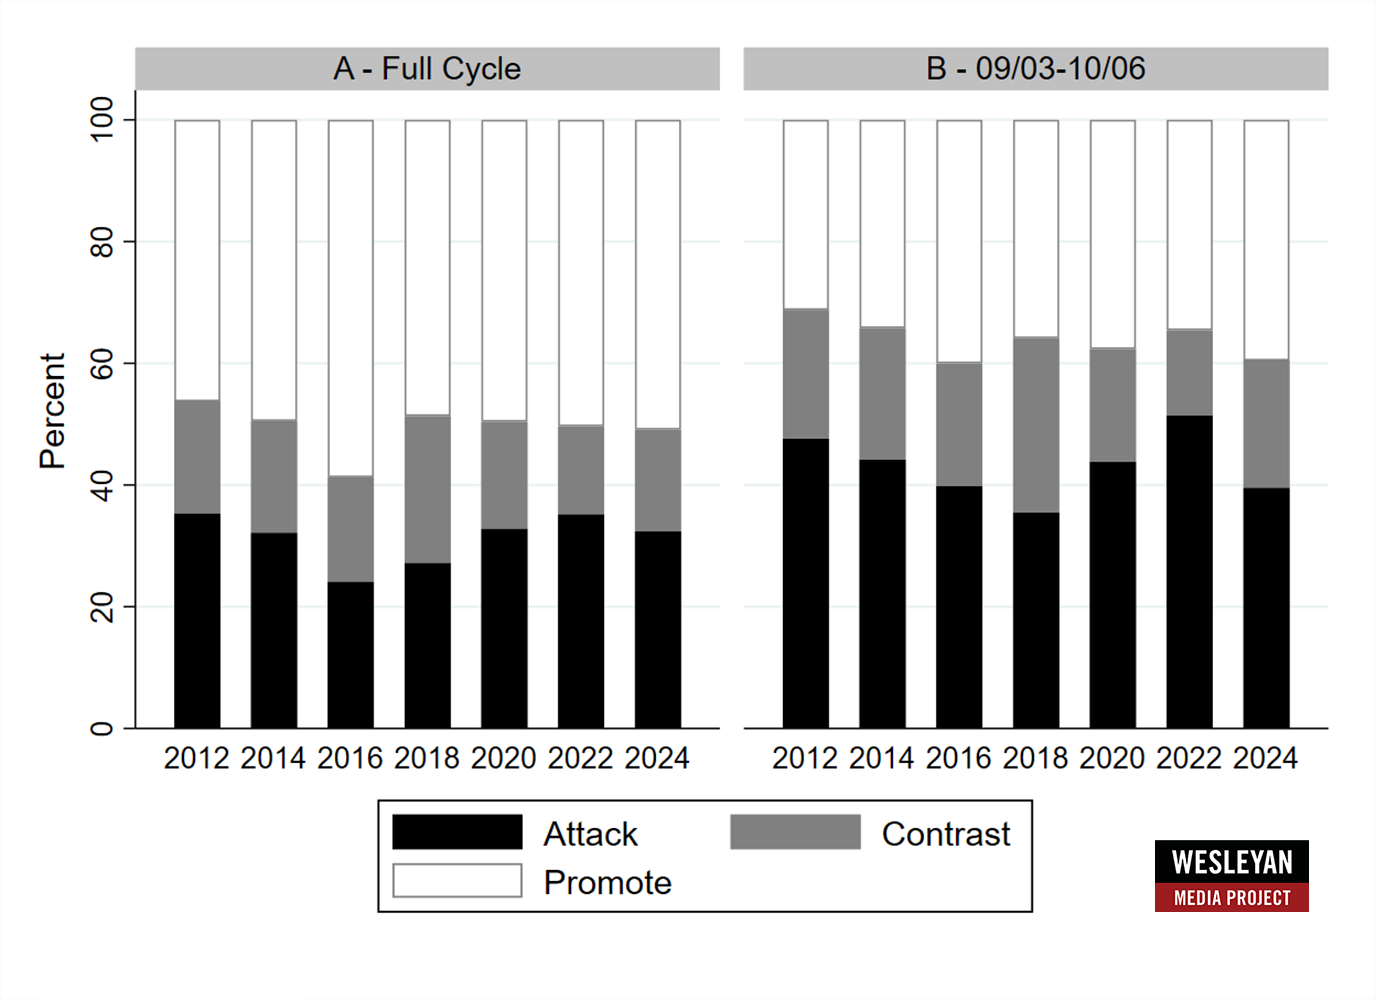
While some House races this cycle are very negative, the historical comparison (Figure 8) shows that 2024 is not the most negative. This is true in both the full-cycle comparison and in looking only at the period between September 3 and October 6.
Figure 8: Tone of Ad Airings in House Races by Year (2012-2024)
Numbers include broadcast television for all sponsors.
CITE SOURCE OF DATA AS: Vivvix CMAG with analysis by the Wesleyan Media Project.
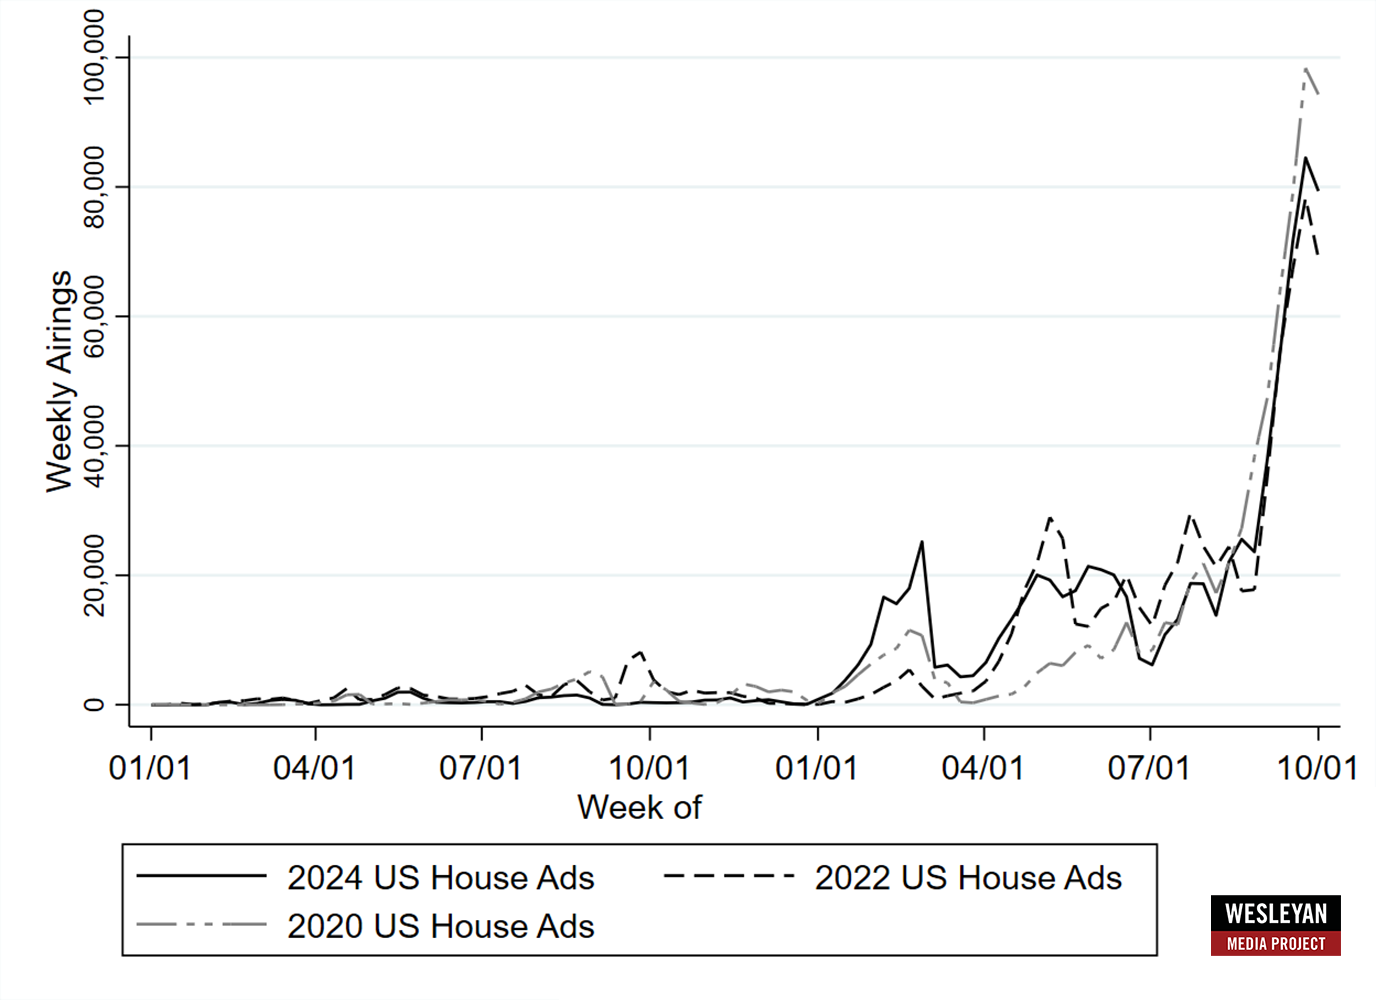
Finally, Figure 9 shows House ads by week in 2024 in comparison to the previous two cycles. In total, House ads in 2024 out-number ads in 2022 and 2020, but this was driven by larger bumps in ads from earlier in the year. In recent weeks, the volume of House ads has lagged the pace of ads in 2020.
Figure 9: Volume of House Ads by Week (2024, 2020, 2022)
Numbers include broadcast television for all sponsors.
CITE SOURCE OF DATA AS: Vivvix CMAG with analysis by the Wesleyan Media Project.
NH Tops List of Gov Ads, and GOP Abandon NC Race
The race for governor of New Hampshire has featured the most ads among the small slate of gubernatorial campaigns in 2024 (Table 10). Kelly Ayotte, the former Senator and current GOP nominee for governor in New Hampshire, has heavily out-advertised her Democratic opponent. And in North Carolina, the Republican effort behind Mark Robinson has all but ended, a consequence of a recent scandal. The Democratic candidate has continued to advertise, and he aired 6,585 spots over the last two weeks to the Republican’s 118.
Table 10: Volume of Ad Airings and Spending in Gubernatorial Races (September 23 to October 6)
| State | Airings | Est Cost (in $Ms) | Pro-Dem airings | Pro-GOP airings | Dem airing advantage | % D airings from groups | % R airings from groups |
|---|---|---|---|---|---|---|---|
| NH | 8,577 | 4.9 | 2,808 | 5,769 | -2,961 | 0.0% | 0.2% |
| NC | 6,703 | 4.47 | 6,585 | 118 | 6,467 | 0.0% | 0.0% |
| IN | 5,107 | 1.06 | 3,109 | 1,998 | 1,111 | 0.0% | 0.0% |
| WA | 3,050 | 2.16 | 3,048 | 2 | 3,046 | 59.2% | 0.0% |
| MT | 1,404 | 0.251 | 0 | 1,404 | -1,404 | 0.0% | |
| VT | 115 | 0.026 | 0 | 115 | -115 | 0.0% | |
| Figures are from September 23 to October 6, 2024. CITE SOURCE OF DATA AS: Vivvix CMAG with analysis by the Wesleyan Media Project. |
|||||||
The most negative gubernatorial campaign since September 1, as a percentage of all ads aired, is in Washington State. Eighty percent of the 4,700 spots were attack, but all of the attack ads were from pro-Democratic spots. In fact, the Republican has aired only 2 spots, and the race is rated a “Likely Democratic” seat by the Cook Political Report.
Table 11: Tone of Ad Airings in Gubernatorial Races (September 1 to October 6)
| State | Airings | Pro-Dem | Pro-Rep | % negative | Pro-D negative | Pro-R negative |
|---|---|---|---|---|---|---|
| NC | 21,546 | 16,476 | 5,070 | 61.3% | 49.5% | 99.4% |
| NH | 17,985 | 6,992 | 10,993 | 72.0% | 81.5% | 66.0% |
| IN | 8,028 | 4,967 | 3,061 | 41.2% | 50.9% | 25.4% |
| WA | 4,738 | 4,736 | 2 | 80.4% | 80.5% | 0.0% |
| DE | 1,516 | 1,516 | 0 | 35.3% | 35.3% | |
| MT | 1,404 | 0 | 1,404 | 0.0% | 0.0% | |
| VT | 115 | 0 | 115 | 0.0% | 0.0% | |
| Figures are from September 1 to October 6, 2024. CITE SOURCE OF DATA AS: Vivvix CMAG with analysis by the Wesleyan Media Project. |
||||||
Ballot Measures Also on the Air in Many States
In addition to candidate races, there have been a slate of ballot measures across the country, and many of them featured broadcast television ads. We show in Table 12 the number of spots aired across the full election cycle for ballot measures with at least 2,000 airings. Nineteen ballot measures make the list.
The most advertised ballot measure this year is a proposal to legalize marijuana in Florida. It has featured 31,000 spots, more than double the total for Florida’s abortion rights amendment. Still, ads for the marijuana measure started in May, while ads for the abortion question started only in September.
Some measures from 2023 also featured a blitz of ad spots. This included two ballot measures in Ohio, one from August and one from November. The second was a highly discussed abortion rights measure. Both Ohio questions featured over 25,000 spots. Another proposal in Maine was to create a public utility. It featured nearly 10,000 spots. A proposal in Cincinnati, OH to approve the sale of a railway for the purpose of improving infrastructure featured nearly 4,000 spots in the Fall of 2023.
Table 12: Ad Airings in Top Ballot Measures (Full Cycle to October 6)
| State | First ads air | Last Ads | Airings | |
|---|---|---|---|---|
| Legalize marijuana | FL | 14-May-24 | 6-Oct-24 | 31,089 |
| Abortion rights | OH | 12-Sep-23 | 7-Nov-23 | 26,863 |
| 60% to amend Constitution | OH | 27-Aug-23 | 8-Aug-23 | 25,841 |
| Housing | CA | 16-Aug-24 | 6-Oct-24 | 20,100 |
| Abortion rights | FL | 10-Sep-24 | 6-Oct-24 | 14,303 |
| Public Utility | ME | 31-Jul-23 | 7-Nov-23 | 9,677 |
| Sports betting | MO | 9-Sep-24 | 6-Oct-24 | 8,875 |
| Rank choice voting/top 5 primary | NV | 27-Aug-24 | 6-Oct-24 | 8,245 |
| Gambling | AR | 5-Sep-24 | 6-Oct-24 | 5,385 |
| Health care/prescription drugs | CA | 3-Sep-24 | 6-Oct-24 | 4,543 |
| Health care/taxes | CA | 26-Jun-24 | 6-Oct-24 | 4,340 |
| Veterans/housing | CA | 30-Jan-24 | 5-Mar-24 | 4,257 |
| Infrastructure (Cincinnati) | CO | 15-Aug-23 | 7-Nov-23 | 3,716 |
| Rank choice voting | AK | 3-Sep-24 | 6-Oct-24 | 3,481 |
| Carbon tax credit | WA | 5-Sep-24 | 6-Oct-24 | 3,084 |
| Abortion rights | MO | 17-Sep-24 | 6-Oct-24 | 2,719 |
| Funding for private education | KY | 5-Sep-24 | 6-Oct-24 | 2,713 |
| Top 4 primary system | MT | 27-Sep-24 | 6-Oct-24 | 2,432 |
| Right-to-repair/cars | ME | 6-Sep-23 | 7-Nov-23 | 2,291 |
| Property taxes | CO | 12-Oct-23 | 6-Nov-23 | 2,154 |
| Figures are from January 1, 2023 to October 6, 2024. CITE SOURCE OF DATA AS: Vivvix CMAG with analysis by the Wesleyan Media Project. |
||||
About the Data
All television, addressable (which includes satellite and connected TV from LG Ad Sales), and radio data reported here are from Vivvix CMAG. Unless otherwise specified, most advertising references refer to broadcast television. All cost estimates for television are precisely that: estimates.
Meta spending data come from the aggregate reports, which provide spending information for each page name and disclaimer combination. Totals in this report reflect spending between January 1, 2023, July 22, 2024, September 21, 2024, and October 5, 2024. These totals are calculated by subtracting the reported cumulative spending (as reported by Facebook as the total spent since May 2018) for the October 5, 2024 report and subtracting the cumulative spending reported for January 1, 2023, July 21, 2024, and September 21, 2024.
Spending by Biden/Harris includes: spending on the Joe Biden page from Biden Victory Fund, DNC and Biden for President, Biden for President; spending on the Kamala HQ page from Biden Victory Fund and Harris Victory Fund; spending on the Kamala Harris page from Biden Victory Fund, DNC Services Corp., Harris for President and Harris Victory Fund; spending on the Tim Walz page by Harris Victory Fund; Biden for President spending on the Complex, Headlines 2024, The Voices of Today and The Daily Scroll pages, Biden Victory Fund spending on the Democratic Party page, and Harris for President spending on the Essence, Glamour, Headlines 2024, and Memericans pages. Spending by Trump includes: spending on the Donald J. Trump page by the Trump National Committee JFC, Donald J. Trump for President 2024, Inc., Trump 47 Committee, Inc., and Trump Save America Joint Fundraising Committee; Trump Save America Joint Fundraising Committee and Save American Joint Fundraising Committee spending on the Team Trump page; Trump National Committee JFC and Trump 47 Committee, Inc. spending on the JD Vance page; Trump National Committee JFC spending on the Alina Habba page, and Trump National Committee JFC and Donald J. Trump for President 2024 spending on Lara Trump’s page. Spending by supporting groups for Biden/Harris and Trump are listed in the table notes when they are used.
For Google ads, we downloaded the weekly reports from the platform’s Transparency Report. The totals reflected in this release are from the following time periods: January 1, 2023, or July 21, 2024, September 21, 2024, and October 5, 2024.
Spending by Biden/Harris includes the Biden for President, Harris for President, DNC Services Corp when it appears with Biden or Harris for President, Biden Victory Fund, and Harris Victory Fund advertisers. Spending by Trump includes advertisers Donald J. Trump for President 2024, Inc., Trump Save America Joint Fundraising Committee, and Trump National Committee JFC. Spending by supporting groups for Biden/Harris and Trump are listed in the table notes when they are used.
About this Report
The Wesleyan Media Project provides real-time tracking and analysis of all political television advertising in an effort to increase transparency in elections. Housed in Wesleyan’s Quantitative Analysis Center – part of the Allbritton Center for the Study of Public Life – the Wesleyan Media Project is the successor to the Wisconsin Advertising Project, which disbanded in 2009. It is directed by Erika Franklin Fowler, professor of government at Wesleyan University, Michael M. Franz, professor of government at Bowdoin College and Travis N. Ridout, professor of political science at Washington State University. WMP personnel include Breeze Floyd (Program Manager), Pavel Oleinikov (Associate Director, QAC), Yujin Kim (Post-Doctoral Fellow) and Meiqing Zhang (Post-Doctoral Fellow).
The Wesleyan Media Project’s real-time tracking in 2024 is supported by Wesleyan University and the John S. and James L. Knight Foundation. The Wesleyan Media Project is partnering again this year with OpenSecrets, to provide added information on outside group disclosure and candidate status.
The Wesleyan Media Project’s digital advertising tracking is supported by the contributions of students in Delta Lab, an interdisciplinary research collaborative focusing on computationally-driven and innovative analyses and visualizations of media messaging. We are also grateful to our Coding Supervisors Akhil Joondeph, Cecilia Smith, Saul Ferholt-Kahn, and Emmett Perry.
Periodic releases of data will be posted on the project’s website and dispersed via LinkedIn, Bluesky @wesmediaproject.bsky.social and Twitter @wesmediaproject. To be added to our email update list, click here.
For more information contact: media@wesleyan.edu.
About Wesleyan University
Wesleyan University, in Middletown, Conn., is known for the excellence of its academic and co-curricular programs. With more than 2,900 undergraduates and 200 graduate students, Wesleyan is dedicated to providing a liberal arts education characterized by boldness, rigor and practical idealism. For more, visit www.wesleyan.edu.
About the John S. and James L. Knight Foundation
We are social investors who support democracy by funding free expression and journalism, arts and culture in community, research in areas of media and democracy, and in the success of American cities and towns where the Knight brothers once had newspapers. Learn more at kf.org and follow @knightfdn on social media.


