Photo Gage Skidmore/flickr
Harris Campaign Outspending Trump on Meta 16:1 and on Google by Nearly 3:1
(MIDDLETOWN, CT) September 26, 2024 – According to a new analysis from the Wesleyan Media Project that focuses on ad spending over the last two weeks, Vice President Kamala Harris maintains a significant advertising advantage over Donald Trump thanks largely to a decline in pro-Trump advertising on television in the past 2 weeks. On broadcast stations across the country, pro-Harris forces have spent nearly $73 million on 73,000 ad spots. Pro-Trump forces have spent just under $45 million on 52,000 ad airings. Harris also maintains a huge ad advantage – one that has grown – on digital advertising as well, which we discuss further in the report.
For broadcast TV ads, Harris has received support from FF PAC in coordination with LCV Victory Fund, Climate Power Action, and Somos PAC to the tune of $19 million, totaling over 12,000 ad airings, about 16 percent of all pro-Harris ads in the period between September 9 and 22. The Trump campaign has also sponsored the bulk of ads promoting his campaign over the last two weeks, but Make America Great Again and Preserve America PAC have sponsored 10,000 spots at a cost of $18 million.
Table 1: Broadcast Ad Spending in Presidential Race by Top Sponsors (September 9 to 22)
| Party lean | Ad airings | Est Cost (in $Ms) | |
|---|---|---|---|
| Harris, Kamala | DEM | 56,057 | 41.34 |
| FF PAC (W/LCV Victory Fund & Climate Power Action) | DEM | 11,169 | 16.98 |
| Project Freedom LLC | DEM | 2,392 | 5.12 |
| Republican Accountability PAC | DEM | 1,225 | 2.79 |
| Somos PAC & FF PAC | DEM | 1,204 | 1.99 |
| Trump, Donald | REP | 41,180 | 19.4 |
| Make America Great Again Inc. | REP | 6,216 | 10.37 |
| Preserve America PAC | REP | 3,884 | 7.7 |
| Right For America | REP | 1,074 | 5.04 |
| All Pro-Harris | 72,884 | 72.98 | |
| All Pro-Trump | 52,471 | 44.67 | |
| Figures are from September 9 to 22, 2024. Numbers include broadcast television for all sponsors. CITE SOURCE OF DATA AS: Vivvix CMAG with analysis by the Wesleyan Media Project. |
|||
Trump and Supportive Groups Scale Back TV Ads in Past Two Weeks
Figure 1, which depicts the number of pro-Harris and pro-Trump ads on broadcast TV each day, reveals that Harris’ ad advantage has come from the past few weeks, when pro-Harris ad airings have consistently numbered over 6,000 nearly every weekday. By contrast, pro-Trump airings have dropped to about 4,000 each weekday–down from 6,000 each weekday in the prior weeks. Ads favoring both campaigns drop substantially on weekends.
Figure 1: Volume of Pro-Harris and Pro-Trump Ad Airings by Day
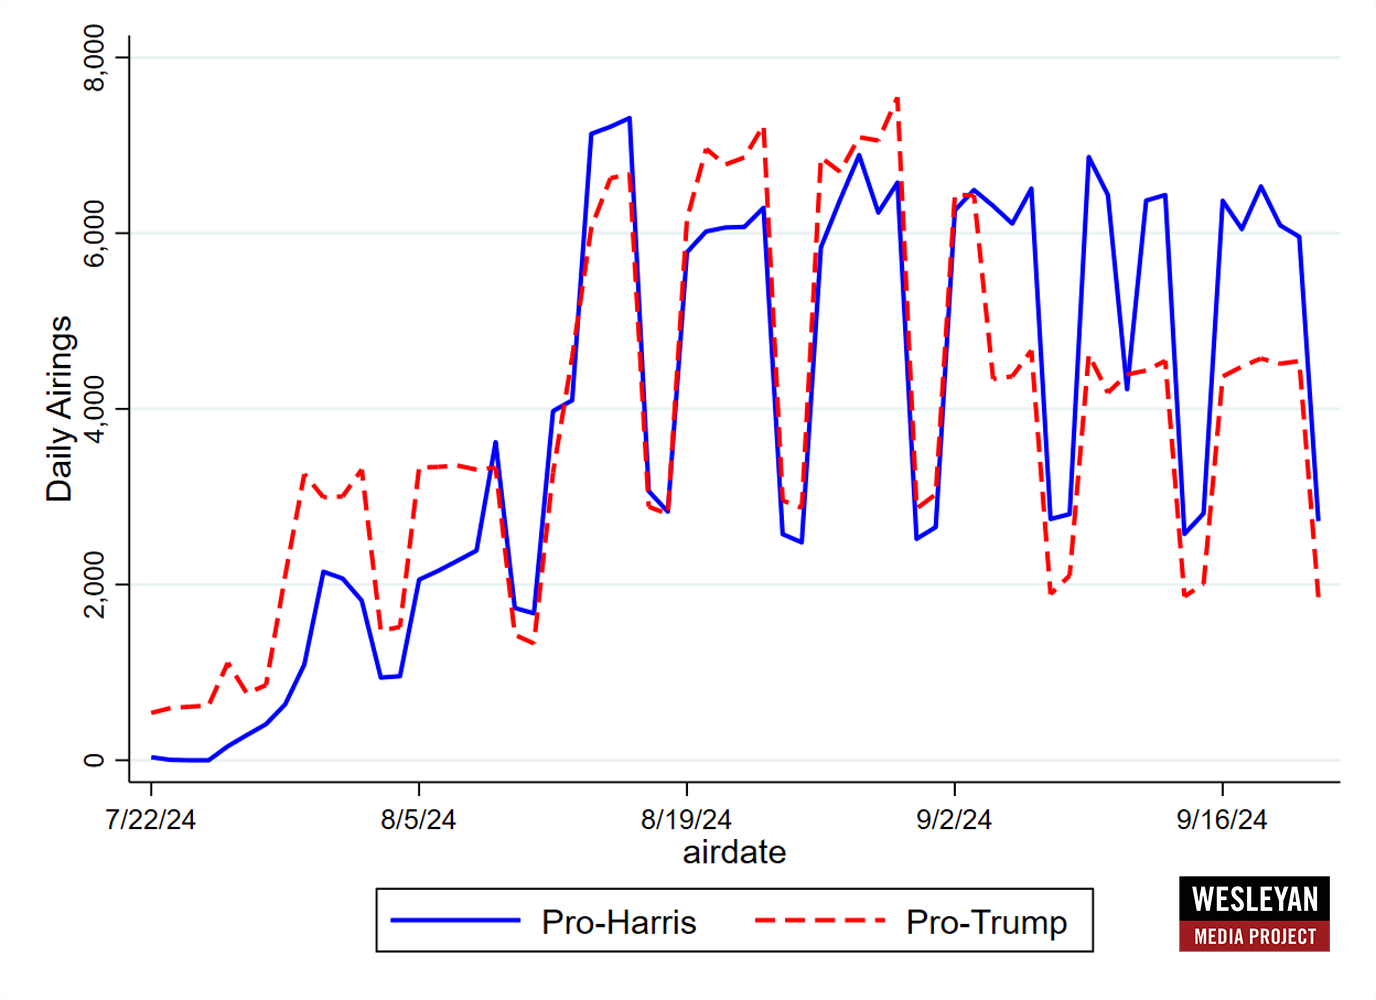
Numbers include broadcast television for all sponsors.
CITE SOURCE OF DATA AS: Vivvix CMAG with analysis by the Wesleyan Media Project.
Harris Dominating Local Cable, National Cable and Radio Advertising
Even if we consider spending beyond broadcast ads, Harris and allies have heavily out-spent Trump and his supporters in the past two weeks. Table 2 reports on all sponsors in the presidential race who have spent money on broadcast ads, local and national cable, radio, or satellite television. Harris and her supporters have spent nearly $97 million in the past two weeks. Trump and allies have spent about $55 million. Harris is out-spending Trump on local and national cable nearly 4:1, and Harris has spent over $4 million on radio ads in the last two weeks, while Trump has spent $0. On the other hand, Trump has spent nearly $2 million for ads on satellite television, but Harris has not spent any on that medium.
By and large, the bulk of ad spending on television and radio in the last two weeks has been on local broadcast stations.
Table 2: All TV and Radio Ad Spending in Presidential Race by Sponsor (September 9 to 22)
| Party lean | Total TV/Radio Ad spending (in $Ms) | Local cable (in $Ms) | Nat’l cable (in $Ms) | Radio (AM/FM) (in $Ms) | Satellite TV (in $Ms) |
|
|---|---|---|---|---|---|---|
| Harris, Kamala | DEM | 57.772 | 12.2 | 4.807 | 4.243 | |
| FF PAC | DEM | 11.787 | 1.75 | 0.09 | 0.346 | |
| FF PAC w/ Climate Power Action & LCV Victory Fund | DEM | 6.711 | 1.066 | 0.22 | ||
| Project Freedom LLC | DEM | 6.338 | 1.22 | 0.617 | ||
| AB PAC | DEM | 5.35 | 0.506 | 0.548 | ||
| Republican Accountability PAC | DEM | 3.635 | 0.702 | 0.143 | ||
| Somos PAC & FF PAC | DEM | 2.183 | 0.048 | 0.145 | ||
| FF PAC w/ Climate Power Action & LCV Victory Fund & EDF Action Votes | DEM | 1.979 | 0.336 | 0.045 | ||
| Democracyfirst | DEM | 0.678 | 0.158 | 0.049 | ||
| Fair Future NC | DEM | 0.066 | 0.066 | |||
| American Fed. Of Teachers Solidarity Fund | DEM | 0.043 | 0.043 | |||
| Anti-Psychopath PAC Inc. | DEM | 0.029 | 0.029 | |||
| Black PAC | DEM | 0.016 | 0.016 | |||
| People For The American Way | DEM | 0.003 | 0.003 | |||
| Trump, Donald | REP | 25.182 | 3.481 | 1.091 | 1.849 | |
| Make America Great Again Inc. | REP | 11.17 | 0.74 | 0.18 | 0.064 | |
| Preserve America PAC | REP | 8.766 | 0.87 | 0.11 | 0.192 | |
| Right For America | REP | 7.065 | 1.265 | 0.762 | ||
| Restoration PAC | REP | 1.78 | 1.15 | |||
| AFP Action | REP | 0.489 | ||||
| Dan Newlin Injury Attorneys | REP | 0.31 | 0.08 | |||
| Americas PAC | REP | 0.24 | 0.24 | |||
| Protecting America Initiative | REP | 0.134 | 0.061 | |||
| RJC Victory Fund | REP | 0.093 | 0.031 | |||
| Article III Foundation | REP | 0.09 | 0.077 | 0.012 | ||
| Fair Election Fund | REP | 0.059 | 0.059 | |||
| Turning Point PAC | REP | 0.024 | 0.024 | |||
| Stop The Madness Az | REP | 0.02 | ||||
| Americans For Constitutional Liberty | REP | 0.015 | 0.015 | |||
| We Must Unite | REP | 0.001 | 0.001 | |||
| Figures are from September 9 to 22, 2024. Total column includes spending for local broadcast TV airings and national network airings in addition to cable, radio, and satellite. CITE SOURCE OF DATA AS: Vivvix CMAG with analysis by the Wesleyan Media Project. |
||||||
Harris Dominating Digital Platforms, Particularly Facebook and Instagram
Turning to the online environment, the Harris campaign (including spending by her joint fundraising committee) had enormous leads in spending over Trump by a factor of 5:1 in the past two weeks. On Meta properties, which include both Facebook and Instagram, Harris’ advantage is particularly strong: Harris has spent $22.8 million to Trump’s $1.4 million over the past two weeks. The Trump campaign (and his joint fundraising committee) has spent more on Google properties to the tune of $6.5 million, but it also pales in comparison to the $17.3 million that the Harris campaign has spent over that same time period.
“Although Harris is sweeping the board in terms of advertising everywhere, her advantage online over the past two weeks is truly stunning,” said Erika Franklin Fowler, co-director of the Wesleyan Media Project. “She has more than doubled her spending on Meta and Google properties from $18.7M in our last analysis to $40.1M, and is crushing Trump—the candidate who devoted half of his advertising budget in the 2016 race to digital—in spending overall with enormous margins on Facebook and Instagram in particular.”
Table 3: Digital Advertising Spending by the Presidential Campaigns (Past Two Weeks)
| Harris | 22.8 | 17.3 | 40.1 |
| Trump | 1.4 | 6.5 | 7.9 |
| Figures are from September 9 (for Meta, which includes Facebook and Instagram) and September 8 (for Google, which includes search advertising, YouTube, and third-party advertising) to September 21, 2024. Numbers for campaigns include joint fundraising committee advertising. National party spending is excluded if it occurs only on the national party pages and/or does not contain any reference to a presidential sponsor in the disclaimer. CITE SOURCE OF DATA AS: Meta Ad Library and Google Transparency Report with analysis by the Wesleyan Media Project. |
|||
Viewers Seeing More Pro-Harris Ads in Most Media Markets
In contrast to our analysis two weeks ago in which Trump ads were more common in many Sunbelt media markets, pro-Harris advertising on broadcast TV is now more common in almost all media markets across the country, as Figure 2 and Table 4 shows. The only exceptions to this rule are Erie, Pennsylvania, a few small Michigan markets (Lansing, Marquette and Traverse City) and a few markets in the South: Augusta, GA; Greensboro, NC; Greenville, NC; Greenville, SC (which reaches a few counties in Georgia and North Carolina); Wilmington, NC; and Tallahassee (which reaches some counties in Georgia).
Pro-Harris advertisers have also been on the air in the past two weeks in several markets where there is no pro-Trump advertising. These markets include South Bend, Indiana; Youngstown, Ohio; Myrtle Beach, South Carolina; Toledo, Ohio; Duluth, Minnesota; Minneapolis, Minnesota and Yuma, Arizona.
“Political advertising seldom makes a huge difference in a presidential race, but the potential for advertising to persuade increases when one side is on the air and the other is not,” said Travis Ridout, co-director of the Wesleyan Media Project.
Table 4: Broadcast Ad Spending in Presidential Race by Market (September 9 to 22)
| Ad airings | Pro-Harris airings | Pro-Trump airings | Dem Adv in airings | Est Cost (in $Ms) | Dem cost (in $Ms) | Rep cost (in $Ms) |
|
|---|---|---|---|---|---|---|---|
| Phoenix | 8,750 | 5,444 | 3,306 | 2,138 | 10.68 | 6.64 | 4.04 |
| Atlanta | 8,351 | 4,899 | 3,452 | 1,447 | 9.72 | 4.86 | 4.85 |
| Philadelphia | 6,288 | 3,971 | 2,317 | 1,654 | 10.41 | 5.75 | 4.66 |
| Las Vegas | 5,816 | 4,263 | 1,553 | 2,710 | 4.41 | 3.5 | 0.91 |
| Grand Rapids | 5,531 | 3,202 | 2,329 | 873 | 4.75 | 2.81 | 1.94 |
| Harrisburg | 4,934 | 3,088 | 1,846 | 1,242 | 5.63 | 3.9 | 1.73 |
| Tucson | 4,822 | 2,737 | 2,085 | 652 | 2.05 | 1.63 | 0.41 |
| Detroit | 4,498 | 2,913 | 1,585 | 1,328 | 9.86 | 4.78 | 5.08 |
| Milwaukee | 4,472 | 2,842 | 1,630 | 1,212 | 5.12 | 2.6 | 2.52 |
| Pittsburgh | 4,418 | 2,673 | 1,745 | 928 | 8.58 | 5.45 | 3.14 |
| Raleigh | 4,376 | 2,843 | 1,533 | 1,310 | 2.17 | 1.26 | 0.91 |
| Charlotte | 4,266 | 2,232 | 2,034 | 198 | 2.49 | 1.22 | 1.27 |
| Green Bay | 4,051 | 2,631 | 1,420 | 1,211 | 3.14 | 1.43 | 1.71 |
| Wilkes Barre | 3,929 | 2,094 | 1,835 | 259 | 4.54 | 2.96 | 1.58 |
| Madison | 3,643 | 2,080 | 1,563 | 517 | 1.94 | 1.14 | 0.8 |
| Johnstown | 3,523 | 1,822 | 1,701 | 121 | 2.2 | 1.41 | 0.79 |
| Savannah | 3,200 | 1,969 | 1,231 | 738 | 1.07 | 0.77 | 0.3 |
| Macon | 2,928 | 1,496 | 1,432 | 64 | 0.6 | 0.42 | 0.18 |
| Columbus, GA | 2,879 | 1,784 | 1,095 | 689 | 0.98 | 0.76 | 0.22 |
| Augusta | 2,827 | 1,394 | 1,433 | -39 | 0.68 | 0.37 | 0.3 |
| Flint | 2,802 | 1,506 | 1,296 | 210 | 1.68 | 0.94 | 0.74 |
| Greensboro | 2,405 | 840 | 1,565 | -725 | 0.59 | 0.28 | 0.31 |
| La Crosse | 2,319 | 1,363 | 956 | 407 | 1.35 | 1.1 | 0.25 |
| Reno | 2,277 | 1,167 | 1,110 | 57 | 1.32 | 1.03 | 0.29 |
| Albany, Ga | 2,263 | 1,281 | 982 | 299 | 0.52 | 0.35 | 0.16 |
| Greenville, SC | 2,125 | 745 | 1,380 | -635 | 0.84 | 0.44 | 0.4 |
| Greenville, NC | 2,117 | 733 | 1,384 | -651 | 0.53 | 0.2 | 0.34 |
| Lansing | 2,095 | 961 | 1,134 | -173 | 1.22 | 0.98 | 0.24 |
| Traverse City | 1,896 | 936 | 960 | -24 | 0.44 | 0.29 | 0.15 |
| Wilmington | 1,832 | 637 | 1,195 | -558 | 0.27 | 0.11 | 0.16 |
| Wausau | 1,794 | 1,050 | 744 | 306 | 1.57 | 1.17 | 0.4 |
| Marquette | 1,339 | 654 | 685 | -31 | 0.24 | 0.12 | 0.12 |
| Erie | 1,134 | 518 | 616 | -98 | 0.53 | 0.34 | 0.19 |
| Tallahassee | 1,021 | 85 | 919 | -834 | 0.13 | 0.02 | 0.11 |
| Omaha | 843 | 843 | 0 | 843 | 0.29 | 0.29 | |
| National Cable | 687 | 582 | 105 | 477 | 8.31 | 5.78 | 2.53 |
| Alpena | 615 | 310 | 305 | 5 | 0.29 | 0.16 | 0.12 |
| South Bend | 298 | 298 | 0 | 298 | 0.06 | 0.06 | |
| Youngstown | 297 | 297 | 0 | 297 | 0.08 | 0.08 | |
| Myrtle Beach | 274 | 274 | 0 | 274 | 0.06 | 0.06 | |
| Toledo | 225 | 225 | 0 | 225 | 0.09 | 0.09 | |
| Duluth | 223 | 223 | 0 | 223 | 0.06 | 0.06 | |
| Minneapolis | 170 | 170 | 0 | 170 | 0.24 | 0.24 | |
| National Network | 123 | 116 | 7 | 109 | 5.86 | 5.09 | 0.76 |
| Yuma-El Centro | 108 | 108 | 0 | 108 | 0.03 | 0.03 |
Figures are from September 9 to 22, 2024.
Numbers include broadcast television for all sponsors.
CITE SOURCE OF DATA AS: Vivvix CMAG with analysis by the Wesleyan Media Project.
Figure 2: Party Ad Advantage by Media Market in Presidential Race
Figures are from July 22, 2024 to September 22, 2024 and September 9, 2024 to September 22, 2024.
Numbers include broadcast television for all sponsors.
CITE SOURCE OF DATA AS: Vivvix CMAG with analysis by the Wesleyan Media Project.
Broadcast Ads Drop below 2020 Levels
Broadcast ads in 2024, however, are not keeping pace with the number of ads in 2020, as Figure 3 shows. Before President Biden dropped out in July, ad totals were significantly lower than the comparable period in 2020. In the aftermath of Biden’s departure from the race, however, ad totals jumped significantly, vastly out-pacing weekly airings in August 2020. Since the end of August, though, airings have dropped, a contrast with the significant acceleration in 2020.
“With a reboot of sorts of the general election in late July, the blitz of ads in August makes sense,” said Michael Franz, co-director of the Wesleyan Media Project. “2024 has a different dynamic than 2020. Still, as we move into the final six weeks of the campaign, we expect significant amounts of advertising from both campaigns.”
Figure 3: Volume of Presidential Ads by Week in 2020 and 2024
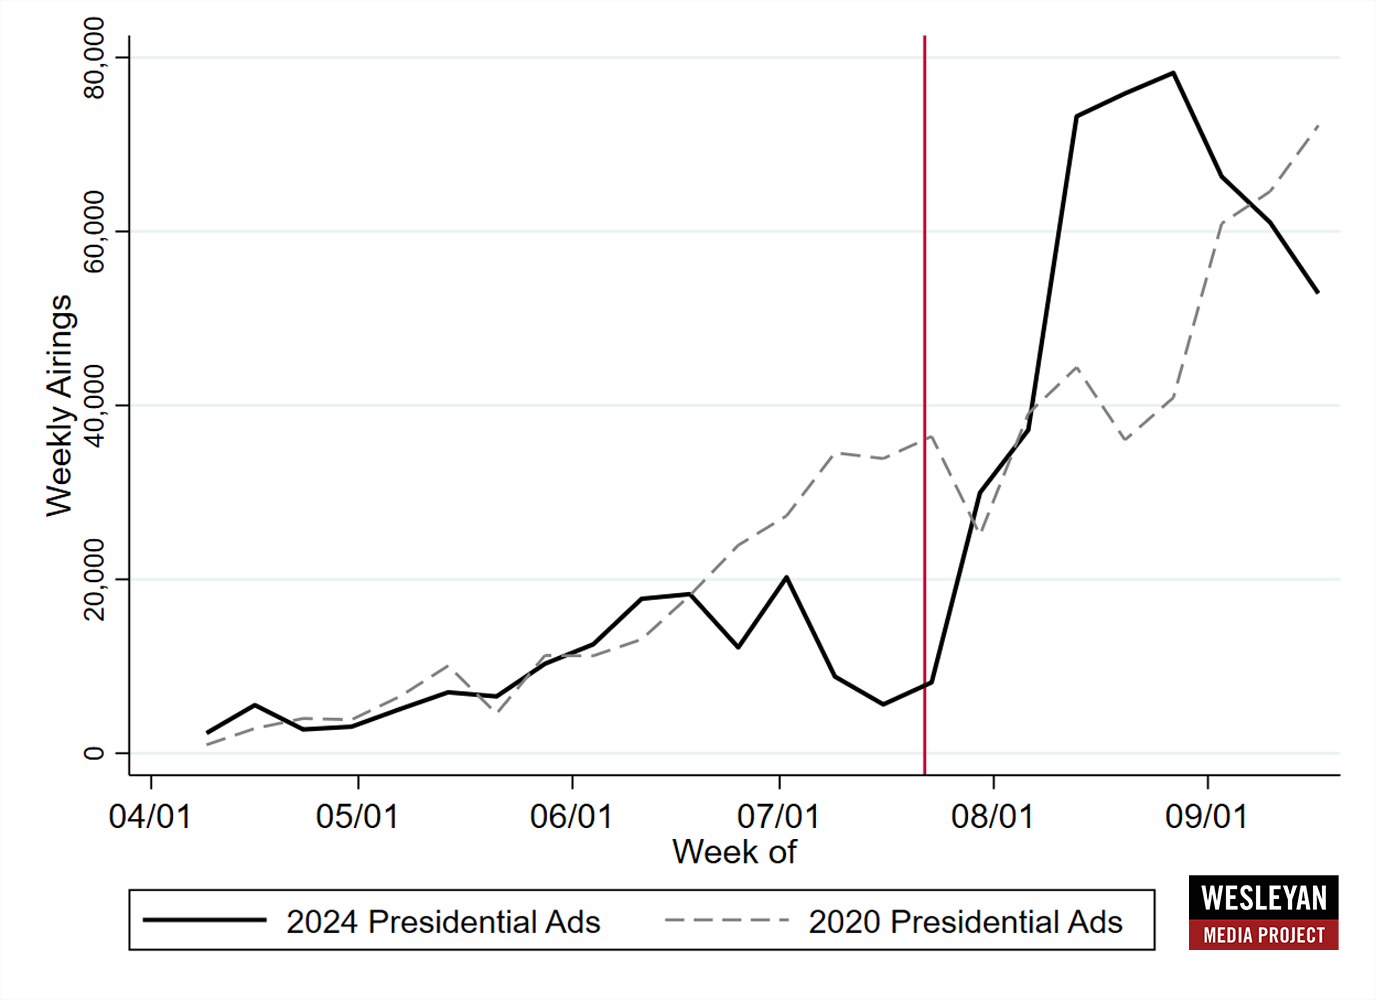
Numbers include broadcast television for all sponsors.
CITE SOURCE OF DATA AS: Vivvix CMAG with analysis by the Wesleyan Media Project.
Trump, Harris Ads Both Focus on Economy, Inflation
Table 5 shows the top issues mentioned by various ad sponsors in the presidential race over the past two weeks, focusing on broadcast TV spots. Top issues for the Harris campaign are inflation, the economy and taxes, an agenda that is similar to the Trump campaign’s, which is also focused on inflation and the economy to an even larger degree. FF PAC, a large super PAC on the Democratic side, is echoing this agenda. Groups supporting Trump, however, are departing from this issue agenda, with MAGA, Inc. and Preserve America PAC both focused on public safety, though their ad totals are much lower than what we have seen in previous reports.
All told, viewers are seeing a campaign that is now significantly focused on issues related to the economy.
Table 5: Top Issues by Sponsor in Presidential Race (September 9 to 22)
| % of airings | % of airings |
|||||
|---|---|---|---|---|---|---|
| Kamala Harris | Inflation | 45.3% | Donald Trump | Economy | 89.5% | |
| (56,057 airings) | Economy | 45.3% | (41,180 airings) | Inflation | 89.5% | |
| Taxes | 45.3% | Housing | 85.8% | |||
| Abortion | 38.4% | Energy policy | 51.6% | |||
| Women's Rights | 38.2% | Oil/gas prices | 46.2% | |||
| Prescription drugs | 38.0% | Jobs | 24.9% | |||
| Housing | 36.6% | |||||
| Supreme Court | 32.5% | |||||
| Birth control | 23.1% | |||||
| Manufacturing | 14.5% | |||||
| FF PAC | Taxes | 99.4% | Make America Great Again | Public safety | 100.0% | |
| (5,924 airings) | Inflation | 28.3% | (6,216 airings) | Drug problems | 58.9% | |
| Economy | 28.3% | Immigration | 58.9% | |||
| Jobs | 58.9% | |||||
| Budget | 41.1% | |||||
| LCV Victory Fund and FF PAC | Energy policy | 100.0% | Preserve America PAC | Public Safety | 100.0% | |
| (2,643 airings) | Prescription drugs | 100.0% | (3,884 airings) | Immigration | 50.5% | |
| Taxes | 100.0% | Budget | 49.5% | |||
| Inflation | 100.0% | Guns | 18.0% | |||
| Economy | 100.0% | |||||
| Utility Rates | 89.9% | |||||
| Green energy | 89.9% | |||||
| Oil/gas prices | 10.1% | |||||
| Climate Power Action and FF PAC | Energy policy | 100.0% | ||||
| (2,602 airings) | Economy | 100.0% | ||||
| Inflation | 100.0% | |||||
| Prescription drugs | 100.0% | |||||
| Taxes | 100.0% | |||||
| Green energy | 64.8% | |||||
| Utility rates | 64.8% | |||||
| Oil/gas | 35.2% | |||||
| Figures are from September 9 to 22, 2024. CITE SOURCE OF DATA AS: Vivvix CMAG with analysis by the Wesleyan Media Project. |
||||||
Figure 4 looks at the volume and tone of presidential ads on broadcast stations since April of this year. Donald Trump continues to avoid promotional spots that advocate primarily for his own election, in favor of a mix of attacks on Harris and ads that contrast himself and Harris. In the most recent week, he has aired more attack ads than in the prior week, though contrast ads constitute a higher share of his ad volume than in August.
Vice President Harris has tended to air a mix of attack, contrast, and promotional ads since the launch of her campaign in July. Attacks on Trump have constituted about 1 in 4 of her spots in the last month. Contrasts between her and Trump account for the plurality of her ads.
Figure 4: Volume and Tone of Presidential Ads by Week (April 9 to September 22)
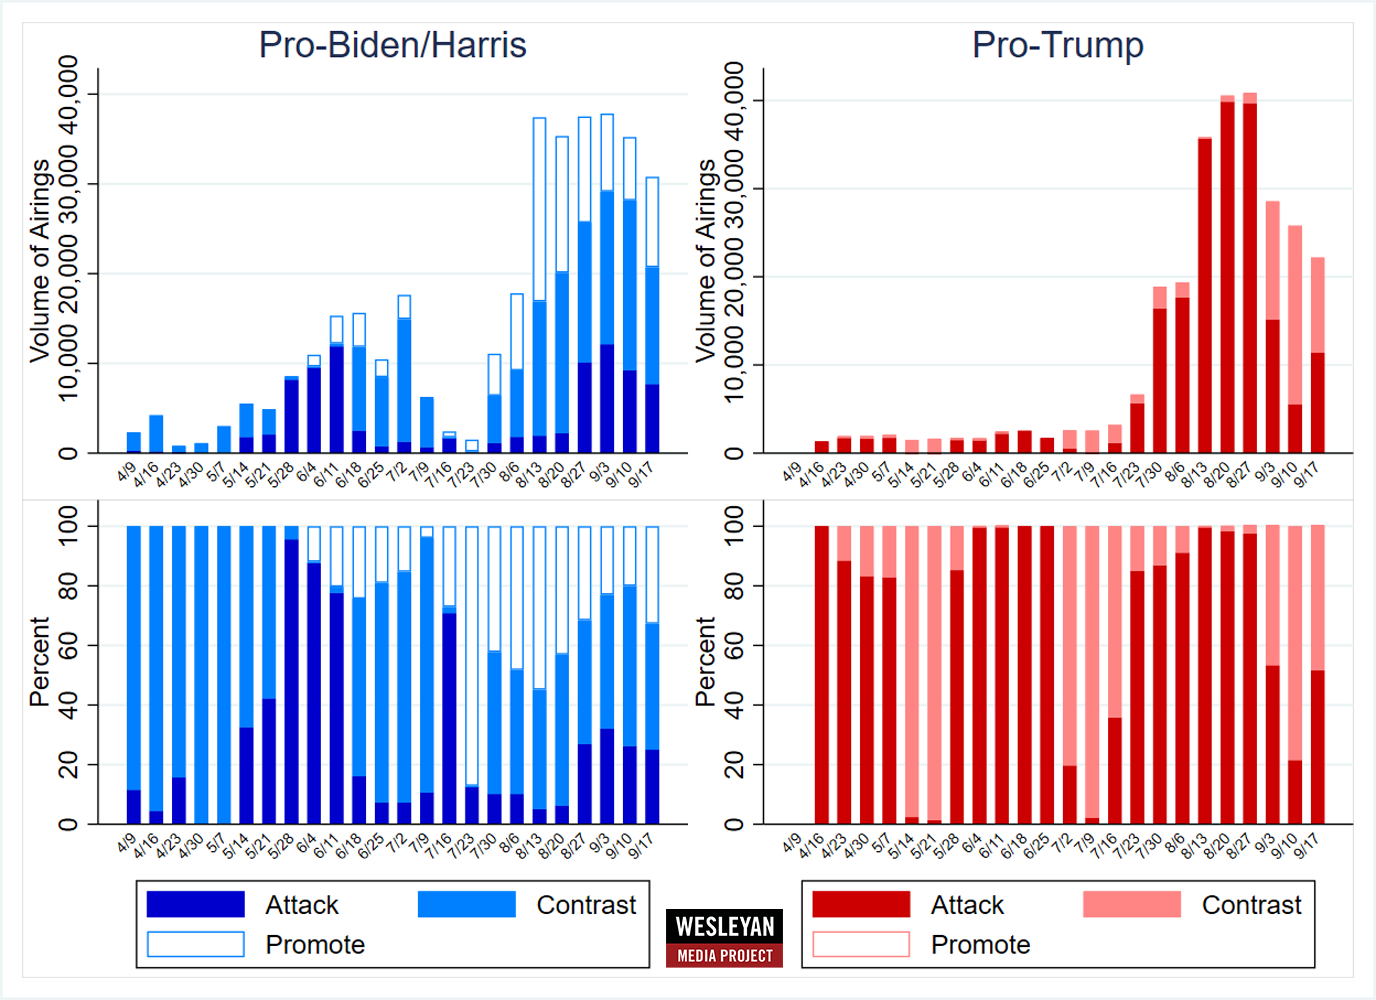
Numbers include broadcast television for all sponsors.
CITE SOURCE OF DATA AS: Vivvix CMAG with analysis by the Wesleyan Media Project.
Montana and Ohio Top the List in Ad Airings for Senate Races
The Senate races in Montana and Ohio, two races seen by many as key to control of the chamber, have seen the most ad airings over the past two weeks, with over 36,000 airings in Montana and over 34,000 airings in Ohio. Democrats hold a small ad advantage in Montana, while Republicans hold a similar advantage in Ohio. In terms of spending over the past two weeks, Ohio is on top with about $37 million, followed by Pennsylvania and then Montana. Democrats hold an ad advantage in most of the top Senate races, with Ohio and Pennsylvania being exceptions.
In all three of the top races by ad volume, the vast majority of the pro-Republican ad airings have been sponsored by groups. In Montana, Senate Leadership Fund and American Crossroads have aired a total of 10,000 spots advocating for Tim Sheehy, while Sheehy and the National Republican Senatorial Campaign Committee have aired about 6,200. In Ohio, Senate Leadership Fund and Defend American Jobs have each aired over 6,000 spots in the past two weeks advocating for the Republican nominee, Bernie Moreno, while Moreno in coordination with the Republican Party has sponsored only 3,300 spots. In Pennsylvania, Senate Leadership Fund and Keystone Renewal PAC have combined to air 7,500 spots on behalf of the Republican candidate, Dave McCormick, while McCormick (with party support) has sponsored just 2,500 spots in the past two weeks.
Democrats, too, are getting substantial support from outside groups in these races, though in each the candidate and the Democratic Party have sponsored the majority of the ad airings in the last two weeks. Top spending pro-Democratic groups in these races include Last Best Place PAC (5,600 spots in MT) and WinSenate (7,000 spots in Ohio and 3,000 in PA).
Table 6: Volume of Ad Airings and Spending in Senate Races (September 9 to 22)
| State | Airings | Est Cost (in $Ms) | Pro-Dem airings | Pro-GOP airings | Dem airing adv. | % D airings from groups | % R airings from groups |
|---|---|---|---|---|---|---|---|
| MT | 36,440 | 19.84 | 19,465 | 16,975 | 2,490 | 38.3% | 62.8% |
| OH | 34,298 | 36.83 | 15,382 | 18,916 | -3,534 | 45.1% | 82.6% |
| PA | 17,017 | 25.07 | 6,922 | 10,095 | -3,173 | 43.9% | 74.8% |
| TX | 13,474 | 10.49 | 10,029 | 3,445 | 6,584 | 0.0% | 17.0% |
| MI | 12,422 | 17.91 | 8,895 | 3,527 | 5,368 | 23.5% | 22.3% |
| WI | 12,282 | 9.04 | 6,944 | 5,338 | 1,606 | 17.4% | 16.8% |
| AZ | 10,171 | 12.54 | 7,661 | 2,510 | 5,151 | 52.7% | 57.1% |
| NV | 5,590 | 8.61 | 3,656 | 1,934 | 1,722 | 48.7% | 4.4% |
| MD | 5,542 | 5.15 | 4,725 | 817 | 3,908 | 27.2% | 0.0% |
| MO | 3,440 | 2.45 | 1,897 | 1,543 | 354 | 0.0% | 16.6% |
| NE | 2,991 | 0.9 | 0 | 1,939 | -1,939 | 9.7% | |
| NM | 2,943 | 0.78 | 1,678 | 1,265 | 413 | 0.0% | 0.0% |
| FL | 2,582 | 3.47 | 1,252 | 1,330 | -78 | 0.0% | 89.2% |
| RI | 536 | 0.24 | 536 | 0 | 536 | 0.0% | |
| ND | 534 | 0.13 | 534 | 0 | 534 | 0.0% | |
| MN | 524 | 0.19 | 524 | 0 | 524 | 0.0% | |
| ME* | 505 | 0.25 | 0 | 0 | 0 | ||
| MA | 185 | 0.33 | 0 | 185 | -185 | 100.0% | |
| TN | 34 | 0.11 | 0 | 34 | -34 | 0.0% | |
| VA | 13 | 0.01 | 0 | 13 | -13 | 0.0% | |
| Figures are from September 9 to 22, 2024. *All ads aired have been from the Independent candidate. CITE SOURCE OF DATA AS: Vivvix CMAG with analysis by the Wesleyan Media Project. |
|||||||
The tone of ads in Senate races has been slightly more negative (defined as ads pure attack) this cycle in comparison to the past cycles, as we show in Figure 5 (left panel). Attack ads in the cycle-to-date account for about 40 percent of ad airings, which out-paces attacks in the previous three elections back to 2018. In terms of the comparable period in September of prior cycles (the right panel), 2024 is more negative than all prior cycles back to 2012. Sixty percent of Senate ad airings are coded as attacks on the opposition. Only about 1 in 4 airings in the past three weeks was positive.
Figure 5: Tone of Senate Races by Year (Full Cycle and Past Three Weeks)
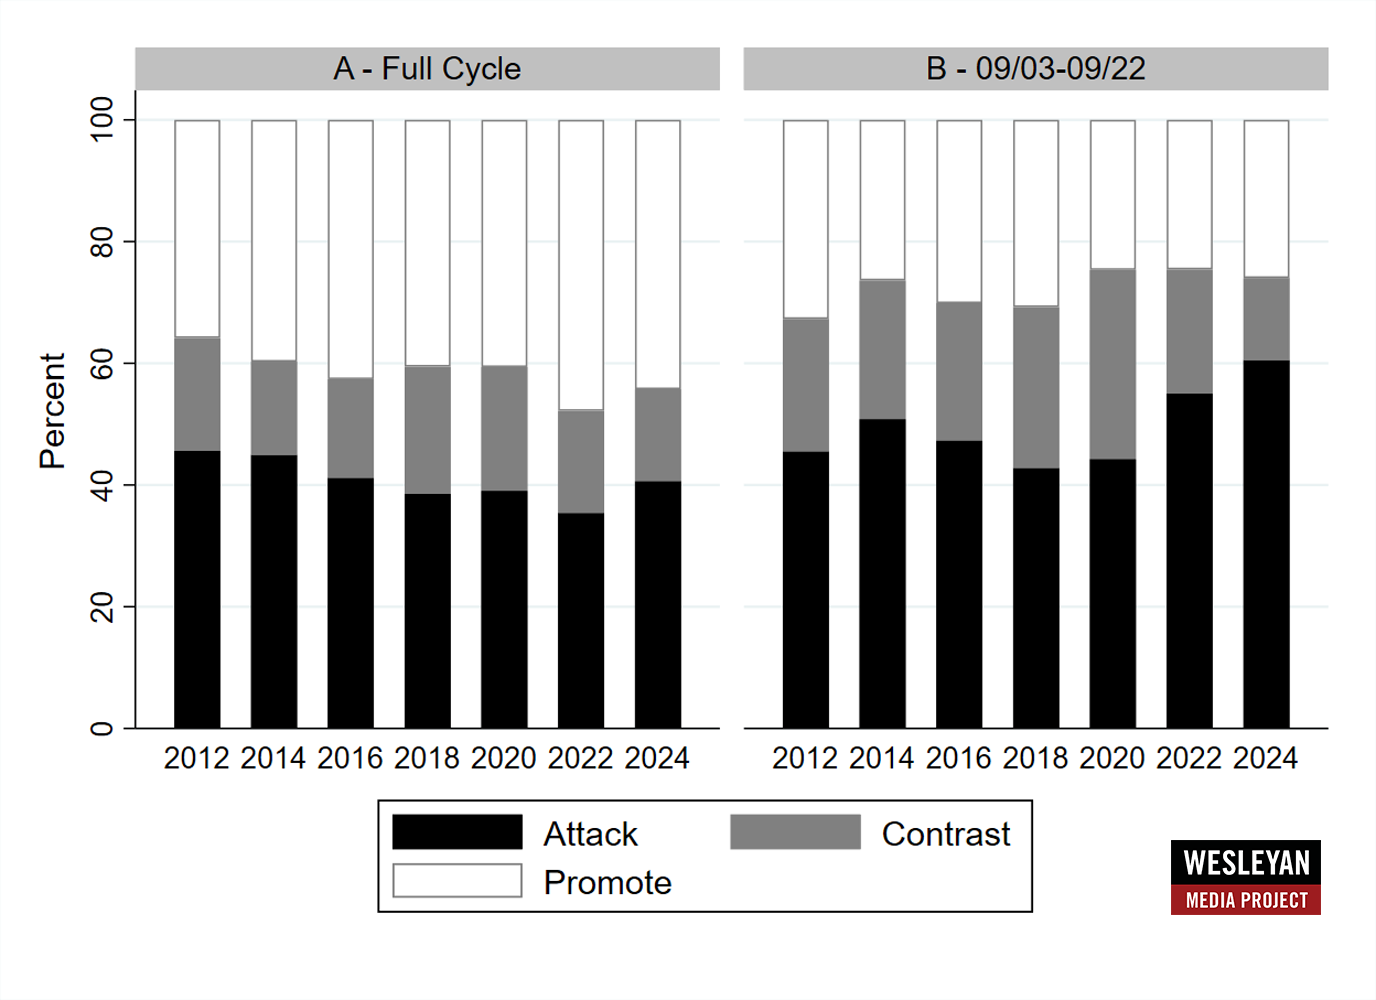
Full-cycle numbers include ads aired between January 1 of the off year and September 22 of the election year.
Numbers include broadcast television for all sponsors.
CITE SOURCE OF DATA AS: Vivvix CMAG with analysis by the Wesleyan Media Project.
Moreover, the volume of ads in Senate races this cycle has out-paced the volume in the comparable prior cycles when the same Senate seats were contested (2012 and 2018), especially in the last number of weeks (Figure 6).
Figure 6: Volume of Senate Ads by Week (2012, 2018, 2024)
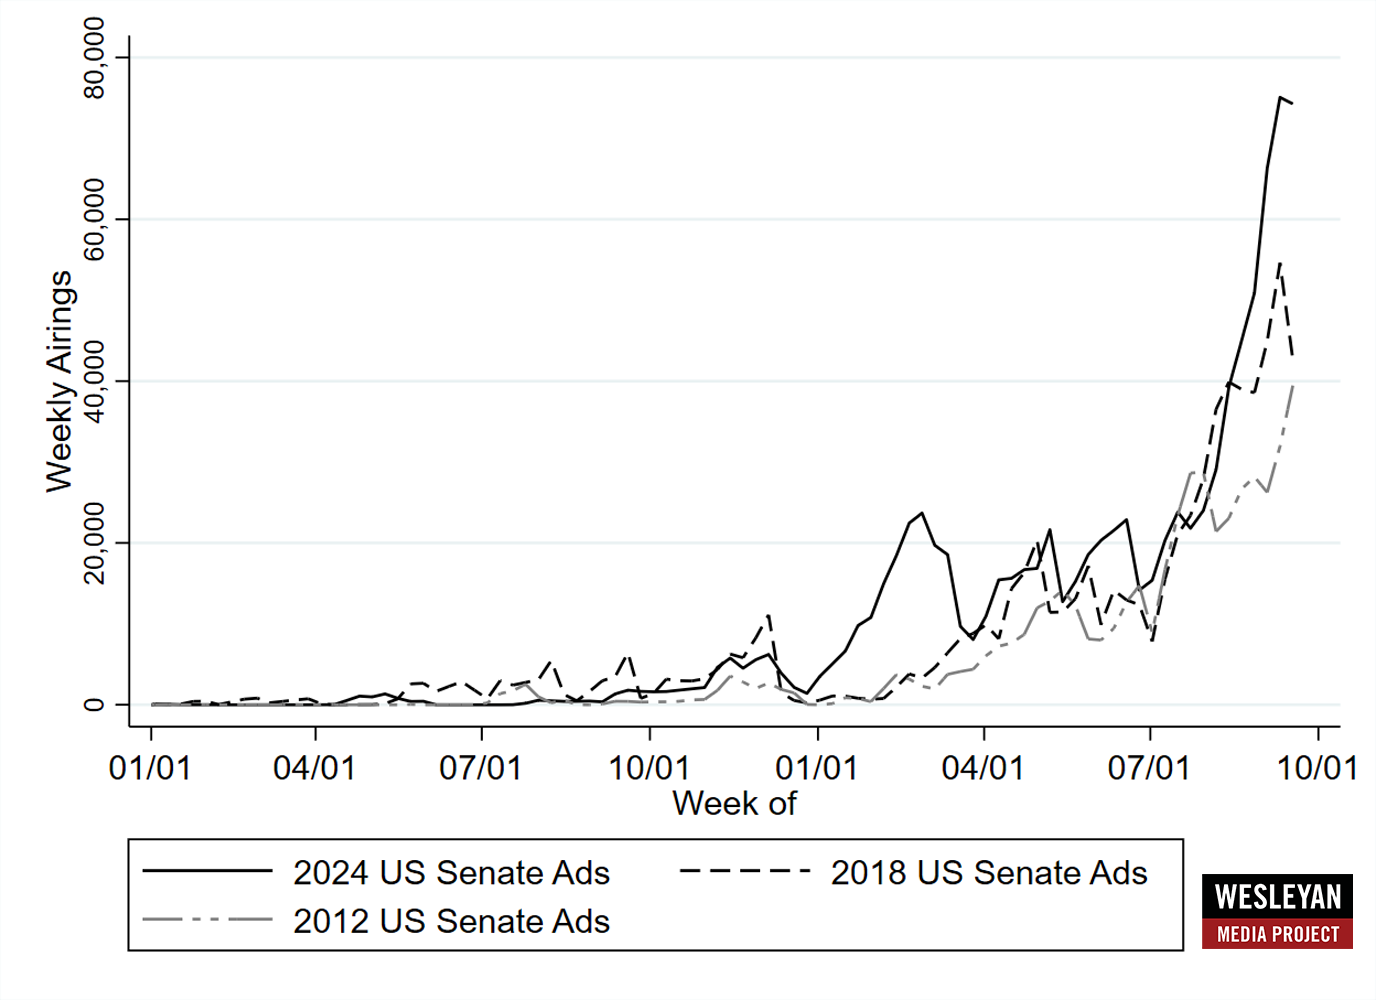
Numbers include broadcast television for all sponsors.
CITE SOURCE OF DATA AS: Vivvix CMAG with analysis by the Wesleyan Media Project.
Democrats Out-Airing GOP in House Races
Table 7 speaks to the number of airings and spending in the top U.S. House races. In almost all of the top races, pro-Democratic ads outnumber pro-Republican ads. The only exception is the race in California’s 22nd congressional district, where Republican David Valadao benefits from more ads than his Democratic opponent, Rudy Salas. Top races in terms of airings are New York’s 19th district, Alaska’s at-large seat, and New Mexico’s second district.
Table 7: Volume of Ad Airings and Spending in Top U.S. House Races (September 9 to 22)
| State | Dist | Airings | Est Cost (in $Ms) | Pro-Dem airings | Pro-GOP airings | Dem airing adv. | % D airings from groups | % R airings from groups |
|---|---|---|---|---|---|---|---|---|
| NY | 19 | 6,285 | 2.51 | 3,172 | 3,113 | 59 | 0.0% | 25.2% |
| AK | 1 | 5,979 | 3.3 | 3,764 | 2,215 | 1,549 | 49.7% | 47.9% |
| NM | 2 | 5,761 | 2.01 | 4,486 | 1,275 | 3,211 | 39.1% | 0.0% |
| ME | 2 | 5,208 | 2.33 | 3,129 | 2,079 | 1,050 | 35.3% | 22.1% |
| OR | 5 | 4,886 | 2.81 | 3,452 | 1,434 | 2,018 | 35.8% | 53.2% |
| CA | 22 | 4,880 | 1.79 | 2,068 | 2,812 | -744 | 75.7% | 30.4% |
| CA | 13 | 4,553 | 1.98 | 3,561 | 992 | 2,569 | 60.2% | 0.0% |
| NC | 1 | 4,096 | 3.11 | 3,709 | 387 | 3,322 | 66.7% | 46.0% |
| MT | 1 | 3,778 | 0.69 | 2,028 | 1,750 | 278 | 0.0% | 0.0% |
| AZ | 6 | 3,745 | 2.13 | 2,469 | 1,276 | 1,193 | 28.7% | 0.0% |
| CO | 3 | 3,393 | 0.6 | 3,113 | 280 | 2,833 | 0.0% | 0.0% |
| IA | 3 | 3,340 | 2.07 | 1,905 | 1,435 | 470 | 21.5% | 60.3% |
| PA | 8 | 3,105 | 2.77 | 2,200 | 905 | 1,295 | 13.6% | 32.7% |
| CA | 41 | 3,018 | 1.15 | 2,302 | 716 | 1,586 | 0.0% | 4.9% |
| CO | 8 | 3,001 | 3.15 | 2,483 | 518 | 1,965 | 63.4% | 73.9% |
| NY | 22 | 2,987 | 0.71 | 1,963 | 1,024 | 939 | 23.2% | 0.0% |
| NE | 2 | 2,871 | 1.78 | 1,617 | 1,254 | 363 | 25.4% | 31.3% |
| WA | 3 | 2,674 | 1.91 | 2,228 | 446 | 1,782 | 28.7% | 0.0% |
| OH | 9 | 2,613 | 1.36 | 1,386 | 1,227 | 159 | 11.2% | 36.3% |
| CA | 49 | 2,552 | 1.03 | 0 | 2,552 | -2,552 | 0.0% | |
| IA | 1 | 2,298 | 0.87 | 1,610 | 688 | 922 | 0.0% | 22.2% |
| CT | 5 | 2,135 | 0.33 | 1,554 | 581 | 973 | 0.0% | 0.0% |
| WI | 3 | 2,082 | 1.12 | 1,272 | 810 | 462 | 0.0% | 0.0% |
| PA | 10 | 1,781 | 1.17 | 1,653 | 128 | 1,525 | 0.0% | 0.0% |
| NY | 17 | 1,742 | 1.89 | 1,482 | 260 | 1,222 | 0.0% | 0.0% |
| MI | 8 | 1,643 | 1.19 | 881 | 762 | 119 | 31.1% | 16.4% |
| KS | 3 | 1,617 | 0.42 | 1,617 | 0 | 1,617 | 0.0% | |
| IL | 17 | 1,613 | 0.42 | 1,305 | 308 | 997 | 0.0% | 0.0% |
| OR | 4 | 1,536 | 0.25 | 1,073 | 463 | 610 | 0.0% | 0.0% |
| VA | 2 | 1,503 | 0.79 | 804 | 699 | 105 | 30.6% | 0.0% |
| MI | 7 | 1,487 | 2.12 | 967 | 520 | 447 | 46.6% | 16.5% |
| CA | 9 | 1,438 | 0.72 | 440 | 998 | -558 | 0.0% | 0.0% |
| OR | 6 | 1,407 | 0.34 | 1,407 | 0 | 1,407 | 0.0% | |
| CA | 3 | 1,322 | 0.65 | 501 | 821 | -320 | 0.0% | 0.0% |
| PA | 7 | 1,155 | 1.12 | 1,155 | 0 | 1,155 | 0.0% | |
| WI | 1 | 1,057 | 0.86 | 466 | 591 | -125 | 0.0% | 0.0% |
| TX | 15 | 1,032 | 0.48 | 362 | 670 | -308 | 0.0% | 0.0% |
| Figures are from September 9 to 22, 2024. CITE SOURCE OF DATA AS: Vivvix CMAG with analysis by the Wesleyan Media Project. |
||||||||
The tone of ads in House races is less negative than in Senate races, as we show in Figure 7. About 1 in 3 ads in the full cycle have been attacks on opponents, and this rate is roughly comparable to 2022 and 2020. In the same three week period over the last three cycles (9/3 to 9/22), the rate of negativity this year is lower than in 2022 and 2020.
Figure 7: Tone of House Ads by Year (Full Cycle and Past Three Weeks)
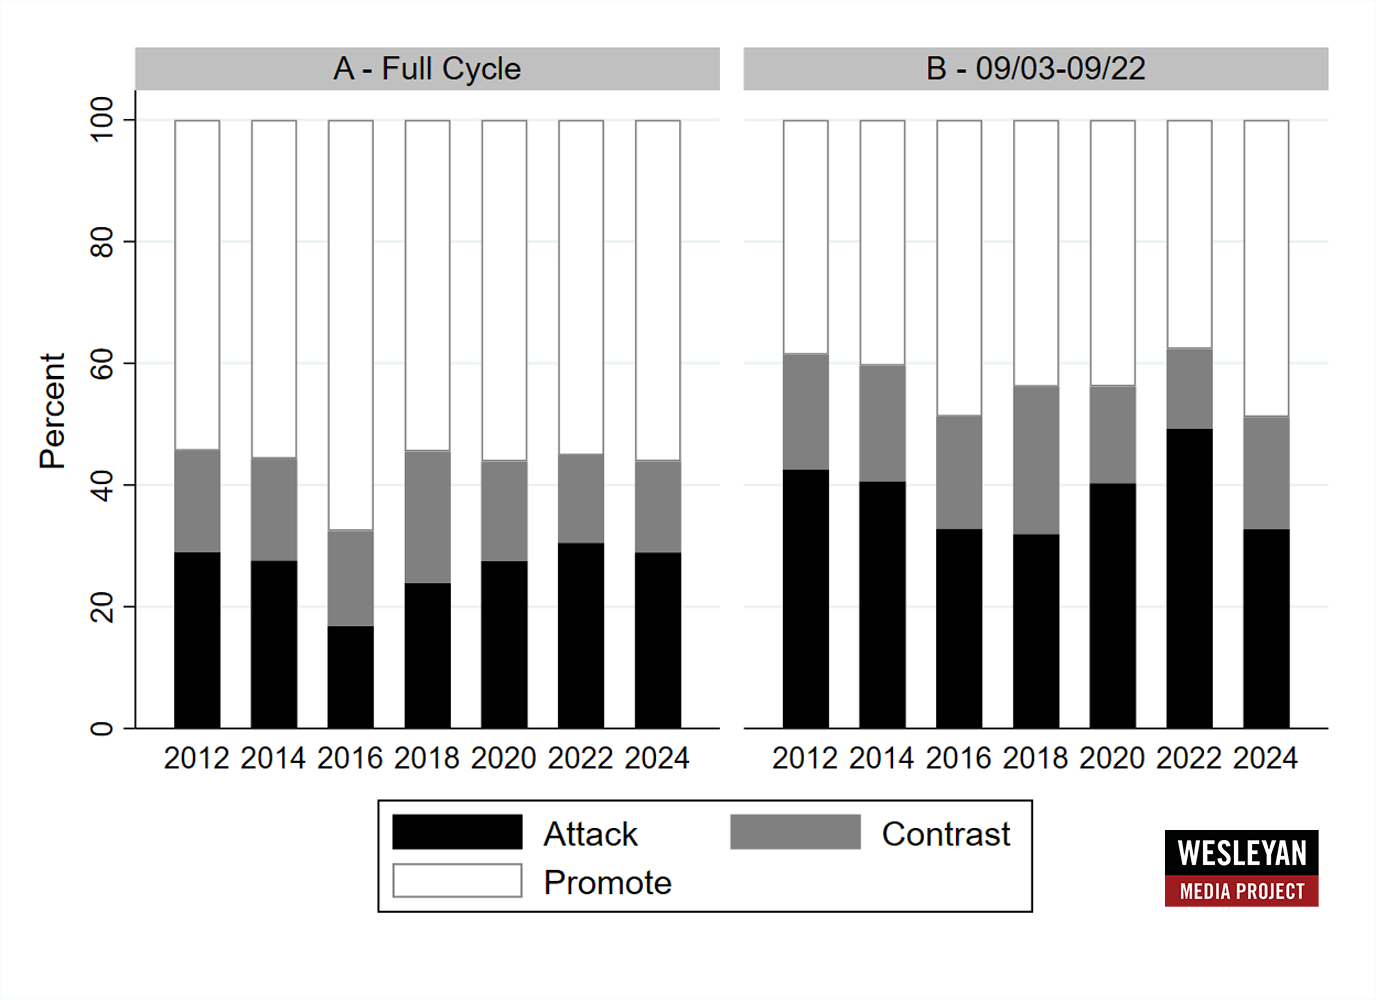
Full-cycle numbers include ads aired between January 1 of the off year and September 22 of the election year.
Numbers include broadcast television for all sponsors.
CITE SOURCE OF DATA AS: Vivvix CMAG with analysis by the Wesleyan Media Project.
Figure 8 shows the volume of House ads by week over the course 2024 and in the previous two election years. Weekly ad totals have jumped in recent weeks at a rate comparable to what was seen in 2020 and 2022.
Figure 8: Volume of House Ads by Week (2020, 2022, and 2024)
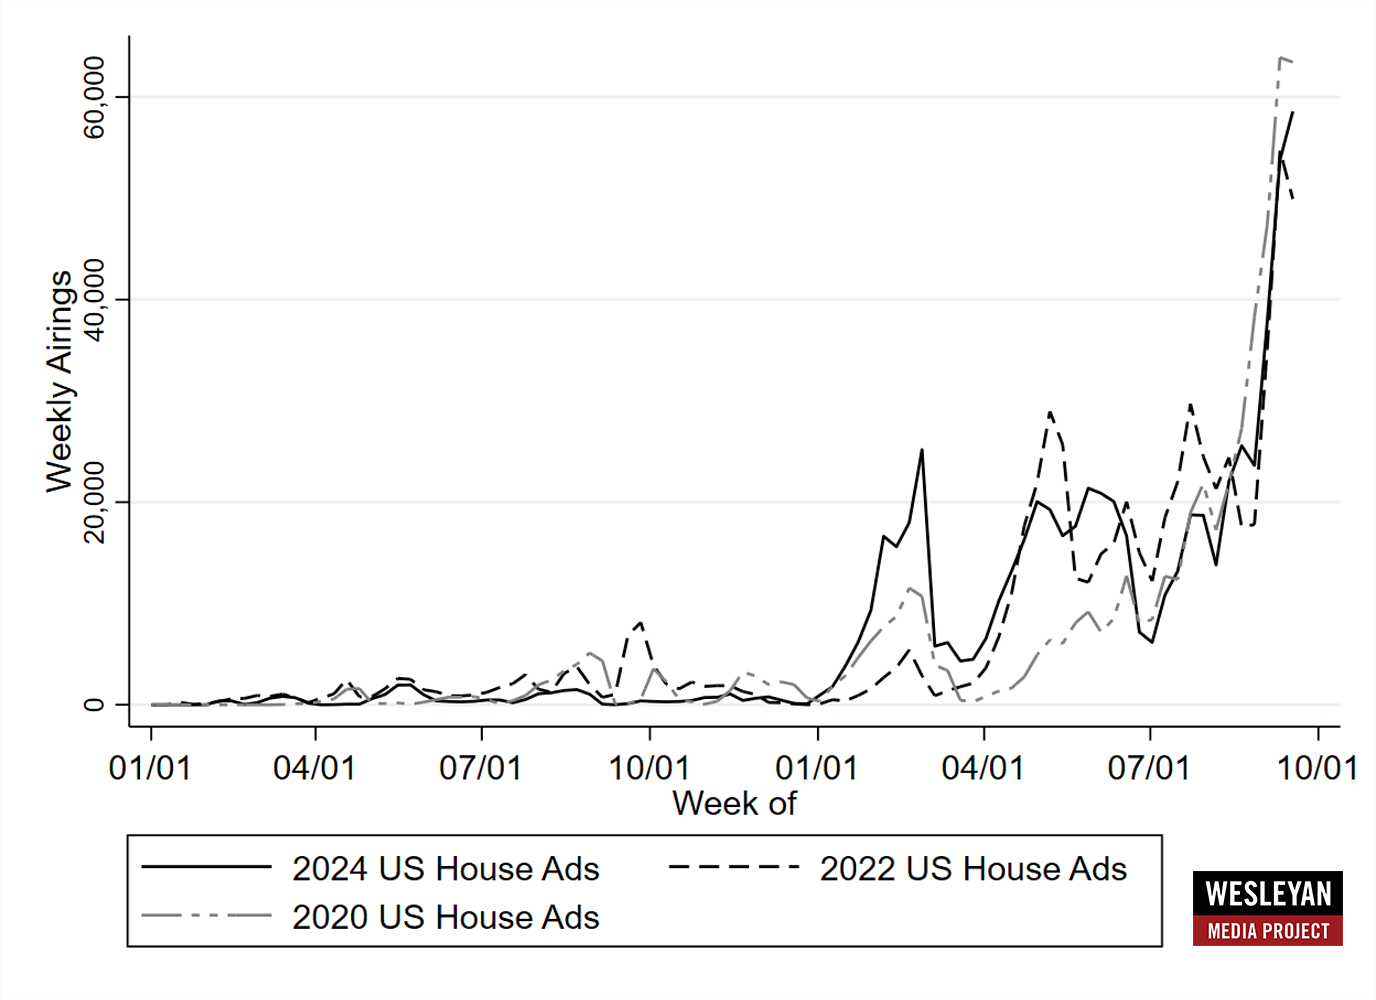
Numbers include broadcast television for all sponsors.
CITE SOURCE OF DATA AS: Vivvix CMAG with analysis by the Wesleyan Media Project.
NC Tops List of Gov Races
Advertising in races for governor has been relatively quiet the past two weeks, as Table 8 shows. The main exception is the race for governor in North Carolina, where ads promoting Democrat Josh Stein have substantially outnumbered those favoring Republican Mark Robinson. In New Hampshire, Republican Kelly Ayotte has an ad advantage over Democrat Joyce Craig. Outside groups have been comparatively less active in these races than in House and Senate campaigns.
Table 8: Volume of Ad Airings and Spending in Gubernatorial Races (September 9 to 22)
| State | Airings | Est Cost (in $Ms) | Pro-Dem airings | Pro-GOP airings | Dem airing adv. | % D airings from groups | % R airings from groups |
|---|---|---|---|---|---|---|---|
| NC | 9,946 | 5.3 | 6,488 | 3,458 | 3,030 | 0.0% | 0.0% |
| NH | 6,407 | 4.27 | 2,948 | 3,459 | -511 | 23.4% | 0.0% |
| IN | 2,326 | 0.51 | 1,465 | 861 | 604 | 0.0% | 0.0% |
| WA | 1,758 | 1.18 | 1,758 | 0 | 1,758 | 40.6% | |
| DE | 348 | 0.21 | 348 | 0 | 348 | 27.6% | |
| Figures are from September 9 to 22, 2024. CITE SOURCE OF DATA AS: Vivvix CMAG with analysis by the Wesleyan Media Project. |
|||||||
About the Data
All television, addressable (which includes satellite and connected TV from LG Ad Sales), and radio data reported here are from Vivvix CMAG. Unless otherwise specified, most advertising references refer to broadcast television. All cost estimates for television are precisely that: estimates.
Meta spending data come from the aggregate reports, which provide spending information for each page name and disclaimer combination. Totals in this report reflect spending between January 1, 2023, July 22, 2024, September 9, 2024 and September 21, 2024. These totals are calculated by subtracting the reported cumulative spending (as reported by Facebook as the total spent since May 2018) for the September 21, 2024 report and subtracting the cumulative spending reported for January 1, 2023, July 21, 2024, and September 9, 2024.
Spending by Biden/Harris includes: spending on the Joe Biden page from Biden Victory Fund, DNC and Biden for President, Biden for President; spending on the Kamala HQ page from Biden Victory Fund and Harris Victory Fund; spending on the Kamala Harris page from Biden Victory Fund, DNC Services Corp., Harris for President and Harris Victory Fund; spending on the Tim Walz page by Harris Victory Fund; Biden for President spending on the Complex and The Daily Scroll pages, and Biden Victory Fund spending on the Democratic Party page. Spending by Trump includes: spending on the Donald J. Trump page by the Trump National Committee JFC, Donald J. Trump for President 2024, Inc., Trump 47 Committee, Inc., and Trump Save America Joint Fundraising Committee; Trump Save America Joint Fundraising Committee on the Team Trump page; Trump National Committee JFC and Trump 47 Committee, Inc. spending on the JD Vance page, and Trump National Committee JFC spending on Lara Trump’s page. Spending by supporting groups for Biden/Harris and Trump are listed in the table notes when they are used.
For Google ads, we downloaded the weekly reports from the platform’s Transparency Report. The totals reflected in this release are from the following time periods: January 1, 2023, or July 21, 2024, September 8, 2024, and September 21, 2024.
Spending by Biden/Harris includes the Biden for President, Harris for President, DNC Services Corp when it appears with Biden or Harris for President, Biden Victory Fund, and Harris Victory Fund advertisers. Spending by Trump includes advertisers Donald J. Trump for President 2024, Inc., Trump Save America Joint Fundraising Committee, and Trump National Committee JFC. Spending by supporting groups for Biden/Harris and Trump are listed in the table notes when they are used.
About this Report
The Wesleyan Media Project provides real-time tracking and analysis of all political television advertising in an effort to increase transparency in elections. Housed in Wesleyan’s Quantitative Analysis Center – part of the Allbritton Center for the Study of Public Life – the Wesleyan Media Project is the successor to the Wisconsin Advertising Project, which disbanded in 2009. It is directed by Erika Franklin Fowler, professor of government at Wesleyan University, Michael M. Franz, professor of government at Bowdoin College and Travis N. Ridout, professor of political science at Washington State University.WMP personnel include Breeze Floyd (Program Manager), Pavel Oleinikov (Associate Director, QAC), Yujin Kim (Post-Doctoral Fellow) and Meiqing Zhang (Post-Doctoral Fellow).
The Wesleyan Media Project’s real-time tracking in 2024 is supported by Wesleyan University and the John S. and James L. Knight Foundation. The Wesleyan Media Project is partnering again this year with OpenSecrets, to provide added information on outside group disclosure and candidate status.
Periodic releases of data will be posted on the project’s website and dispersed via LinkedIn, Bluesky @wesmediaproject.bsky.social and Twitter @wesmediaproject. To be added to our email update list, click here.
For more information contact: Ziba Kashef at mkashef92@wesleyan.edu (please also cc media@wesleyan.edu).
About Wesleyan University
Wesleyan University, in Middletown, Conn., is known for the excellence of its academic and co-curricular programs. With more than 2,900 undergraduates and 200 graduate students, Wesleyan is dedicated to providing a liberal arts education characterized by boldness, rigor and practical idealism. For more, visit www.wesleyan.edu.
About the John S. and James L. Knight Foundation
We are social investors who support democracy by funding free expression and journalism, arts and culture in community, research in areas of media and democracy, and in the success of American cities and towns where the Knight brothers once had newspapers. Learn more at kf.org and follow @knightfdn on social media.


