Ad Spending Passes $7 Billion for the Cycle
(MIDDLETOWN, CT) October 29, 2026 – Ad spending in U.S. Senate races continues to rise in some states but is falling in others, according to a new analysis from the Wesleyan Media Project. Table 1 shows the volume of ad spending in each of the top Senate races in both early October (September 28 to October 11) and late October (October 12 to 25). Overall spending in most states increased in the recent two-week period but did decline in Texas, Georgia and North Carolina. The latter two are states in which pro-Republican spending has dropped considerably. Indeed, 93 percent of ad spending in Georgia in the most recent two weeks was pro-Democratic, and 84 percent of spending in North Carolina was pro-Democratic.
At the same time, there has been an influx of spending in Michigan, Iowa, Kansas, Nebraska and South Carolina. Ad spending in Iowa, for instance, has increased from $42 million earlier in the month to $65 million in the most recent two weeks. The percentage rise in spending in Kansas has been even steeper, going from $12 million earlier in the month to $34 million in the most recent two weeks. About 58 percent of that spending favors the Democrat, Adam Hamilton.
“Following the money suggests that the Senate battleground has been changing over these past two weeks, moving away from bluer states like Georgia and North Carolina and into redder territory,” said Travis Ridout, co-director of the Wesleyan Media Project.
Interestingly, the pro-Democratic share of spending has also been rising in some second-tier Senate races, such as Mississippi and Florida, though the pro-Democratic share of ad spending slipped by 20 percentage points in South Carolina, moving from 70 percent to 50 percent.
Table 1: Change in Spending in Senate Races (Early October to Late October)
(early October) | (early October) | (late October) | (late October) | spending | pro-Dem % |
|
|---|---|---|---|---|---|---|
| OH | $100.17 | 38.0% | $111.30 | 41.3% | $11.13 | 3.3% |
| TX | $96.27 | 27.0% | $89.15 | 33.2% | -$7.12 | 6.2% |
| MI | $49.56 | 49.0% | $65.93 | 48.6% | $16.37 | -0.4% |
| IA | $41.82 | 56.7% | $64.59 | 58.7% | $22.77 | 2.0% |
| ME | $34.24 | 46.1% | $40.23 | 48.9% | $5.99 | 2.8% |
| KS | $12.45 | 56.2% | $34.29 | 57.6% | $21.84 | 1.4% |
| AK | $22.52 | 47.0% | $25.38 | 52.3% | $2.86 | 5.3% |
| NE | $10.62 | 0.5%** | $22.94 | 5.9%** | $12.32 | 5.4% |
| NH | $21.70 | 41.0% | $22.34 | 44.7% | $0.64 | 3.7% |
| SC | $6.87 | 70.2% | $20.14 | 50.1% | $13.27 | -20.1% |
| GA | $24.53 | 72.6% | $17.45 | 93.0% | -$7.08 | 20.4% |
| FL | $8.78 | 4.3% | $11.68 | 31.7% | $2.90 | 27.4% |
| NC | $16.54 | 63.7% | $11.43 | 84.2% | -$5.11 | 20.5% |
| MS | $1.68 | 39.2% | $6.13 | 62.6% | $4.45 | 23.4% |
| AR | $3.06 | 10.7% | $3.16 | 12.4% | $0.10 | 1.7% |
| MN | $1.71 | 44.0% | $2.82 | 41.3% | $1.11 | -2.7% |
| Totals include broadcast, local cable, connected TV (CTV), digital (including Meta, Google, Snapchat and X), network cable, radio, satellite, and network broadcast. **This percentage is the Democratic percentage of total. The total includes spending on behalf of the Independent candidate. CITE SOURCE OF DATA AS: AdImpact with analysis by the Wesleyan Media Project. |
||||||
Table 2 provides more details on spending over the past two weeks in all Senate races. For example, in Ohio in just the previous two weeks, ad sponsors have spent over $111 million. That amounts to about $8 million each day, with the majority of spending (59 percent) benefiting the GOP candidate. Over 83 percent of spending on those ads came from outside groups. This included $21 million from the pro-Democratic group WinSenate, $25 million from the pro-GOP SLF PAC, and $17 million from the GOP-aligned Defend American Jobs.
In Texas, ad spending topped $89 million in the previous two weeks, with an even greater share of spending on behalf of the Republican candidate (67 percent) than in Ohio. This included $40 million from Texas PAC, which is a Super PAC reportedly backed with funds from Elon Musk. That group allocated over $2.7 million of its ad spending to spots that aired nationally instead of on local broadcast stations purchased at the media market level. This is rare but sometimes more cost efficient for outside groups, who do not qualify for the lowest unit rate (and in Texas, there are 20 media markets).
Ad spending was also robust in Michigan and Iowa, which saw ad spending top $60 million in each race over the previous two weeks. Spending in Maine rounds out the top 5 at $40 million.
Table 2: Ad Spending in Races for U.S. Senate (10/12/26 to 10/25/26)
(in $Ms) | Spend (in $Ms) | Spend (in $Ms) | Spend (in $Ms) | |||
|---|---|---|---|---|---|---|
| OH | $111.30 | $7.64 | $5.30 | $93.15 | 83.7 | 41.3% |
| TX | $89.15 | $18.88 | $3.41 | $59.06 | 66.2 | 33.2% |
| MI | $65.93 | $5.89 | $4.02 | $49.77 | 75.5 | 48.6% |
| IA | $64.59 | $4.99 | $3.85 | $48.55 | 75.2 | 58.7% |
| ME | $40.23 | $4.19 | $2.11 | $32.01 | 79.6 | 48.9% |
| KS | $34.29 | $6.15 | $2.15 | $24.91 | 72.7 | 57.6% |
| AK | $25.38 | $2.76 | $1.61 | $18.44 | 72.6 | 52.3% |
| NE | $22.94 | $1.19 | $19.95 | 87 | 5.9%** | |
| NH | $22.34 | $3.16 | $1.47 | $16.95 | 75.9 | 44.7% |
| SC | $20.14 | $4.54 | $0.01 | $15.09 | 74.9 | 50.1% |
| GA | $17.45 | $14.97 | $0.06 | $2.42 | 13.9 | 93.0% |
| FL | $11.68 | $0.64 | $1.68 | $7.02 | 60.1 | 31.7% |
| NC | $11.43 | $8.34 | $0.10 | $2.58 | 22.5 | 84.2% |
| MS | $6.13 | $0.69 | $1.61 | $3.82 | 62.4 | 62.6% |
| AR | $3.16 | $0.39 | $1.02 | $1.33 | 42.3 | 12.4% |
| MN | $2.82 | $1.16 | $1.13 | $0.52 | 18.6 | 41.3% |
| VA | $2.77 | $2.69 | $0.08 | 2.9 | 100.0% | |
| MT | $2.20 | $0.43 | $1.27 | 57.7 | ~0%** | |
| SD | $2.17 | $0.61 | $1.40 | 64.5 | 25.7** | |
| KY | $2.13 | $0.01 | $1.36 | $0.76 | 35.7 | 1.2% |
| LA | $1.67 | $0.65 | $1.01 | $0.00 | 0.1 | 39.1% |
| WV | $1.41 | $0.00 | $1.28 | $0.13 | 8.9 | 0.3% |
| CO | $1.00 | $0.68 | 0 | 67.2** | ||
| NM | $0.90 | $0.90 | $0.00 | 0 | 100.0% | |
| IL | $0.73 | $0.58 | $0.14 | $0.00 | 0.2 | 80.4% |
| ID | $0.62 | $0.62 | 0 | 0.0% | ||
| RI | $0.57 | $0.57 | 0 | 100.0% | ||
| WY | $0.17 | $0.17 | $0.00 | 0 | 0.0% | |
| OK | $0.16 | $0.16 | $0.00 | 0.3 | 0.0% | |
| DE | $0.11 | $0.11 | 0 | 100.0% | ||
| TN | $0.09 | $0.05 | $0.04 | 48.6 | 23.3% | |
| MA | $0.08 | $0.00 | $0.05 | $0.00 | 0.8 | 1.8%** |
| AL | $0.01 | $0.00 | $0.01 | 95.8 | 66.8% | |
| NJ | $0.01 | $0.01 | 0 | 100.0% | ||
| OR | $0.00 | $0.00 | 0 | 100.0% | ||
| Totals include broadcast, local cable, connected TV (CTV), digital (including Meta, Google, Snapchat and X), network cable, radio, satellite, and network broadcast. *Total spending will be greater in some rows than the sum of candidate and group spending because the total also includes any spending on party coordinated ads with candidates. **This percentage is the Democratic percentage of total. The total includes spending on behalf of the Independent candidate. CITE SOURCE OF DATA AS: AdImpact with analysis by the Wesleyan Media Project. |
||||||
OH, TX, and WI Top List of Expensive Gov Races; GOP Leads Spending in Top States
Ad spending in races for governor topped $30 million in three states (Ohio, Texas, and Wisconsin) over the last two weeks and was just shy of that amount in two more (Georgia and Florida). Spending exceeded $10 million in nine states. Republicans continue to have considerable ad spending advantages in several states, including Ohio, Texas, Wisconsin, Georgia, Florida and Nevada, though Democrats have spending advantages in New York, Michigan, Pennsylvania and Iowa.
In Ohio, a lot of attention was focused on one ad aired by the Republican candidate, Vivek Ramaswamy. In that ad, the mother of Ramaswamy’s opponent, Amy Acton, appeared and urged voters to vote for the Republican candidate, arguing that her daughter was a liar. The ad was widely criticized because Acton and her mother were long estranged over a sexual assault allegation against Acton’s stepfather, who was charged with raping Acton when she was 12 years old. Acton and her brother were subsequently removed from their mother’s custody, and Acton has said she has had no contact with her mother since. The ad aired in the timeline covered for this report, largely between 10/22 and 10/25. The spot aired about 700 times, costing Ramaswamy around $650,000.
“In every election cycle a particular ad often becomes the focus of national discussion, either because it is innovative, particularly memorable, or very negative,” said Michael Franz, co-director of the Wesleyan Media Project. “The ad from Ramaswamy featuring Amy Acton’s mother may very well be the one ad people remember most about the ad wars in 2026.”
In Ohio and Texas, the combination of competitive Senate and gubernatorial campaigns means that in just the last two weeks, voters in Ohio have seen over $150 million in ads across the two races, and in Texas the total across the Senate and governor races is about $130 million.
Table 3: Ad Spending in Races for Governor (10/12/26 to 10/25/26)
| Race | (in $Ms) | Spend (in $Ms) | Spend (in $Ms) | Spend (in $Ms) | ||
|---|---|---|---|---|---|---|
| OH | $43.56 | $8.49 | $9.95 | $25.12 | 57.7 | 31.3% |
| TX | $39.14 | $8.55 | $28.71 | $1.74 | 4.4 | 21.8% |
| WI | $33.03 | $8.30 | $8.44 | $16.29 | 49.3 | 43.9% |
| GA | $29.72 | $0.04 | $22.02 | $0.28 | 1 | 25.8% |
| FL | $27.67 | $1.13 | $2.25 | $1.14 | 4.1 | 19.8% |
| NY | $17.06 | $8.01 | $4.47 | $4.59 | 26.9 | 70.5% |
| NV | $16.63 | $1.05 | $1.19 | $14.38 | 86.5 | 36.9% |
| MI | $12.90 | $2.48 | $2.27 | $6.48 | 50.2 | 65.5% |
| PA | $10.34 | $8.11 | $2.23 | $0.01 | 0.1 | 78.5% |
| IA | $8.44 | $4.69 | $3.42 | $0.32 | 3.8 | 58.9% |
| AZ | $8.34 | $0.50 | $0.28 | $4.23 | 50.7 | 43.2% |
| KS | $7.69 | $0.56 | $0.56 | $6.57 | 85.5 | 30.6% |
| TN | $7.62 | $0.25 | $1.38 | $3.92 | 51.5 | 3.3%** |
| OR | $6.44 | $3.34 | $3.10 | $0.00 | 0 | 51.9% |
| CA | $5.49 | $5.37 | $0.10 | $0.02 | 0.3 | 98.2% |
| MN | $5.33 | $1.60 | $0.53 | $1.83 | 34.4 | 46.2% |
| CT | $4.36 | $1.73 | $2.64 | 0 | 39.6% | |
| IL | $4.27 | $4.27 | $0.00 | 0 | 99.9% | |
| NE | $3.98 | $1.42 | $2.56 | $0.01 | 0.1 | 35.7% |
| OK | $3.46 | $0.42 | $0.61 | $2.43 | 70.2 | 12.1% |
| AL | $3.34 | $0.68 | $2.55 | $0.11 | 3.3 | 20.8% |
| MA | $3.14 | $2.14 | $0.89 | $0.11 | 3.5 | 72.1% |
| NM | $2.67 | $1.71 | $0.17 | $0.79 | 29.7 | 91.4% |
| MD | $1.79 | $1.76 | $0.03 | $0.00 | 0 | 98.1% |
| ME | $1.47 | $0.79 | $0.06 | $0.61 | 41.8 | 89.7% |
| AR | $1.46 | $1.46 | 0 | 0.0% | ||
| NH | $1.40 | $0.24 | $1.16 | 0 | 17.2% | |
| CO | $1.30 | $0.40 | $0.90 | 69.4 | 100.0% | |
| AK | $1.19 | $0.69 | $0.18 | $0.31 | 26.3 | 81.9% |
| RI | $1.07 | $0.51 | $0.00 | $0.49 | 46 | 94.4** |
| VT | $0.88 | $0.18 | $0.12 | $0.58 | 66.3 | 19.9% |
| SC | $0.63 | $0.07 | $0.56 | $0.00 | 0.1 | 10.9% |
| ID | $0.62 | $0.17 | $0.40 | 0 | 36.4% | |
| HI | $0.26 | $0.16 | $0.00 | $0.10 | 36.5 | 98.1% |
| SD | $0.21 | $0.03 | $0.17 | $0.00 | 0.1 | 15.9% |
| MS | $0.09 | $0.09 | 0 | 0.0% | ||
| WY | $0.00 | $0.00 | $0.00 | 86.1 | 0.0% | |
| Totals include broadcast, local cable, connected TV (CTV), digital (including Meta, Google, Snapchat and X), network cable, radio, satellite, and network broadcast. *Total spending will be greater in some rows than the sum of candidate and group spending because the total also includes any spending on party coordinated ads with candidates. **This percentage is the Democratic percentage of total. The total includes spending on behalf of the Independent candidate. CITE SOURCE OF DATA AS: AdImpact with analysis by the Wesleyan Media Project. |
||||||
Several U.S. House Races Feature over $10 million in Ad Spending in Last Two Weeks; FL-25 closes in on $20 million
More than a dozen House races have seen more than $10 million in spending over the past two weeks, and one—the race in Florida’s 25th congressional district, which is an open seat—has seen almost $20 million in spending (Table 4). In contrast to many Senate races, most of the highest-spending House races have seen relatively balanced spending on behalf of the Republican and Democratic candidates, with the percentage of pro-Democratic spending, which is shown in the final column of the table, generally between 40 and 60 percent.
In addition to the race in Florida-25, top races include those in North Carolina’s 1st district, Michigan’s 7th district, and Florida’s 22nd district. Of the top 10 races by ad spending over the last two weeks, one is an open seat, four are held by Democratic incumbents, and five are held by Republican incumbents.
Table 4: Most Expensive Races for U.S. House (10/12/26 to 10/25/26)
(in $Ms) | Spend (in $Ms) | Spend (in $Ms) | Spend (in $Ms) | |||
|---|---|---|---|---|---|---|
| FL25 | $19.03 | $1.35 | $0.18 | $15.30 | 80.4 | 53.3% |
| NC01 | $17.73 | $0.70 | $0.32 | $15.18 | 85.6 | 53.5% |
| MI07 | $17.14 | $0.80 | $1.03 | $13.77 | 80.3 | 41.3% |
| FL22 | $16.66 | $0.55 | $1.29 | $11.99 | 71.9 | 49.4% |
| FL14 | $16.22 | $0.94 | $0.30 | $12.50 | 77.1 | 43.5% |
| MI10 | $16.19 | $1.09 | $0.94 | $12.17 | 75.2 | 49.8% |
| AZ01 | $12.62 | $0.43 | $0.39 | $9.42 | 74.7 | 39.3% |
| TX34 | $12.32 | $0.50 | $0.24 | $9.73 | 79 | 47.4% |
| NY17 | $12.23 | $1.02 | $0.97 | $6.44 | 52.6 | 44.1% |
| WI03 | $12.12 | $1.12 | $1.43 | $8.10 | 66.9 | 50.1% |
| CO08 | $11.57 | $1.26 | $1.53 | $6.97 | 60.3 | 54.3% |
| CA22 | $11.19 | $0.37 | $1.09 | $8.02 | 71.7 | 54.9% |
| ME02 | $11.09 | $0.51 | $0.48 | $9.37 | 84.5 | 45.4% |
| PA01 | $11.08 | $0.36 | $0.92 | $7.80 | 70.4 | 56.9% |
| PA08 | $10.95 | $0.28 | $0.73 | $8.47 | 77.4 | 51.8% |
| PA07 | $10.32 | $0.43 | $0.94 | $7.66 | 74.3 | 46.4% |
| TX15 | $10.24 | $0.19 | $0.30 | $8.07 | 78.8 | 47.9% |
| WA03 | $9.79 | $0.93 | $0.40 | $6.88 | 70.3 | 47.5% |
| AZ06 | $8.62 | $0.85 | $0.24 | $6.70 | 77.7 | 60.9% |
| MI04 | $8.55 | $0.31 | $0.90 | $5.76 | 67.4 | 49.2% |
| WI01 | $8.09 | $0.54 | $1.91 | $5.14 | 63.5 | 42.8% |
| IA01 | $7.97 | $1.68 | $1.37 | $4.33 | 54.3 | 74.9% |
| TX35 | $7.81 | $0.57 | $0.17 | $6.38 | 81.7 | 59.8% |
| PA10 | $7.67 | $0.87 | $0.93 | $4.89 | 63.7 | 43.3% |
| VA01 | $7.64 | $0.60 | $0.90 | $4.36 | 57 | 56.4% |
| OH07 | $7.59 | $0.73 | $0.51 | $6.14 | 81 | 61.2% |
| IA03 | $7.57 | $0.74 | $0.69 | $5.23 | 69.1 | 47.3% |
| VA02 | $7.45 | $0.95 | $0.82 | $4.70 | 63.1 | 42.6% |
| NC11 | $7.22 | $1.05 | $0.08 | $3.61 | 50 | 54.4% |
| MT01 | $7.15 | $0.77 | $0.43 | $5.30 | 74.1 | 50.2% |
| NJ07 | $6.69 | $0.50 | $1.04 | $1.46 | 21.8 | 56.1% |
| OH09 | $6.59 | $0.50 | $0.52 | $4.53 | 68.6 | 40.6% |
| NM02 | $6.49 | $0.49 | $0.45 | $4.69 | 72.3 | 47.3% |
| IA02 | $6.07 | $0.74 | $0.40 | $3.67 | 60.4 | 60.6% |
| TX28 | $5.36 | $0.21 | $0.00 | $3.73 | 69.6 | 75.1% |
| KY06 | $5.24 | $0.67 | $0.06 | $3.56 | 67.9 | 50.2% |
| AZ02 | $5.11 | $0.53 | $1.24 | $3.14 | 61.4 | 36.6% |
| OH15 | $4.80 | $0.13 | $0.51 | $4.14 | 86.1 | 48.7% |
| AK01 | $3.53 | $0.37 | $2.41 | 68.3 | 31.3%** | |
| FL13 | $4.46 | $0.66 | $0.57 | $2.86 | 64.2 | 79.8% |
| CA48 | $4.44 | $0.32 | $0.48 | $0.85 | 19.1 | 83.8% |
| AR02 | $4.38 | $0.38 | $0.86 | $3.14 | 71.6 | 25.5% |
| OH10 | $4.37 | $0.16 | $0.14 | $3.74 | 85.6 | 58.3% |
| AL02 | $4.16 | $0.32 | $0.14 | $3.01 | 72.5 | 59.8% |
| CA13 | $3.97 | $0.27 | $0.11 | $2.11 | 53 | 41.0% |
| SC01 | $3.59 | $0.27 | $0.19 | $2.83 | 78.7 | 43.6% |
| NY03 | $3.57 | $1.35 | $0.92 | $0.98 | 27.5 | 67.8% |
| MN01 | $3.48 | $0.69 | $0.59 | $2.00 | 57.4 | 57.3% |
| NY04 | $3.11 | $1.70 | $0.14 | $0.60 | 19.2 | 80.2% |
| TN09 | $3.06 | $0.63 | $0.44 | $1.99 | 65 | 72.6% |
| CA04 | $2.93 | $2.04 | $0.89 | 30.5 | 100.0% | |
| CO05 | $2.82 | $0.49 | $0.60 | $1.30 | 46 | 52.6% |
| NY21 | $2.67 | $0.73 | $1.12 | $0.82 | 30.7 | 57.2% |
| NV02 | $2.27 | $0.30 | $0.07 | $1.85 | 81.4 | 43.1% |
| LA06 | $2.12 | $0.67 | $1.45 | 68.5 | 0.0% | |
| OH01 | $2.06 | $0.50 | $0.01 | $1.42 | 68.6 | 70.6% |
| CA40 | $2.00 | $1.43 | $0.57 | 28.3 | 0% | |
| Totals include broadcast, local cable, connected TV (CTV), digital (including Meta, Google, Snapchat and X), network cable, radio, satellite, and network broadcast. *Total spending will be greater in some rows than the sum of candidate and group spending because the total also includes any spending on party coordinated ads with candidates. **This percentage is the Democratic percentage of total. The total includes spending on behalf of the Independent candidate. CITE SOURCE OF DATA AS: AdImpact with analysis by the Wesleyan Media Project. |
||||||
$7 Billion in Ad Spending This Cycle; Nearly $1.4 Billion of that in Last Two Weeks
As the election nears a close, ad spending across platforms in House, Senate and gubernatorial races has passed $7.1 billion in the cycle to-date (Table 5). This includes nearly $3 billion in ad spending in Senate races and $2 billion in House races. Across platforms in the full cycle, a majority of spending (53 percent) was committed to broadcast television ads and about a quarter to ads on streaming and CTV. About 12 percent of ad spending was on ads on digital platforms such as Meta, YouTube, websites, and other social media.
Outside groups have dominated congressional spending, with ads from groups totaling $3 billion across House and Senate campaigns. Groups have outspent candidates in Senate races by nearly 3:1 and by 2:1 in House races.
Table 5: Spending by Office, Sponsor Type and Media Channel (1/1/25 to 10/25/26)
Type | (in $Ms) | (in $Ms) | (in $Ms) | (in $Ms) | (in $Ms) | (in $Ms) |
|
|---|---|---|---|---|---|---|---|
| Governor | Candidate | 717.42 | 384.3 | 170.3 | 145.69 | 42.06 | 1459.77 |
| Group | 367.6 | 202.06 | 79.79 | 83.98 | 17.57 | 751 | |
| Coordinated | 66.72 | 34.83 | 5.4 | 8.06 | 0.81 | 115.82 | |
| Senate | Candidate | 321.44 | 183.8 | 162.9 | 48.3 | 19.34 | 735.76 |
| Group | 1059.11 | 478.18 | 219.17 | 142.8 | 80.02 | 1979.28 | |
| Coordinated | 98.28 | 37.63 | 3.88 | 12.71 | 4.55 | 157.05 | |
| House | Candidate | 330.06 | 129.85 | 100.69 | 64.05 | 14.44 | 639.08 |
| Group | 669.58 | 180.73 | 151.79 | 101.37 | 27.89 | 1131.36 | |
| Coordinated | 140.24 | 26.1 | 0.73 | 6.22 | 1.11 | 174.41 | |
| Total | $3,770.46 | $1,657.46 | $894.65 | $613.18 | $207.79 | $7,143.54 | |
| % | 52.8% | 23.2% | 12.5% | 8.6% | 2.9% | ||
| Other includes network cable, radio, satellite, and network broadcast CTV includes spending on streaming, CTV devices and in-app ads. Digital includes spending on Meta, Google, Snapchat, and X CITE SOURCE OF DATA AS: AdImpact with analysis by the Wesleyan Media Project. |
|||||||
Figure 1: Advertising Spending by Office, Party, and Platform (10/12/26 to 10/25/26)
Other includes network cable, radio, satellite, and network broadcast
CTV includes spending on streaming, CTV devices and in-app ads.
Digital includes spending on Meta, Google, Snapchat, and X
CITE SOURCE OF DATA AS: AdImpact with analysis by the Wesleyan Media Project.
In the last two weeks, for the period covering October 12 to 25, ad sponsors have spent $1.4 billion (Table 6) on political ads. In prior reports, we tended to find about $1 billion in ad spending every two weeks (since the end of the summer). The spike in ad spending toward the end of the campaigns is typical as ad sponsors make their final pitches to voters.
In this most recent two-week timeframe, the share of spending on broadcast television outpaces the full cycle, with about 64 percent of spending on broadcast stations compared to 53 percent in the full cycle. Outside groups remain highly active, out-spending candidates in Senate races and House races by 3:1. Candidates have greatly out-spent groups in gubernatorial campaigns, however.
Table 6: Spending by Office, Sponsor Type and Media Channel (10/12/26 to 10/25/26)
Type | (in $Ms) | (in $Ms) | (in $Ms) | (in $Ms) | (in $Ms) | (in $Ms) |
|
|---|---|---|---|---|---|---|---|
| Governor | Candidate | 104.47 | 46.26 | 17.31 | 12.9 | 5.73 | 186.67 |
| Group | 53.91 | 21.83 | 6.68 | 8.42 | 2.52 | 93.36 | |
| Coordinated | 25.53 | 8.57 | 0.1 | 2.51 | 0.26 | 36.97 | |
| Senate | Candidate | 70.54 | 27.66 | 19.38 | 6.93 | 4.74 | 129.24 |
| Group | 238.12 | 83.03 | 31.91 | 24.88 | 21.34 | 399.27 | |
| Coordinated | 27.2 | 7.08 | 0.29 | 1.77 | 0.87 | 37.22 | |
| House | Candidate | 73.31 | 24.36 | 8.64 | 9.04 | 2.67 | 118.02 |
| Group | 232.39 | 40.99 | 22.59 | 14.3 | 9.25 | 319.52 | |
| Coordinated | 55.84 | 8.91 | 0.05 | 1.93 | 0.32 | 67.06 | |
| Total | $881.29 | $268.69 | $106.96 | $82.68 | $47.70 | $1,387.33 | |
| % | 63.5% | 19.4% | 7.7% | 6.0% | 3.4% | ||
| Other includes network cable, radio, satellite, and network broadcast CTV includes spending on streaming, CTV devices and in-app ads. Digital includes spending on Meta, Google, Snapchat, and X CITE SOURCE OF DATA AS: AdImpact with analysis by the Wesleyan Media Project. |
|||||||
Because outside groups tend to pay more for broadcast ads than candidates and party committees (given the lowest unit rate afforded candidates), we also compare the share of spending across sponsors to the share of broadcast airings in the previous two weeks (Table 7). In Senate races, outside groups make up 71 percent of spending on broadcast ads but accounted for only 43 percent of ad airings. Ads coordinated between party committees and candidates made up about 14 percent of Senate broadcast spots.
In House races, we see the same pattern. Groups footed the bill for 64 percent of broadcast spending but sponsored 39 percent of broadcast spots, roughly the same share as candidates. Party-candidate coordinated buys make up about 1 in 5 airings for House races in the previous two weeks.
Table 7: Spending and Airings on Broadcast TV Ads (10/12/26 to 10/25/26)
Spending (in $Ms) | Spending | Airings | Airings |
|
|---|---|---|---|---|
| Governor | ||||
| Candidate | $104.47 | 56.8% | 185,008 | 70.3% |
| Group | $53.91 | 29.3% | 44,514 | 16.9% |
| Coordinated | $25.53 | 13.9% | 33,688 | 12.8% |
| Total | $183.90 | 263,210 | ||
| Senate | ||||
| Candidate | $70.54 | 21.0% | 149,147 | 43.6% |
| Group | $238.12 | 70.9% | 146,739 | 42.9% |
| Coordinated | $27.20 | 8.1% | 46,111 | 13.5% |
| Total | $335.86 | 341,997 | ||
| House | ||||
| Candidate | $73.31 | 20.3% | 162,144 | 41.0% |
| Group | $232.39 | 64.3% | 155,104 | 39.2% |
| Coordinated | $55.84 | 15.4% | 78,086 | 19.8% |
| Total | $361.53 | 395,334 | ||
| CITE SOURCE OF DATA AS: AdImpact with analysis by the Wesleyan Media Project. | ||||
Attack Ads in Senate Races Down Slightly in 2026
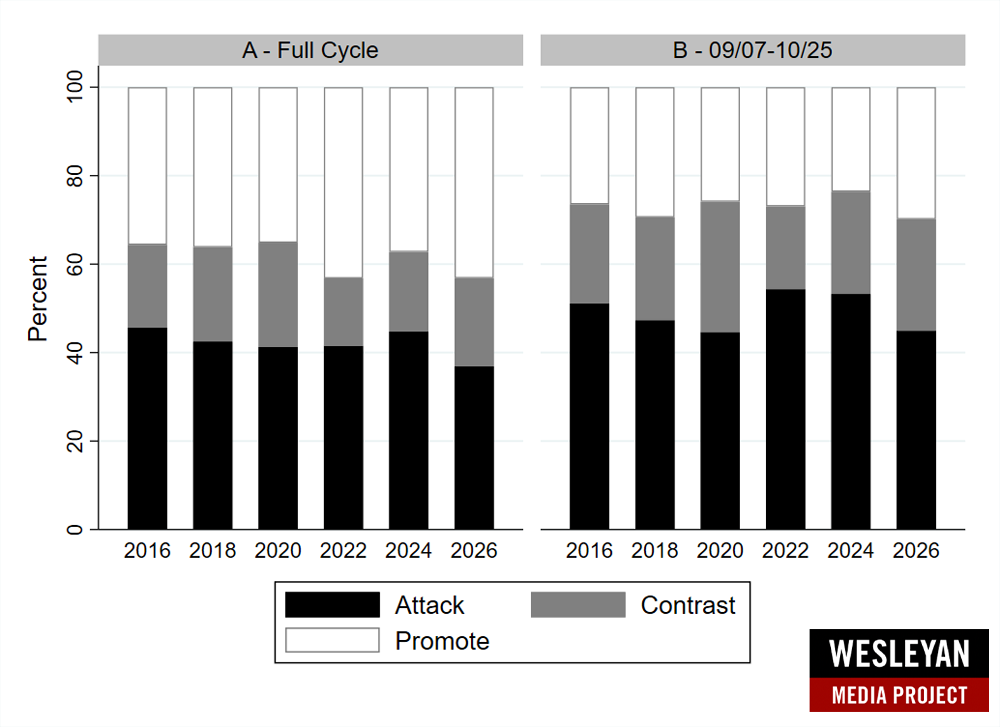
Figure 2 shows the percentage of ads that fall into the attack, contrast and promote categories by year in U.S. Senate races. (Our coding of ad tone is on-going for House and gubernatorial ads, which is why they are not also reported here.) Attack ads are those that mention only a targeted candidate, promotional ads mention only a favored candidate, while contrast ads mention both candidates. Across the entire cycle, the proportion of ads that fall into the attack category is lower than in the previous five election cycles, though still almost 40 percent of ad airings are coded as attacks.
“Perhaps surprising to some, but 2026 is not a record-breaking year for negative ads, at least on broadcast television in Senate races,” said Erika Franklin Fowler, co-director of the Wesleyan Media Project. “Voters are still bombarded with attack ads, and some are particularly vicious. But in terms of attack ads versus promotional spots, 2026 looks pretty typical.”
Looking at just the past two weeks, we also see that the proportion of attack ads is lower than in the previous two cycles, and the proportion of promotional ads is also higher. Still only about a quarter of total ads fall into the promotional category—consistent with the typical pattern of rising negativity as Election Day approaches.
Figure 2: Tone of Ad Airings in Senate by Year
Numbers include broadcast television for all sponsors.
CITE SOURCE OF DATA AS: Vivvix/CMAG and AdImpact with analysis by the Wesleyan Media Project.
Record-setting House, Gubernatorial Ad Volumes in 2026
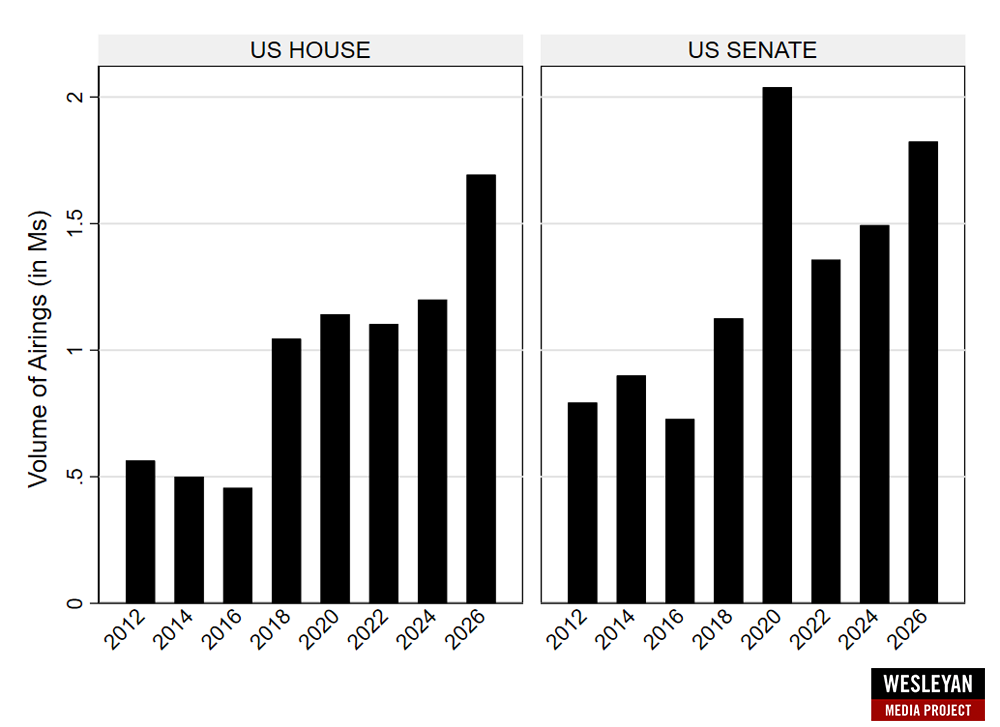
Figure 3 shows the volume of congressional ad airings on broadcast television in each election cycle since 2012. The current election cycle stands out for having the highest number of ad airings in U.S. House races of any election cycle since 2012, with numbers far surpassing ad airings in any previous cycle. There have been well over 1.5 million broadcast ad airings in House races this cycle.
Ad volumes in the Senate are also extremely heavy this election cycle, though they do not exceed the record-breaking year of 2020.
Figure 3: Broadcast Airings in Congressional Races (cycle-to-date), 2012 to 2026
Numbers include broadcast television for all sponsors.
CITE SOURCE OF DATA AS: Vivvix/CMAG and AdImpact with analysis by the Wesleyan Media Project.
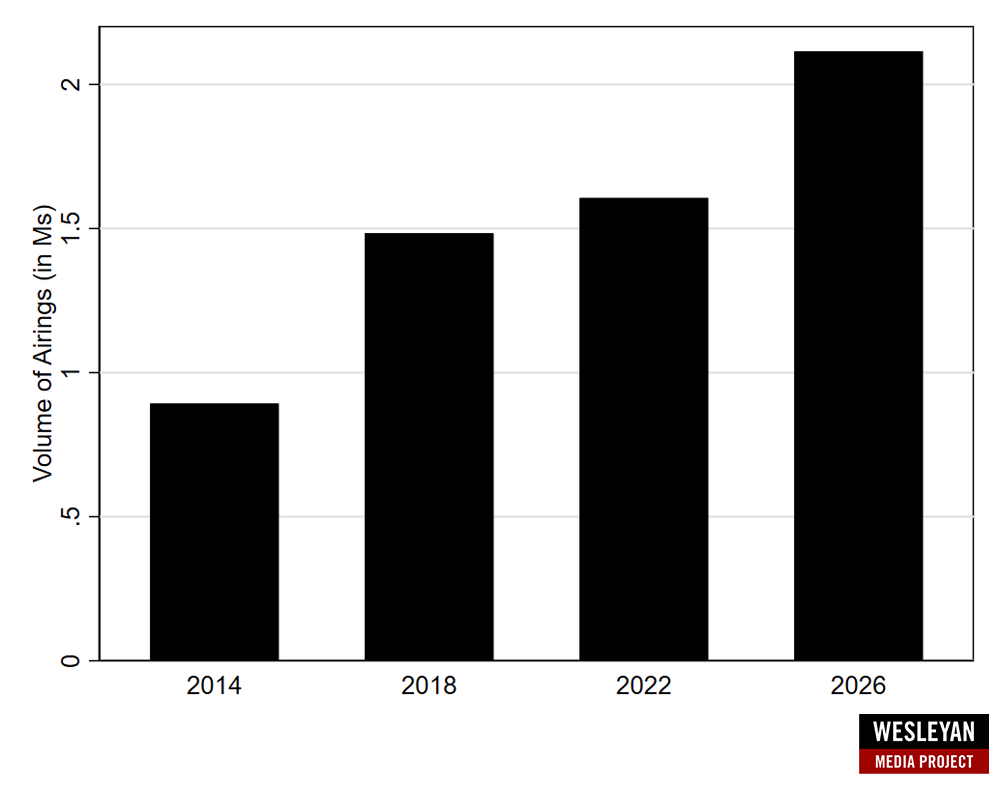
The volume of broadcast television ad airings in gubernatorial races is also record-setting this cycle, as Figure 4 shows. So far, there have been over 2 million ad airings on broadcast television in the 2026 election cycle, considerably more than in 2022, 2018 and 2014, years in which the same set of gubernatorial races were on the ballot.
Figure 4: Broadcast Airings in Gubernatorial Races (cycle-to-date), 2014 to 2026
Numbers include broadcast television for all sponsors.
CITE SOURCE OF DATA AS: Vivvix/CMAG and AdImpact with analysis by the Wesleyan Media Project.
Super PACs Dominate Outside Group Spending in Gubernatorial and Senate Races, while Carey PACs More Present in House Races
Thanks to a partnership with OpenSecrets, the Wesleyan Media Project is able to analyze the types of groups that are sponsoring ads. The top half of Table 8 shows that there has been $3.86 billion in spending from outside groups this election cycle, with the majority of that coming from Super PACs in races for governor and Senate. In House races, by contrast, ad spending is split between Super PACs and Carey committees, which are also known as hybrid PACs. Carey committees are allowed to operate both as traditional PACs, giving donations to campaigns, and as a Super PAC, spending unlimited amounts on independent expenditures.
In the past two weeks, in fact, much of the group spending in House races has come from these Carey committees, while Super PAC spending has dominated in Senate races (the bottom half of Table 8).
Very little spending in the more recent time frame is from so-called dark money groups, known as 501c non-profit groups (for the section of the tax code they file under). These groups are not required to disclose their donors to the public, but the data in Table X show that they are less responsible for ads in the final stretch of the campaign. Still, many dark money groups donate to Super PACs, which still obscures the true source of much Super PAC spending.
Table 8: Outside Ad Spending by Group Type
(to 10/25) | |||
|---|---|---|---|
| 501c | 12.6% | 19.1% | 19.4% |
| Carey | 1.4% | 9.4% | 36.6% |
| Joint Fundraiser | 0.0% | 0.3% | 0.9% |
| PAC | 10.1% | 0.7% | 1.7% |
| Super PAC | 61.9% | 69.0% | 37.7% |
| 527 | 10.5% | 0.4% | 0.0% |
| Other | 3.6% | 1.2% | 3.7% |
| Total (in $Ms) | $751.00 | $1,979.28 | $1,131.36 |
| (10/12 to 10/25) | |||
| 501c | 3.8% | 1.6% | 1.1% |
| Carey | 4.9% | 10.5% | 61.1% |
| Joint Fundraiser | 0.0% | 0.1% | 0.0% |
| PAC | 7.0% | 0.3% | 0.8% |
| Super PAC | 56.5% | 87.1% | 36.3% |
| 527 | 22.6% | 0.0% | 0.0% |
| Other | 5.1% | 0.4% | 0.7% |
| Total (in $Ms) | $93.36 | $399.27 | $319.52 |
| Totals include broadcast, local cable, connected TV (CTV), digital (including Meta, Google, Snapchat and X), network cable, radio, satellite, and network broadcast. CITE SOURCE OF DATA AS: AdImpact with analysis by the Wesleyan Media Project. Group classifications provided by OpenSecrets. |
|||
Over $605 Million in Ad Spending on State and Local Ballot Measures
Ad spending on ballot measures this cycle has been considerable, with much of that spending occurring in California. The measure that drew the most spending ($140 million) was last year’s vote in favor of new congressional district lines in California. An April 2026 referendum in Virginia to allow the legislature to redistrict the state drew $84 million in ad spending. Spending has been heavy on several other measures that are on California ballots next week–as well as in Missouri. Spending on ads about Missouri’s Amendment 5 concerning the eventual elimination of the income tax, which was voted on in August, totaled over $18 million. Spending on Amendment 3 in the state, which would roll back abortion protections in the state if passed, has topped $17 million.
Table 9: Most Expensive Ballot Measures (1/1/25 to 10/25/26)
(in $Ms) |
|
|---|---|
| CA Prop 50 Use of Legislative Congressional Redistricting Issue 2025 | $139.86 |
| VA Redistricting Issue 2026 | $84.06 |
| CA Prop 40 One Time Wealth Tax Issue 2026 | $81.96 |
| CA Establish Personal Injury Lawyer Regulations Initiative Issue 2026 | $46.48 |
| CA Prop 42 Prohibit New Taxes on Retirement Holdings Issue 2026 | $37.20 |
| CA Prop 39 Voter Identification Issue 2026 | $30.29 |
| CA Prop 45 Changes to Environmental Review Process for Certain Projects Initiative Issue 2026 | $21.71 |
| CA Prop 38 Immunology and Immunotherapy Research Funding Initiative Issue 2026 | $20.73 |
| MO Amendment 5 Issue 2026 | $18.41 |
| MO Amendment 3 Issue 2026 | $17.43 |
| CA Prop 44 Spending Requirements for Federally Qualified Health Centers Initiative Issue 2026 | $15.27 |
| CA Prop 37 Second Mortgage Homebuyer Program Issue 2026 | $9.50 |
| CA Prop 1 Veteran And Housing Assistance Programs Bond Issue 2026 | $9.36 |
| ID Proposition 1 Reproductive Freedom and Privacy Issue 2026 | $6.89 |
| MO Amendment 4 Issue 2026 | $6.78 |
| OK SQ832 Minimum Wage Increase Issue 2026 | $5.35 |
| CO Prop NN TABOR Revenue Cap Increase Issue 2026 | $5.16 |
| AK Ballot Measure 2 Ranked Choice Voting Repeal Issue 2026 | $5.10 |
| MO Amendment 6 Issue 2026 | $4.69 |
| MA Rent Control Initiative Issue 2026 | $4.47 |
| Totals include broadcast, local cable, connected TV (CTV), digital (including Meta, Google, Snapchat and X), network cable, radio, satellite, and network broadcast. CITE SOURCE OF DATA AS: AdImpact with analysis by the Wesleyan Media Project. |
|
AI ad spending now at $187 million
Spending on ads generated or enhanced by AI has now surpassed $187 million, with the Wesleyan Media Project having tracked 289 unique ads. Just over 90 percent of that spending ($169 million) has come from Republican candidates, a Republican party committee or a Republican-leaning group. Eighty-two percent of the individual ads were sponsored by a Republican entity, with 13 percent coming from Democrats. The remainder came from independent candidates or groups.
The WMP tracked AI ads through disclaimers, media coverage and visual inspection by our coders, but our calculation of spending is almost surely lower than the actual level of spending given that many ads do not contain disclaimers and some instances of AI use are difficult to determine with the human eye alone.
About the Data
Advertising spending data reported here for 2025-2026 come from AdImpact with analysis by the Wesleyan Media Project. All cost estimates for ad spending by medium use AdImpact’s methodology.
The CTV category includes ads distributed over devices where an input is connected to a television (e.g., Apple TV, PlayStation, etc), streaming via set-top-boxes, including video on demand (e.g., Dish or XFINITY streaming) and in apps available on smart TVs (e.g., YouTube or the Hulu app, etc).
Advertising historical airings data reported here come from original Wesleyan Media Project analysis of Vivvix/CMAG data for the 2012-2024 cycles and AdImpact for the current cycle.
Advertising content information on issue focus comes from ongoing Wesleyan Media Project trained classifiers applied to transcribed audio from 2026 cycle broadcast advertising, which may differ from final coding incorporating additional visual elements. In this case, our issue classifiers utilize machine learning methods to rate text trained from prior human, hand-coded data. Testing indicates an average precision of roughly 0.72, indicating a moderate degree of human-machine reliability, though this varies by issue domain and should be interpreted cautiously. The issues “campaign finance” and “government ethics” have received new influxes this cycle, and have had custom-classifiers applied directly to boost their accuracy. Additionally, for coding “attack,” “contrast,” and “promote” ads, an entity linker was applied to automatically score races which contained mentions of promoted candidates and/or opponents. Results indicate a precision of 0.96 for detecting mentions of candidates and 0.89 for tone classification, indicating an excellent degree of reliability.
AI in ads tracking reported here comes from the Wesleyan Media Project’s original assessment of election advertising that either explicitly states in a disclaimer that it uses AI, has been reported by news media and/or by AdImpact to include AI-generated or AI-enhanced content, or has been flagged by our coding staff as likely to be incorporating AI and been confirmed by our team. Our goal is to assess known prevalence over time. We rely on AdImpact estimated spending for each ad identified. This tracking is undoubtedly an underestimate given there are a lot of ways in which AI might be incorporated that may go undetected.
About this Report
The Wesleyan Media Project provides real-time tracking and analysis of all political television advertising in an effort to increase transparency in elections. Housed in Wesleyan’s Hazel Quantitative Analysis Center – part of the Allbritton Center for the Study of Public Life – the Wesleyan Media Project is the successor to the Wisconsin Advertising Project, which disbanded in 2009. It is directed by Erika Franklin Fowler, professor of government at Wesleyan University, Michael M. Franz, professor of government at Bowdoin College and Travis N. Ridout, professor of political science at Washington State University. WMP personnel include Breeze Floyd (Program Manager), Pavel Oleinikov (Associate Director, QAC), and Donny Snyder (Post-Doctoral Fellow).
The Wesleyan Media Project’s real-time tracking in 2026 is supported by Wesleyan University and the John S. and James L. Knight Foundation. The Wesleyan Media Project is partnering again this year with OpenSecrets, to provide added information on outside group disclosure and candidate status, and we especially thank Brendan Glavin for his work.
The Wesleyan Media Project’s digital advertising tracking is supported by the contributions of students in Delta Lab, an interdisciplinary research collaborative focusing on computationally-driven and innovative analyses and visualizations of media messaging. We are also grateful to our Coding Supervisors Saul Ferholt-Kahn and Helen Xie, and the numerous student research assistants who facilitate additional content analysis of television and digital advertising.
Periodic releases of data will be posted on the project’s website and dispersed via LinkedIn, Bluesky @wesmediaproject.bsky.social and Twitter @wesmediaproject. To be added to our email update list, click here.
For more information contact: media@wesleyan.edu.
About Wesleyan University
Wesleyan University, in Middletown, Conn., is known for the excellence of its academic and co-curricular programs. With more than 2,900 undergraduates and 200 graduate students, Wesleyan is dedicated to providing a liberal arts education characterized by boldness, rigor and practical idealism. For more, visit www.wesleyan.edu.
About the John S. and James L. Knight Foundation
We are social investors who support democracy by funding free expression and journalism, arts and culture in community, research in areas of media and democracy, and in the success of American cities and towns where the Knight brothers once had newspapers. Learn more at kf.org and follow @knightfdn on social media.