
Cost of Living and Taxes Remain Top Issues in Federal Contests; $137M in AI Ads
(MIDDLETOWN, CT) October 15, 2026 – For several weeks, pro-Republican advertisers have outspent their Democratic rivals in U.S. Senate races, but that gap narrowed in our most recent analysis. Over the past two weeks (September 28 to October 11), Republican candidates benefitted from $267 million in ad spending compared to $196 million in spending on behalf Democratic candidates, a gap of $70 million. That gap, however, is smaller than the spending gap ($113 million) between the parties from the prior two-week period between September 14 to September 27.
“Republican cash has been dominating the most competitive Senate races since Labor Day, but Democrats are starting to catch up,” said Travis Ridout, co-director of the Wesleyan Media Project. “Because Republicans are depending more on outside groups than are Democrats in this cycle, they are paying more per ad. Thus, over the past two weeks, Democrats have been able to run comparable airings on broadcast television as Republicans.”
In Senate campaigns in the past two weeks, for example, there were 146,000 pro-Republican spots on broadcast compared to 122,000 pro-Democratic spots, an advantage of 24,000 airings. In the period between September 14 and 27, however, the totals were 131,000 pro-GOP spots to 87,000 pro-Democratic ads–an advantage of 44,000 for Republicans.
Table 1 shows spending by state in Senate races in the September 28 to October 11 time period. Several things are of note. First, just over $100 million has been spent in the Ohio Senate race. Ohio surpassed Texas for having the most expensive Senate race. Spending in favor of Democrat Sherrod Brown is up slightly from 36 percent of the total in our last release to 38 percent now. Second, although pro-Democratic spending lags pro-Republican spending in several states, pro-Democratic spending as a share of the total has increased in many states from our past report. Democratic candidates are benefitting from greater spending in Iowa, Georgia, North Carolina and Kansas, and spending is just about even in Michigan.
Also of note, spending in Minnesota remains scant–just $1.71 million in the past two weeks–in spite of public polls showing the race to be tight.
Finally, outside groups dominate the ad spending in those races, though in Georgia groups only account for about 48 percent of recent spending. This is still a significant share of ad spending, but it pales in comparison to the 82 percent of ad spending in the Ohio Senate race.
Table 1: Most Expensive Races for U.S. Senate (9/28/26 to 10/11/26)
(in $Ms) | (in $Ms) | (in $Ms) | (in $Ms) | |||
|---|---|---|---|---|---|---|
| OH | $100.17 | $6.88 | $0.01 | $82.38 | 82.2 | 38 |
| TX | $96.27 | $16.57 | $0.67 | $74.08 | 76.9 | 27 |
| MI | $49.56 | $6.11 | $0.73 | $35.68 | 72 | 49 |
| IA | $41.82 | $4.10 | $2.48 | $30.61 | 73.2 | 56.7 |
| ME | $34.24 | $4.45 | $1.07 | $27.23 | 79.5 | 46.1 |
| GA | $24.53 | $12.83 | $0.03 | $11.67 | 47.6 | 72.6 |
| AK | $22.52 | $2.44 | $0.48 | $17.77 | 78.9 | 47 |
| NH | $21.70 | $2.89 | $1.36 | $15.84 | 73 | 41 |
| NC | $16.54 | $5.46 | $0.42 | $9.64 | 58.3 | 63.7 |
| KS | $12.45 | $4.04 | $1.73 | $6.68 | 53.6 | 56.2 |
| NE | $10.62 | $1.11 | $8.63 | 81.2 | 0.5** | |
| FL | $8.78 | $0.38 | $3.68 | $3.96 | 45.1 | 4.3 |
| SC | $6.87 | $3.76 | $0.01 | $3.10 | 45.1 | 70.2 |
| MT | $3.69 | $0.52 | $2.86 | 77.4 | 0.0** | |
| AR | $3.06 | $0.33 | $1.86 | $0.87 | 28.3 | 10.7 |
| VA | $1.92 | $1.88 | $0.04 | 1.9 | 100 | |
| MN | $1.71 | $0.75 | $0.74 | $0.16 | 9.3 | 44 |
| MS | $1.68 | $0.42 | $0.98 | $0.29 | 17.1 | 39.2 |
| KY | $1.13 | $0.01 | $1.10 | $0.02 | 2.1 | 1.2 |
| SD | $1.11 | $0.51 | $0.43 | 38.5 | 0.0** | |
| CO | $0.58 | $0.32 | $0.00 | 0 | 55.5** | |
| ID | $0.48 | $0.48 | $0.00 | 0 | 0 | |
| NM | $0.45 | $0.45 | $0.00 | 0 | 100 | |
| LA | $0.41 | $0.05 | $0.37 | $0.00 | 0.3 | 11.3 |
| WV | $0.31 | $0.06 | $0.25 | 81.6 | 0.3 | |
| IL | $0.21 | $0.01 | $0.20 | $0.00 | 0.8 | 3.6 |
| RI | $0.07 | $0.07 | 0 | 100 | ||
| MA | $0.06 | $0.00 | $0.04 | $0.00 | 1 | 1.7 |
| TN | $0.05 | $0.01 | $0.04 | 79.4 | 0 | |
| WY | $0.02 | $0.02 | $0.00 | 0.2 | 0 | |
| OK | $0.02 | $0.02 | $0.00 | 3.8 | 0.2 | |
| NJ | $0.01 | $0.01 | 0 | 100 | ||
| AL | $0.00 | $0.00 | $0.00 | 87.6 | 0 | |
| DE | $0.00 | $0.00 | 0 | 100 | ||
| OR | $0.00 | $0.00 | 0 | 100 | ||
| Totals include broadcast, local cable, connected TV (CTV), digital (including Meta, Google, Snapchat and X), network cable, radio, satellite, and network broadcast. *Total spending will be greater in some rows than the sum of candidate and group spending because the total also includes any spending on party coordinated ads with candidates. **This percentage is the Democratic percentage of total. The total includes spending on behalf of the Independent candidate. CITE SOURCE OF DATA AS: AdImpact with analysis by the Wesleyan Media Project. |
||||||
Advertisers Move Out of North Carolina, Pouring Money into Kansas
There is evidence of shifting priorities in Senate races. In looking at the top-spending races, we compared spending totals in the two-week period between September 14 and 27 to the totals for the two-week period between September 28 and October 11. The greatest percentage change was in Kansas, where spending has jumped from $3.7 million in the earlier period to $12.5 million in the most recent period. That’s a jump of 237 percent. Spending in South Carolina saw a 115 percent increase.
“Campaigns and groups are now beginning to triage, taking money from races they presume to be lost and pumping money into the races that they believe are now on a knife’s edge–or that are trending in a more competitive direction,” said Michael Franz, co-director of the Wesleyan Media Project.
The greatest decline was in North Carolina, where ad spending dropped from $28.9 million to $16.5 million. That’s a decrease of 48 percent. No other state saw a drop in spending, but the increases in New Hampshire and Texas were minimal.
Table 2: Change in Spending from September to October by Senate Race
(in $Ms) | (in $Ms) | ||
|---|---|---|---|
| Texas | $89.00 | $96.27 | 8.2% |
| Ohio | $70.10 | $100.17 | 42.9% |
| Michigan | $43.90 | $49.56 | 12.9% |
| Iowa | $28.70 | $41.82 | 45.7% |
| Maine | $24.80 | $34.24 | 38.1% |
| Georgia | $21.10 | $24.53 | 16.3% |
| North Carolina | $28.90 | $16.54 | -48.2% |
| New Hampshire | $20.20 | $21.70 | 7.4% |
| Alaska | $18.40 | $22.52 | 22.4% |
| Nebraska | $8.00 | $10.62 | 32.8% |
| Kansas | $3.70 | $12.45 | 236.5% |
| Florida | $5.40 | $8.78 | 62.6% |
| South Carolina | $3.20 | $6.87 | 114.7% |
| Minnesota | $1.30 | $1.71 | 31.5% |
| Totals include broadcast, local cable, connected TV (CTV), digital (including Meta, Google, Snapchat and X), network cable, radio, satellite, and network broadcast. CITE SOURCE OF DATA AS: AdImpact with analysis by the Wesleyan Media Project. |
|||
Republican Senate Spots Decline in Past Week
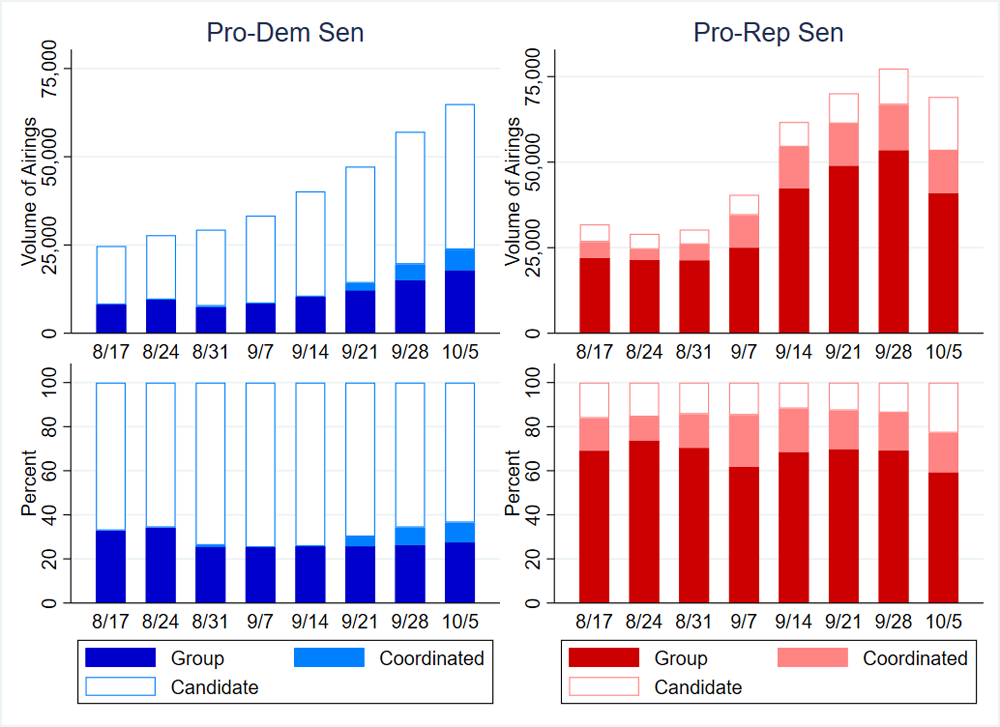
Figure 1 shows the volume of pro-Democratic and pro-Republican local broadcast ads aired each week by various sponsors since mid-August in Senate races (the top panel) and the percentage of these ads sponsored by each type of sponsor in each week (the bottom panels). Because political ad sponsors pay very different rates for broadcast spots (with candidates and parties paying the lowest unit rate), it is useful to look at volumes of airings instead of total ad spending. (Note that this analysis of broadcast spots does not consider the volume of ads on CTV platforms or cable television.)
One interesting finding is that the volume of pro-Republican ads in the Senate declined in the past week, dropping below the volume in the previous two weeks to just under 70,000 airings. By contrast, the volume of pro-Democratic ads in Senate races continues to climb. Still the number of pro-Republican ads (just over 69,000 airings) slightly exceeded the number of pro-Democratic ads in the past week (nearly 65,000 airings). All told, this is consistent with the broader analysis of spending above.
The results also demonstrate that while pro-Democratic advertising on broadcast stations is fueled by candidate spending, groups account for the vast majority of broadcast ads that favor Republican Senate candidates. While candidate spending accounted for over 63 percent of the local broadcast ads in the past week on the Democratic side, it accounted for not quite a quarter (23 percent) of broadcast ads on the Republican side.
Figure 1: Volume and Percentage of Senate Ads by Party and Sponsorship
Numbers include broadcast television for all sponsors.
CITE SOURCE OF DATA AS: AdImpact with analysis by the Wesleyan Media Project.
Democrats, Republicans Stay Evenly Matched in Top House Race Spending
Ad spending in House races remains robust, with 23 congressional districts featuring at least $5 million in ad spending over the last two weeks. Two races in Florida–the 25th congressional district and the 14th–have seen over $10 million in ads. Of the top 10 races, seven of them are listed by Inside Elections as toss-ups, with the other three grouped as competitive but titling slightly to the Democrat or Republican. These include NJ-07 (tilting Democratic), MI-10 (tilting Republican), and NC-01 (tilting Republican).
Outside groups remain heavily invested in House races, sponsoring over 60 percent of ad spending in 13 of the top-20 races. In that list of races, the lowest share of spending from outside groups is 40.1 percent in the CO08 race. As we report below, in the two week period covered in this report, outside groups account for 52 percent of ad spending in all House races.
Table 3: Most Expensive Races for U.S. House (9/28/26 to 10/11/26)
(in $Ms) | (in $Ms) | (in $Ms) | (in $Ms) | |||
|---|---|---|---|---|---|---|
| FL25 | $11.50 | $0.56 | $0.04 | $8.43 | 73.3 | 42.9 |
| FL14 | $10.76 | $0.37 | $0.04 | $7.79 | 72.4 | 38.5 |
| NJ07 | $8.79 | $1.18 | $1.25 | $4.91 | 55.8 | 32.2 |
| WI03 | $8.72 | $1.49 | $1.04 | $4.07 | 46.6 | 49 |
| NY17 | $8.47 | $1.16 | $0.47 | $3.71 | 43.8 | 48 |
| CO08 | $8.43 | $1.04 | $1.10 | $3.38 | 40.1 | 47.8 |
| MI10 | $8.16 | $0.25 | $0.00 | $5.61 | 68.7 | 45.3 |
| NC01 | $7.99 | $0.94 | $0.18 | $5.02 | 62.8 | 45.8 |
| MI07 | $7.88 | $0.97 | $0.59 | $5.05 | 64.2 | 50.4 |
| CA22 | $7.72 | $0.54 | $0.32 | $5.06 | 65.5 | 55.5 |
| AZ01 | $7.71 | $0.94 | $0.53 | $3.87 | 50.1 | 36.9 |
| TX34 | $7.61 | $0.35 | $0.21 | $5.23 | 68.7 | 48.8 |
| PA07 | $7.17 | $0.67 | $0.80 | $4.57 | 63.7 | 39.4 |
| OH07 | $7.02 | $0.29 | $0.45 | $5.64 | 80.4 | 65 |
| IA01 | $6.82 | $0.93 | $1.21 | $3.29 | 48.2 | 41.4 |
| WA03 | $6.52 | $0.38 | $0.11 | $4.07 | 62.4 | 42.6 |
| NY03 | $6.15 | $1.13 | $0.25 | $3.23 | 52.5 | 32.5 |
| NC11 | $6.06 | $0.65 | $0.05 | $3.65 | 60.3 | 53.9 |
| TX28 | $5.99 | $0.26 | $0.06 | $4.02 | 67.2 | 39.8 |
| ME02 | $5.67 | $0.42 | $0.32 | $4.53 | 79.9 | 52.7 |
| NM02 | $5.53 | $0.57 | $0.37 | $3.37 | 60.9 | 42.9 |
| VA02 | $5.48 | $0.99 | $0.67 | $2.87 | 52.2 | 38.8 |
| PA10 | $5.47 | $0.52 | $0.85 | $2.77 | 50.6 | 49.8 |
| CA13 | $4.97 | $0.49 | $0.04 | $3.34 | 67.3 | 23.1 |
| TX15 | $4.57 | $0.40 | $0.27 | $2.61 | 57.2 | 54.9 |
| MI04 | $4.54 | $0.75 | $0.44 | $2.79 | 61.3 | 35.8 |
| IA03 | $4.45 | $0.88 | $0.73 | $1.81 | 40.6 | 44.8 |
| AZ06 | $4.27 | $0.79 | $0.32 | $2.05 | 47.9 | 49 |
| PA08 | $4.27 | $0.39 | $0.58 | $2.48 | 58.2 | 45.5 |
| OH09 | $4.23 | $0.46 | $0.17 | $2.32 | 54.7 | 38.9 |
| CA48 | $4.01 | $0.53 | $0.23 | $1.57 | 39 | 80.7 |
| FL22 | $3.88 | $1.12 | $0.41 | $1.90 | 49 | 77.8 |
| AK01 | $3.48 | $0.18 | $2.52 | 72.5 | 7.6** | |
| IA02 | $3.27 | $0.70 | $0.16 | $1.64 | 50.2 | 41.3 |
| MT01 | $3.10 | $0.59 | $0.27 | $2.00 | 64.4 | 49.9 |
| VA01 | $2.87 | $0.66 | $1.09 | $0.49 | 16.9 | 57.3 |
| KY06 | $2.65 | $0.37 | $0.18 | $1.82 | 68.6 | 51.1 |
| TX35 | $2.63 | $0.48 | $0.01 | $1.84 | 70 | 28.1 |
| WI01 | $2.51 | $0.17 | $1.19 | $0.40 | 15.8 | 38 |
| OH01 | $2.48 | $0.48 | $0.10 | $1.60 | 64.6 | 26 |
| MN01 | $2.44 | $0.46 | $0.54 | $1.43 | 58.8 | 74.5 |
| PA01 | $2.36 | $0.55 | $0.80 | $0.67 | 28.6 | 55.9 |
| OH10 | $2.08 | $0.08 | $0.23 | $1.77 | 85.2 | 66 |
| FL13 | $2.03 | $0.37 | $0.41 | $1.00 | 49.1 | 73.1 |
| MI08 | $2.00 | $0.80 | $0.03 | $1.18 | 58.9 | 42.3 |
| CO05 | $1.89 | $0.48 | $0.54 | $0.46 | 24.5 | 49.7 |
| NE02 | $1.86 | $0.50 | $0.30 | $0.68 | 36.5 | 60.7 |
| AZ02 | $1.72 | $0.66 | $0.56 | $0.50 | 28.8 | 38.7 |
| CA04 | $1.72 | $1.64 | $0.08 | 4.5 | 100 | |
| NV03 | $1.69 | $0.93 | $0.63 | $0.00 | 0.1 | 54.8 |
| AL02 | $1.68 | $0.11 | $0.00 | $1.04 | 61.7 | 54.9 |
| CA06 | $1.56 | $0.09 | $0.50 | 32.1 | 65.7 | |
| NY21 | $1.50 | $0.70 | $0.81 | 0 | 46.3 | |
| AR02 | $1.46 | $0.61 | $0.85 | 58.5 | 16.1 | |
| NV01 | $1.30 | $0.56 | $0.37 | $0.00 | 0.2 | 43 |
| LA06 | $1.29 | $0.52 | $0.76 | 59.2 | 0 | |
| MO02 | $1.22 | $0.31 | $0.92 | 0 | 25.1 | |
| CA40 | $1.20 | $0.75 | $0.45 | 37.4 | 0 | |
| VA07 | $1.20 | $1.20 | 0 | 100 | ||
| FL09 | $1.20 | $0.43 | $0.04 | $0.00 | 0 | 66.1 |
| NH01 | $1.18 | $0.10 | $0.87 | $0.01 | 1.2 | 12.1 |
| SC01 | $1.07 | $0.56 | $0.06 | $0.45 | 41.9 | 52.6 |
| CO04 | $1.05 | $1.00 | $0.06 | 5.4 | 95.2 | |
| NV02 | $0.96 | $0.21 | $0.06 | $0.69 | 72.1 | 21.7 |
| OH15 | $0.95 | $0.15 | $0.43 | $0.36 | 38.2 | 44 |
| CO03 | $0.93 | $0.18 | $0.48 | $0.27 | 29.4 | 19.4 |
| IN05 | $0.88 | $0.19 | $0.31 | $0.38 | 42.9 | 65.2 |
| VA05 | $0.87 | $0.56 | $0.18 | $0.13 | 14.6 | 65.6 |
| NE01 | $0.84 | $0.12 | $0.37 | $0.35 | 41.6 | 56 |
| TN09 | $0.78 | $0.41 | $0.12 | $0.24 | 31 | 84.3 |
| CA11 | $0.77 | $0.31 | $0.46 | 60.3 | 87.6 | |
| CA07 | $0.76 | $0.51 | $0.25 | 32.5 | 100 | |
| TX23 | $0.70 | $0.62 | $0.09 | 12.1 | 0 | |
| LA04 | $0.68 | $0.08 | $0.59 | 0 | 12.5 | |
| OH13 | $0.67 | $0.65 | $0.02 | 2.8 | 99.5 | |
| MI01 | $0.60 | $0.32 | $0.28 | 0 | 52.9 | |
| OR05 | $0.57 | $0.24 | $0.00 | $0.18 | 32.3 | 99.9 |
| MA01 | $0.54 | $0.36 | 0 | 66.9** | ||
| TN05 | $0.52 | $0.46 | $0.06 | $0.00 | 0 | 88.3 |
| Totals include broadcast, local cable, connected TV (CTV), digital (including Meta, Google, Snapchat and X), network cable, radio, satellite, and network broadcast. *Total spending will be greater in some rows than the sum of candidate and group spending because the total also includes any spending on party coordinated ads with candidates. **This percentage is the Democratic percentage of total. The total includes spending on behalf of the Independent candidate. CITE SOURCE OF DATA AS: AdImpact with analysis by the Wesleyan Media Project. |
||||||
House Ad Volumes on Broadcast Stations Favor Democrats
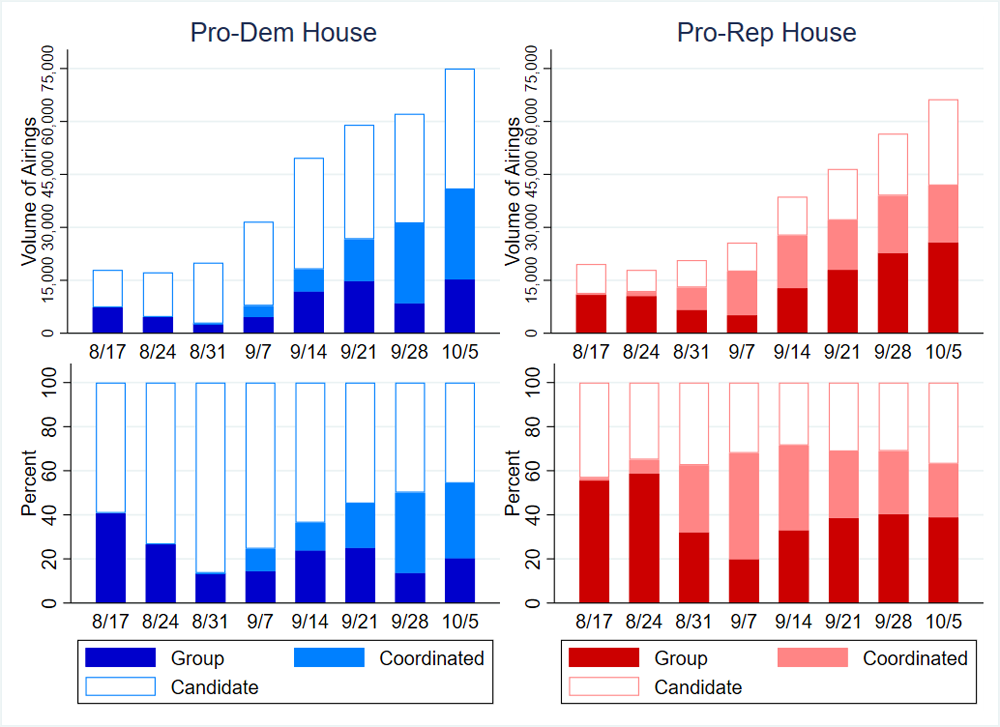
Unlike in the Senate, ad volumes continue to increase for both parties in the House week by week (Figure 2), but in the House, pro-Democratic ads on broadcast stations have outnumbered pro-Republican ads for more than the past month. In addition, the partisan gap in sponsorship is much less evident in the House, especially in the most recent week. Coordinated spending has become a big source of pro-Democratic ad airings in the past two weeks, and in recent weeks groups have accounted for about 20 percent or less of the airings on the Democratic side.
Figure 2: Volume and Percentage of House Ads by Party and Sponsorship
Numbers include broadcast television for all sponsors.
CITE SOURCE OF DATA AS: AdImpact with analysis by the Wesleyan Media Project.
OH, TX, and GA Most Expensive Gov Races
The race for governor of Ohio was the most expensive in the country over the past two weeks, followed closely by the races in Texas and Georgia (Table 4). Ohio spending topped $27 million, with spending in Texas and Georgia at over $26 million. The Republican spending advantage in all three of these races was considerable, with ads favoring the Democrat in Texas accounting for only 17 percent of total ad spending in the past two weeks. In Georgia, only 24 percent of advertising favored the Democratic candidate, while in Ohio it was 31 percent.
However, pro-Democratic advertisers outspent pro-Republican advertisers in some of the less expensive gubernatorial races, including those in Iowa, Michigan, New York and Arizona.
Table 4: Most Expensive Races for Governor (9/28/26 to 10/11/26)
(in $Ms) | Spend (in $Ms) | Spend (in $Ms) | Spend (in $Ms) | |||
|---|---|---|---|---|---|---|
| OH | $27.03 | $4.83 | $7.76 | $14.43 | 53.4 | 31.3 |
| TX | $26.93 | $4.50 | $22.44 | $0.00 | 0 | 16.7 |
| GA | $26.47 | $0.06 | $20.17 | $0.36 | 1.4 | 23.7 |
| WI | $19.48 | $3.93 | $7.11 | $8.44 | 43.3 | 35.5 |
| FL | $16.53 | $0.76 | $1.40 | $0.25 | 1.5 | 9.1 |
| NV | $12.86 | $1.07 | $1.26 | $10.50 | 81.6 | 34 |
| IA | $10.80 | $6.24 | $4.41 | $0.15 | 1.4 | 57.8 |
| MI | $10.69 | $2.11 | $0.20 | $8.38 | 78.4 | 76.9 |
| NY | $9.09 | $4.97 | $3.12 | $1.00 | 11 | 65.6 |
| AZ | $7.80 | $0.23 | $0.11 | $3.53 | 45.2 | 50.6 |
| PA | $7.07 | $7.01 | $0.05 | $0.01 | 0.1 | 99.2 |
| CA | $6.44 | $6.40 | $0.01 | $0.02 | 0.3 | 99.8 |
| KS | $5.10 | $0.44 | $0.48 | $4.18 | 81.9 | 30.1 |
| OR | $5.03 | $2.97 | $2.06 | $0.00 | 0 | 58.9 |
| TN | $4.97 | $0.17 | $0.80 | $2.07 | 41.6 | 3.4** |
| MN | $4.15 | $1.12 | $0.26 | $1.61 | 38.9 | 40.7 |
| IL | $3.83 | $3.83 | $0.00 | 0 | 99.9 | |
| CT | $3.48 | $1.32 | $2.17 | $0.00 | 0 | 37.8 |
| MA | $3.04 | $1.79 | $1.11 | $0.14 | 4.7 | 64.1 |
| AL | $2.82 | $0.82 | $1.97 | $0.04 | 1.3 | 29.1 |
| ME | $2.30 | $0.60 | $0.03 | $1.67 | 72.7 | 98.7 |
| NE | $2.07 | $0.68 | $1.23 | $0.15 | 7.3 | 33.2 |
| MD | $1.43 | $1.41 | $0.03 | $0.00 | 0 | 98.2 |
| NH | $1.27 | $0.17 | $1.10 | 0 | 13.6 | |
| NM | $1.16 | $0.89 | $0.07 | $0.21 | 17.8 | 93.1 |
| AR | $1.07 | $1.07 | 0 | 0 | ||
| OK | $0.55 | $0.02 | $0.53 | 96.8 | 0 | |
| AK | $0.54 | $0.36 | $0.10 | $0.09 | 15.8 | 70.3 |
| CO | $0.39 | $0.39 | $0.00 | 0.1 | 100 | |
| RI | $0.37 | $0.37 | $0.00 | $0.00 | 0 | 99.5 |
| VT | $0.25 | $0.07 | $0.12 | $0.05 | 21 | 29.5 |
| HI | $0.23 | $0.17 | $0.01 | $0.05 | 21.6 | 97.3 |
| SC | $0.19 | $0.01 | $0.18 | $0.00 | 0.2 | 5.5 |
| MS | $0.15 | $0.15 | 0 | 0 | ||
| ID | $0.11 | $0.11 | 0 | 0 | ||
| SD | $0.06 | $0.03 | $0.03 | $0.00 | 0.5 | 51.4 |
| WY | $0.00 | $0.00 | $0.00 | 74.9 | 0 | |
| Totals include broadcast, local cable, connected TV (CTV), digital (including Meta, Google, Snapchat and X), network cable, radio, satellite, and network broadcast. *Total spending will be greater in some rows than the sum of candidate and group spending because the total also includes any spending on party coordinated ads with candidates. **This percentage is the Democratic percentage of total. The total includes spending on behalf of the Independent candidate. CITE SOURCE OF DATA AS: AdImpact with analysis by the Wesleyan Media Project. |
||||||
$1 Billion in Ad Spending in Last Two Weeks; Broadcast Ads Account for 60 Percent
As has become a pattern this cycle, we see about $1 billion in ad spending over the last two weeks in House, Senate and gubernatorial races. This brings the cycle-to-date ad spending to $5.7 billion in these races.
We also see an uptick in broadcast ad spending in recent weeks. In the period covered by our last report (between Labor Day and September 27), 58 percent of ad spending was on broadcast. In the two weeks covered in this report, the share of ad spending on local broadcast jumped to 62 percent. In the cycle to date, broadcast spending makes up 50 percent of total ad dollars. These totals suggest that political ad sponsors are shifting dollars to traditional live broadcast in the closing weeks of the campaign.
In total, outside groups have dominated ad spending in congressional races in the last several weeks, out-pacing candidate spending over 3:1 in Senate races and about 2:1 in House races.
Table 5: Spending by Office, Sponsor Type and Media Channel (9/28/26 to 10/11/26)
(in $Ms) | (in $Ms) | (in $Ms) | (in $Ms) | (in $Ms) | (in $Ms) |
||
|---|---|---|---|---|---|---|---|
| Governor | Candidate | 79.81 | 34.42 | 13.87 | 10.58 | 4.1 | 142.78 |
| Group | 36.24 | 9.35 | 4.96 | 5.35 | 1.95 | 57.85 | |
| Coordinated | 15.3 | 7.01 | 0.4 | 2.21 | 0.19 | 25.12 | |
| Senate | Candidate | 48.82 | 22.68 | 16.96 | 4.51 | 3.25 | 96.22 |
| Group | 199.9 | 65.02 | 26.29 | 21.83 | 19.2 | 332.23 | |
| Coordinated | 23.68 | 6.59 | 0.08 | 3.1 | 1.15 | 34.6 | |
| House | Candidate | 51.45 | 16.18 | 7.32 | 7.09 | 1.89 | 83.92 |
| Group | 105.36 | 23.47 | 13.74 | 6.98 | 4.16 | 153.7 | |
| Coordinated | 46.97 | 8.2 | 0.14 | 1.85 | 0.39 | 57.54 | |
| Total | $607.53 | $192.92 | $83.76 | $63.49 | $36.27 | $983.97 | |
| % | 61.7% | 19.6% | 8.5% | 6.5% | 3.7% | ||
| Other includes network cable, radio, satellite, and network broadcast CTV includes spending on streaming, CTV devices and in-app ads. Digital includes spending on Meta, Google, Snapchat, and X CITE SOURCE OF DATA AS: AdImpact with analysis by the Wesleyan Media Project. |
|||||||
Figure 3: Advertising Spending by Office, Party, and Platform (9/28/26 to 10/11/26)
Other includes network cable, radio, satellite, and network broadcast
CTV includes spending on streaming, CTV devices and in-app ads.
Digital includes spending on Meta, Google, Snapchat, and X
CITE SOURCE OF DATA AS: AdImpact with analysis by the Wesleyan Media Project.
But as we noted at the outset of this report, outside groups pay more for broadcast ads. In Table 6 below, we break out sponsorship of broadcast ads by spots and by spending. In House races, groups account for 52 percent of broadcast spending but 28 percent of ad airings. In Senate races, outside groups account for 73 percent of broadcast ad spending but 48 percent of Senate spots aired.
Because candidate-sponsored ads and candidate-party coordinated spots are eligible for the lowest unit rate on broadcast stations, they account for a higher share of spots relative to their share of spending. For example, candidate-party coordinated ads total 23 percent of House ad spending but 30 percent of spots aired.
Still, in looking at the group and candidate spending on CTV, Digital, and local cable–places where the lowest unit rate does not apply and ad sponsors pay what the market will bear–groups are still outspending candidates. For example, groups have spent 3:1 on CTV in Senate races compared to candidates and over 5:1 on local cable. In House races, the gaps are smaller but still significant on CTV, digital, and in the column for Other media. This suggests that the spending gap is not just a per-ad difference across sponsors but a volume difference that extends beyond broadcast stations.
Table 6: Broadcast Airings by Office and Sponsor Type (9/28/26 to 10/11/26)
(in $Ms) | spending | Airings | airings |
|
|---|---|---|---|---|
| Governor | ||||
| Candidate | 79.81 | 60.8% | 154,556 | 77.0% |
| Group | 36.24 | 27.6% | 23,818 | 11.9% |
| Coordinated | 15.3 | 11.6% | 22,239 | 11.1% |
| Total | 131.35 | 200,613 | ||
| Senate | ||||
| Candidate | 48.82 | 17.9% | 106,871 | 39.1% |
| Group | 199.9 | 73.4% | 130,365 | 47.7% |
| Coordinated | 23.68 | 8.7% | 35,957 | 13.2% |
| Total | 272.4 | 273,193 | ||
| House | ||||
| Candidate | 51.45 | 25.2% | 109,789 | 41.5% |
| Group | 105.36 | 51.7% | 74,667 | 28.2% |
| Coordinated | 46.97 | 23.1% | 80,033 | 30.3% |
| Total | 203.78 | 264,489 | ||
| Numbers include broadcast television for all sponsors. CITE SOURCE OF DATA AS: AdImpact with analysis by the Wesleyan Media Project. |
||||
Cost of Living and Taxes Continue to Top Issues in Federal Contests
In the Senate, pro-Democratic ads continue to hammer on cost of living issues (23 percent) while pro-Republican ads attack Democrats for raising taxes (22 percent) over the last two weeks. Beyond the shared discussion of economics through different frames in the top issue, however, the parties in Senate contests are taking different tactics after that. Pro-Democratic airings express concern for and support of business (22 percent) and attack Republicans on the cost of health care (18 percent) and energy (16 percent). Roughly one out of every ten pro-Democratic ads hammers on corruption, ethical violations, and the need for campaign finance reform.
Anti-trans attacks have continued in these past two weeks in 14 percent of pro-Republican Senate airings while discussion of crime, policing and domestic violence and sexual assault occur in just under one in ten airings. Immigration mentions have fallen to only seven percent.
Table 7: Top Issues in U.S. Senate Races (9/28/26 to 10/11/26)
| Cost of living | 23.0% | Taxes | 22.1% |
| Business | 21.8% | Anti-trans | 14.0% |
| Health Care (not Rx drugs) | 18.4% | Crime | 9.4% |
| Energy Policy | 16.0% | Police brutality / racial violence | 9.1% |
| Government Ethics / Scandal | 12.6% | Dom. violence/sexual assault | 8.3% |
| Campaign Finance Reform | 10.2% | Cost of living | 7.5% |
| Crime | 7.2% | Immigration | 7.0% |
| Taxes | 6.1% | Moral / Family / Religious Values | 6.7% |
| Moral / Family / Religious Values | 5.1% | Incarceration / Sentencing | 6.2% |
| Employment / Jobs | 5.1% | Health Care (not Rx drugs) | 5.6% |
| Based on ongoing Wesleyan Media Project classification of transcribed audio from broadcast advertising only, which may differ from final coding. CITE SOURCE OF DATA AS: AdImpact with analysis by the Wesleyan Media Project. |
|||
In the House, top issues on the Democratic side over the past two weeks are cost of living concerns and health care, while on the Republican side, discussions of taxes and government ethics and scandal top the list. By and large, advertisers are avoiding the issue of abortion–a key theme in the 2022 midterm elections. Abortion does not appear in the top ten for either party in either the Senate or the House.
Table 8: Top Issues in U.S. House Races (9/28/26 to 10/11/26)
| Cost of living | 20.8% | Taxes | 19.4% |
| Health Care (not Rx drugs) | 16.3% | Government Ethics / Scandal | 13.5% |
| Business | 14.2% | Business | 10.1% |
| Energy Policy | 10.0% | Moral / Family / Religious Values | 10.0% |
| Taxes | 9.0% | Cost of living | 9.6% |
| Moral / Family / Religious Values | 8.7% | Health Care (not Rx drugs) | 7.7% |
| Government Ethics / Scandal | 8.4% | Energy Policy | 7.0% |
| Veterans | 7.4% | Crime | 6.0% |
| Prescription Drugs | 6.4% | Employment / Jobs | 5.7% |
| Campaign Finance Reform | 5.6% | Veterans | 5.0% |
| Employment / Jobs | 5.2% | Police Brutality / Racial Violence | 4.8% |
| Immigration | 4.9% | Immigration | 4.8% |
| Based on ongoing Wesleyan Media Project classification of transcribed audio from broadcast advertising only, which may differ from final coding. CITE SOURCE OF DATA AS: AdImpact with analysis by the Wesleyan Media Project. |
|||
Broadcast Airings at All-Time High in Congressional Races; though 2020 Senate Still Has Top Spot
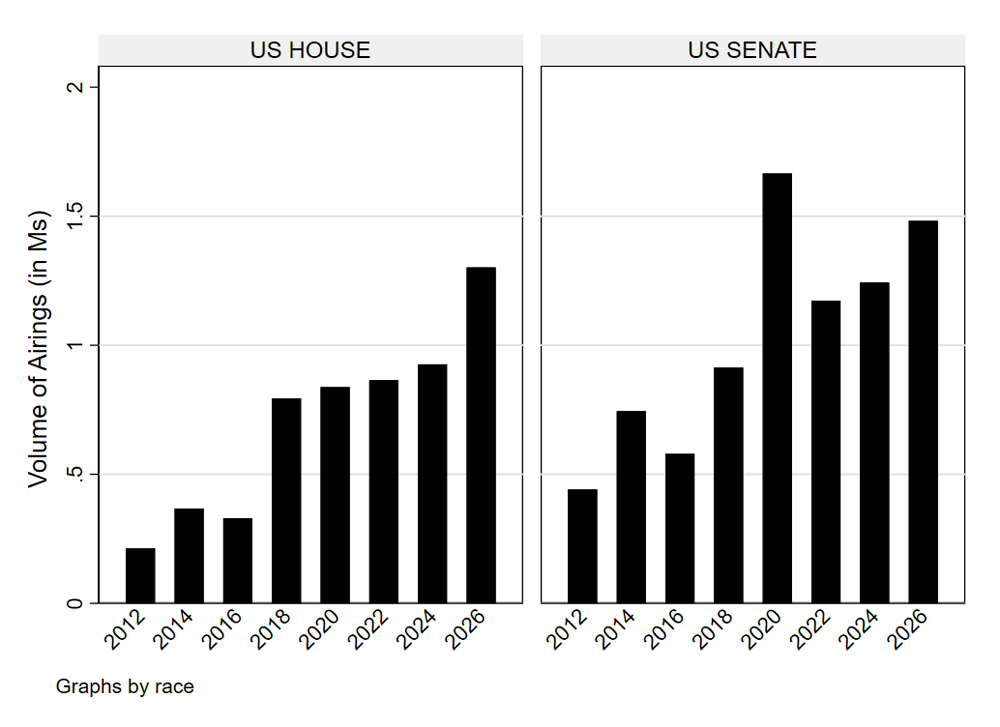
We also compare broadcast ad volume in each election cycle since 2012 in Figure 4. The figure covers the full cycle until October 11 in each election year. In 2026, broadcast spots in House races significantly out-pace prior cycles, smashing the previous record from 2024. More specifically, over 1.3 million airings have run this year compared to 2024, which saw just under 926,000, an increase of nearly 41 percent. In Senate races, the 2020 election at 1.67 million airings still leads the pack, but the volume of ads in 2026 comes in second, totalling just under 1.5 million broadcast spots to-date.
Figure 4: Broadcast Airings in Congressional Races (cycle-to-date), 2012 to 2026
Numbers include broadcast television for all sponsors.
CITE SOURCE OF DATA AS: Vivvix/CMAG and AdImpact with analysis by the Wesleyan Media Project.
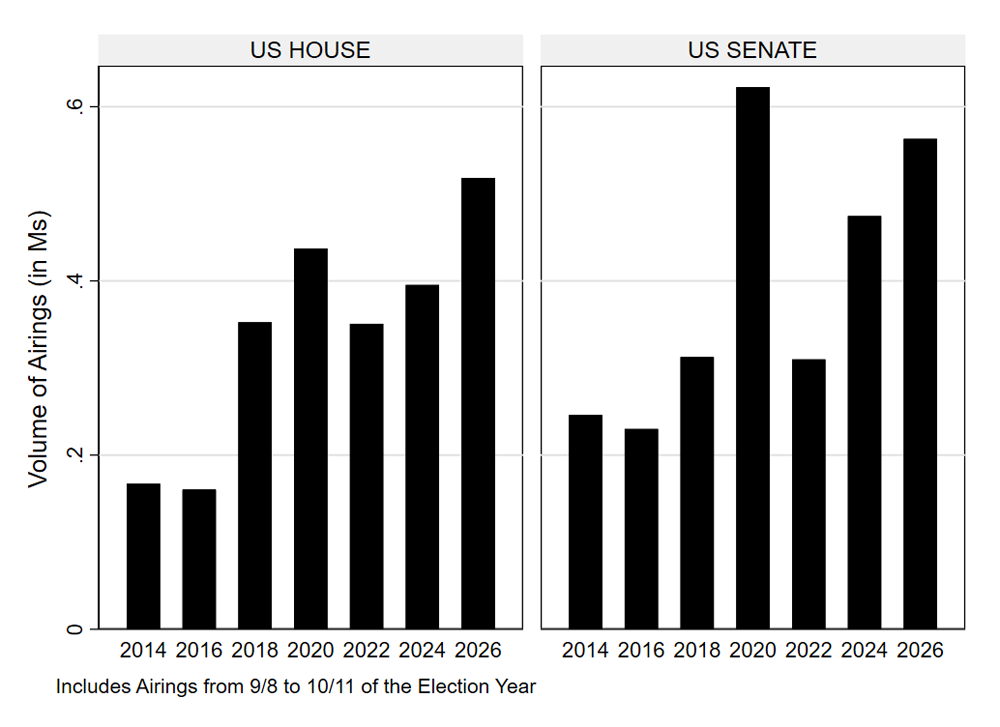
Figure 5 shows the volume of broadcast ads in each election cycle since 2014 for the comparable two week period. We see a similar pattern as above, with new records for 2026 House spots and near-record totals in Senate campaigns.
Figure 5: Broadcast Airings in Congressional Races (9/28 to 10/11), 2014 to 2026
Numbers include broadcast television for all sponsors.
CITE SOURCE OF DATA AS: Vivvix/CMAG and AdImpact with analysis by the Wesleyan Media Project.
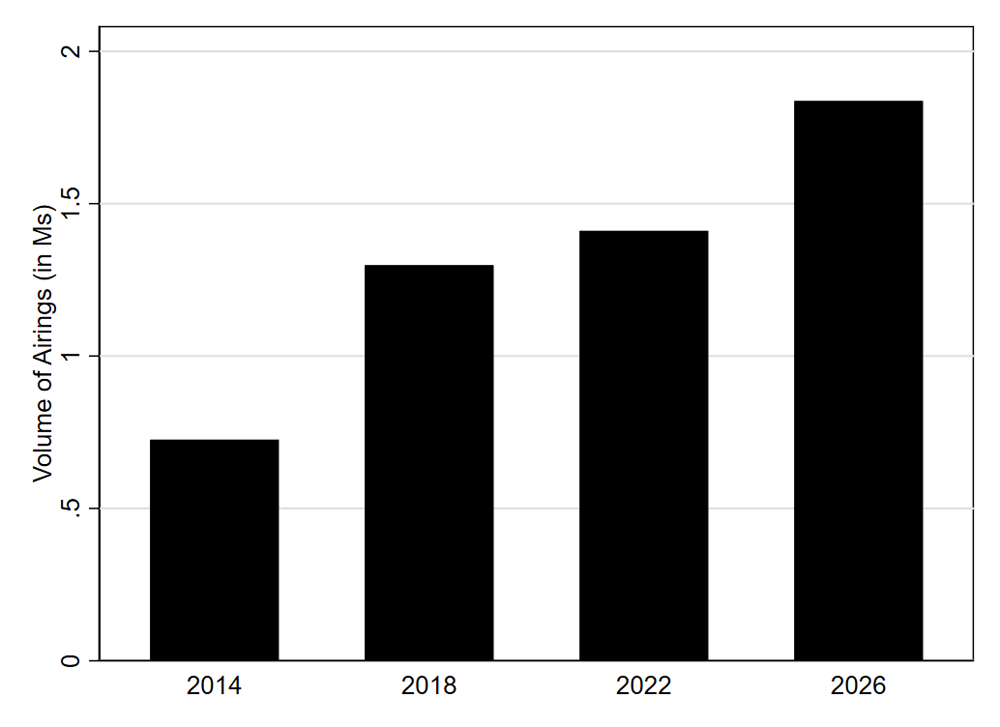
Figure 6 looks at gubernatorial spots back to 2014, and we find record ad volumes here too. Ads on broadcast stations have passed 1.8 million in the cycle to-date, well past the 2018 and 2022 numbers up to October 11 in each cycle, an increase of 30% over the prior 2022 record.
Figure 6: Broadcast Airings in Gubernatorial Races (cycle-to-date), 2014 to 2026
Numbers include broadcast television for all sponsors.
CITE SOURCE OF DATA AS: Vivvix/CMAG and AdImpact with analysis by the Wesleyan Media Project.
Pro-Trump “US Government” Ads Total $22M
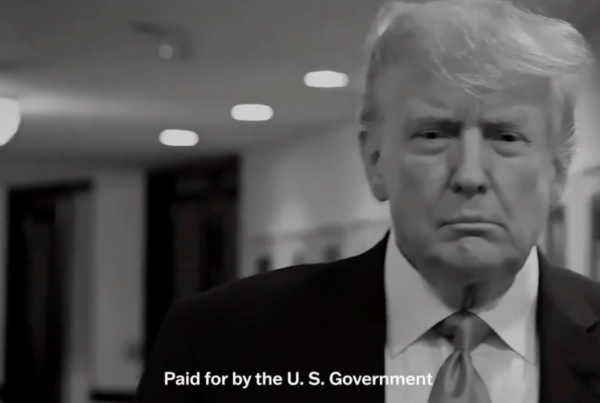
Since late September, five unique ads have aired on broadcast and cable stations that tout President Trump and his administration. These ads have a disclaimer that says they are paid for by the U.S. Government. Spending on these ads totaled over $22 million as of October 12.
The most recent ad started airing on October 6 and recounted the arrest and detention of Venezuelan President Nicolas Maduro. It features Secretary of State Marco Rubio saying at a press conference: “I think people need to understand that this is not a president [referring to Trump] that just talks and does letters and press conferences…if he says he’s serious about something, he means it…. Don’t play games while this president’s in office.”
Most of these ads, instead of airing in individual media markets, aired nationally on news shows like Good Morning America, Face the Nation, and the network evening news shows.
Campaigns Spend More Than $137 Million on AI-generated Ads
The Wesleyan Media Project has been tracking ads that were generated–at least in part–by using AI tools. We now count 220 such ads in our database on which more than $137 million has been spent, and that is almost certainly an undercount given that it is difficult to detect uses of AI.
“AI is making its way into the 2026 midterms in a big way this year. For comparison, we identified less than $50,000 in spending on AI-generated ads in the 2024 cycle,” said Erika Franklin Fowler, co-director of the Wesleyan Media Project. “Much of the AI use is not disclosed through any type of disclaimer.”
Consistent with our earlier reports, Republican sponsors are much more likely to use AI than Democratic sponsors. We find that 81 percent of AI-generated ads were sponsored by Republican candidates or groups, while only 12 percent of the ads were sponsored by Democrats. The remaining ads were sponsored by independent candidates or groups weighing in on issues that are not ostensibly partisan. Republican-affiliated sponsors also account for 88 percent of the spending on these ads.
AI-generated ads have appeared across the country, showing up in 34 different states. Twenty-seven percent of them contain a disclaimer.
We rely on our coders, the presence of disclaimers and ad tagging by AdImpact to identify ads that were created using AI, though sometimes it is difficult to discern whether an image was created by AI or not. In these instances when we were unsure, we do not place the ad in our database, and so our estimates of ad counts and spending are likely on the low side.
About the Data
Advertising spending data reported here for 2025-2026 come from AdImpact with analysis by the Wesleyan Media Project. All cost estimates for ad spending by medium use AdImpact’s methodology.
The CTV category includes ads distributed over devices where an input is connected to a television (e.g., Apple TV, PlayStation, etc), streaming via set-top-boxes, including video on demand (e.g., Dish or XFINITY streaming) and in apps available on smart TVs (e.g., YouTube or the Hulu app, etc).
Advertising historical airings data reported here come from original Wesleyan Media Project analysis of Vivvix/CMAG data for the 2012-2024 cycles and AdImpact for the current cycle.
Advertising content information on issue focus comes from ongoing Wesleyan Media Project trained classifiers applied to transcribed audio from 2026 cycle broadcast advertising and data on Trump mentions for this release also come from textual searches of transcribed audio, both of which may differ from final coding incorporating additional visual elements. In this case, our issue classifiers utilize machine learning methods to rate text trained from prior human, hand-coded data. Testing indicates an average precision of roughly 0.72, indicating a fairly high degree of human-machine reliability, though this varies by issue domain and should be interpreted cautiously.
AI in ads tracking reported here comes from the Wesleyan Media Project’s original assessment of election advertising that either explicitly states in a disclaimer that it uses AI, has been reported by news media and/or by AdImpact to include AI-generated or AI-enhanced content, or has been flagged by our coding staff as likely to be incorporating AI and been confirmed by our team. Our goal is to assess known prevalence over time. We rely on AdImpact estimated spending for each ad identified. This tracking is undoubtedly an underestimate given there are a lot of ways in which AI might be incorporated that may go undetected.
About this Report
The Wesleyan Media Project provides real-time tracking and analysis of all political television advertising in an effort to increase transparency in elections. Housed in Wesleyan’s Hazel Quantitative Analysis Center – part of the Allbritton Center for the Study of Public Life – the Wesleyan Media Project is the successor to the Wisconsin Advertising Project, which disbanded in 2009. It is directed by Erika Franklin Fowler, professor of government at Wesleyan University, Michael M. Franz, professor of government at Bowdoin College and Travis N. Ridout, professor of political science at Washington State University. WMP personnel include Breeze Floyd (Program Manager), Pavel Oleinikov (Associate Director, QAC), and Donny Snyder (Post-Doctoral Fellow).
The Wesleyan Media Project’s real-time tracking in 2026 is supported by Wesleyan University and the John S. and James L. Knight Foundation. The Wesleyan Media Project is partnering again this year with OpenSecrets, to provide added information on outside group disclosure and candidate status, and we especially thank Brendan Glavin for his work.
The Wesleyan Media Project’s digital advertising tracking is supported by the contributions of students in Delta Lab, an interdisciplinary research collaborative focusing on computationally-driven and innovative analyses and visualizations of media messaging. We are also grateful to our Coding Supervisors Saul Ferholt-Kahn and Helen Xie, and the numerous student research assistants who facilitate additional content analysis of television and digital advertising.
Periodic releases of data will be posted on the project’s website and dispersed via LinkedIn, Bluesky @wesmediaproject.bsky.social and Twitter @wesmediaproject. To be added to our email update list, click here.
For more information contact: media@wesleyan.edu.
About Wesleyan University
Wesleyan University, in Middletown, Conn., is known for the excellence of its academic and co-curricular programs. With more than 2,900 undergraduates and 200 graduate students, Wesleyan is dedicated to providing a liberal arts education characterized by boldness, rigor and practical idealism. For more, visit www.wesleyan.edu.
About the John S. and James L. Knight Foundation
We are social investors who support democracy by funding free expression and journalism, arts and culture in community, research in areas of media and democracy, and in the success of American cities and towns where the Knight brothers once had newspapers. Learn more at kf.org and follow @knightfdn on social media.