TV Shatters Records, Dems Lead Ad War in All Top Senate Races
Report Highlights
President
- Top TV spenders in the presidential race (Table 1)
- Digital spending by Trump and Biden (Table 2)
- Compare geographic spend on TV (Figure 1) and Facebook (Figure 3)
- Tone of presidential TV ads (Figures 6 and 7)
US Senate
- Top TV spenders in US Senate races (Table 5)
- Digital spending in US Senate races (Table 6)
- Top issues in US Senate TV ads (Table 8)
US House
Other Highlights
- Cycle-to-date ad totals (Figures 10, 11, and 12)
- Top outside groups (Table 12)
- Dark money in federal races (Table 13)
- Interactive tables of Facebook advertisers that are mentioning presidential and Senate candidates in their ads (Tables 14 and 15)
(MIDDLETOWN, CT) October 15, 2020 – A new analysis from the Wesleyan Media Project, in conjunction with the Center for Responsive Politics, finds that federal election contests on television have seen roughly 4.5 million ad airings totaling about $2.5 billion dollars cycle-to-date. Nearly 2 million of the airings have occurred in the presidential race alone (an increase of 147% over 2016) at an estimated cost of $1.3 billion. On digital, presidential candidates, their leadership PACs and single-candidate SuperPACs have spent an additional $615 million on Facebook and Google since January 2019.
Looking at the past few weeks, ads supporting Joe Biden continue to rule the airwaves. From September 28 through October 11, Biden’s campaign has spent $56 million on 80,000 television ad airings, while Donald Trump’s campaign has spent $32 million on 32,000 ad airings (Table 1). FF PAC, has spent $18 million in the past two weeks on 16,000 anti-Trump airings, while Independence USA PAC, a group connected with Michael Bloomberg, has spent $8.7 million on 8,700 ad airings.
The most active pro-Trump groups on television include America First Action, with $10.5 million of spending on 8,800 airings, and Preserve America PAC, with $15.7 million in spending on 7,400 ad airings. All told, there has been $102 million in pro-Biden ad spending over the past two weeks compared to $61 million in pro-Trump ad spending. Since April 9, there has been $317 million in pro-Biden ad spending compared to $252 million in pro-Trump ad spending.
Table 1: Top Spenders in Presidential Race (since September 28 and since April 9)
| Sponsor | Airings (9/28-10/11) | Est. Spend $ (9/28-10/11) | Airings (4/9-10/11) | Est. Spend $ (4-9-10/11) | Party |
|---|---|---|---|---|---|
| Biden, Joe | 80,452 | 55,928,770 | 356,366 | 222,954,050 | D |
| Trump, Donald | 32,011 | 31,796,960 | 261,633 | 161,377,030 | R |
| FF PAC | 16,355 | 18,311,440 | 16,355 | 18,311,440 | D |
| America First Action | 8,837 | 10,473,140 | 58,771 | 40,641,380 | R |
| Independence USA PAC | 8,762 | 8,687,580 | 8,762 | 8,687,580 | D |
| Preserve America PAC | 7,363 | 15,747,350 | 24,736 | 44,340,830 | R |
| Biden, Joe & DNC | 5,786 | 4,165,640 | 5,908 | 4,212,970 | D |
| Priorities USA Action | 4,562 | 6,535,080 | 41,631 | 31,998,450 | D |
| AB PAC | 3,487 | 3,201,200 | 25,871 | 18,910,860 | D |
| Everytown For Gun Safety Victory Fund | 1,305 | 1,921,110 | 2,882 | 3,800,160 | D |
| Republican Voters Against Trump | 1,142 | 909,850 | 1,661 | 1,297,650 | D |
| Republican Jewish Coalition Victory Fund | 1,108 | 1,883,750 | 1,108 | 1,883,750 | R |
| Priorities USA Action & Latino Victory Fund | 979 | 1,287,960 | 979 | 1,287,960 | D |
| NRA Victory Fund, Inc. | 850 | 888,400 | 7,239 | 3,878,980 | R |
| United Association of Union Plumbers and Pipefitters | 417 | 579,930 | 417 | 579,930 | D |
| Por Nuestras Familias | 361 | 246,510 | 630 | 440,300 | D |
| Future Forward USA Action | 246 | 359,180 | 246 | 359,180 | D |
| Somos PAC | 71 | 94,010 | 71 | 94,010 | D |
| SEIU | 63 | 31,610 | 63 | 31,610 | D |
| United for Progress PAC | 49 | 21,700 | 49 | 21,700 | D |
| Moms for Safe Neighborhoods | 33 | 285,380 | 33 | 285,380 | R |
| VoteVets | 29 | 13,790 | 59 | 29,660 | D |
| LCV Victory Fund | 17 | 5,870 | 17 | 5,870 | D |
| Vote Vets & Nuestro PAC | 17 | 18,910 | 24 | 39,220 | D |
| VoteVets & The Lincoln Project | 6 | 30,750 | 6 | 30,750 | D |
| The Lincoln Project | 2 | 22,040 | 3,138 | 4,152,310 | D |
| Future45 | 1 | 2,750 | 2 | 18,120 | R |
| Great America PAC | 1 | 13,510 | 2 | 28,510 | R |
| Numbers include ads aired on broadcast television and national cable between September 28 and October 11, 2020 and between April 9 and October 11, 2020. CITE SOURCE OF DATA AS: Kantar/CMAG with analysis by the Wesleyan Media Project. |
|||||
Presidential Digital Spending More Evenly Balanced
The two presidential candidates’ digital ad spending has been quite similar in scale since late September, with the Biden campaign spending $34.8 million on Facebook and Google and the Trump campaign spending $33.8 million on Facebook and Google (Table 2). Since mid-April, though, Trump’s campaign has outspent Biden’s campaign on these two platforms, $166 million to $115 million.
Even Barack Obama has entered the mix in recent weeks. Joe Biden’s campaign sponsored about $41,000 in ads posted by the former president’s Facebook page.
Table 2: Digital Ad Spending by Presidential Candidates and Single-Candidate Super PACs
| FB $ (since mid-April) | FB $ (since late Sept) | Google $ (since mid-April) | Google $ (since late Sept) | FB+Google $ (since mid-April) | FB+Google $ (since late Sept) |
|
|---|---|---|---|---|---|---|
| Biden | 66,577,148 | 13,904,404 | 63,521,300 | 20,849,800 | 130,139,472 | 34,754,204 |
| Trump | 93,185,221 | 15,564,403 | 72,658,800 | 18,253,500 | 165,844,021 | 33,817,903 |
| Unite the Country (pro-Biden) | 987,034 | 201,243 | 29,900 | 0 | 1,016,934 | 201,243 |
| Great America PAC (pro-Trump) | 44,150 | 0 | 0 | 0 | 44,150 | 0 |
| Digital spending figures come from the Facebook ad library reports and the Google Transparency Report. Spending covers April 9 or September 27 to October 10, 2020 (for Facebook); April 12 or September 27 to October 10, 2020 (for Google). Candidate spending numbers include spending by official campaign committees, leadership PACs, and joint fundraising committees. See “About the Data” section at the end of this report for more information on our methodology along with the specific page names and disclaimers that are counted. |
||||||
Florida is Center of Political Ad Storm on TV and Online
Three Florida media markets have seen the most political ad airings in the presidential race over the past two weeks. Tampa tops the list, with almost 9,200 ad airings (Table 3). Tampa is followed by Orlando and Miami, both of which have seen over 8,000 in ad airings since September 28. The Philadelphia media market is 4th on the list, with over 7,100 ad airings, followed by Phoenix, Harrisburg, Milwaukee and Pittsburgh. In every single market in the top 25, pro-Biden ads have outnumbered pro-Trump ads over the past two weeks—sometimes substantially.
“Although the impact of ads in presidential races tends to be fairly small, Biden’s consistent ad advantages of two-to-one or even three-to-one in the battleground states has to account for at least some of his expanding lead in the polls over the past few weeks,” said Travis Ridout, co-director of the Wesleyan Media Project.
Throughout the entire general election period, Phoenix has seen the most ads, with over 45,000 ad airings. Tampa is a close second with 39,000 airings.
Table 3: Volume and Spending on Presidential Ads by Media Market (Since September 28)
| Market | State | Airings | Est Cost ($) | Pro- Biden | Pro- Trump | Biden Ad Adv |
|---|---|---|---|---|---|---|
| Tampa | FL | 9,177 | 9,039,430 | 6,580 | 2,597 | 3,983 |
| Orlando | FL | 8,781 | 10,674,100 | 6,079 | 2,702 | 3,377 |
| Miami | FL | 8,128 | 10,824,200 | 5,737 | 2,391 | 3,346 |
| Philadelphia | PA | 7,118 | 8,848,320 | 5,581 | 1,537 | 4,044 |
| Phoenix | AZ | 6,866 | 10,933,030 | 3,710 | 3,156 | 554 |
| Harrisburg | PA | 5,527 | 4,077,580 | 3,881 | 1,646 | 2,235 |
| Milwaukee | WI | 5,132 | 3,846,430 | 4,102 | 1,030 | 3,072 |
| Pittsburgh | PA | 5,073 | 5,617,430 | 3,900 | 1,173 | 2,727 |
| Jacksonville | FL | 5,010 | 2,965,200 | 3,536 | 1,474 | 2,062 |
| Detroit | MI | 4,896 | 6,119,420 | 4,583 | 313 | 4,270 |
| Green Bay | WI | 4,851 | 2,382,040 | 3,940 | 911 | 3,029 |
| Tucson | AZ | 4,714 | 1,983,920 | 3,013 | 1,701 | 1,312 |
| West Palm Beach | FL | 4,584 | 2,911,900 | 2,710 | 1,874 | 836 |
| Johnstown | PA | 4,482 | 1,780,590 | 2,940 | 1,542 | 1,398 |
| Las Vegas | NV | 4,126 | 3,749,060 | 2,897 | 1,229 | 1,668 |
| National Cable | - | 3,954 | 14,941,970 | 3,261 | 693 | 2,568 |
| Raleigh | NC | 3,873 | 3,858,780 | 2,484 | 1,389 | 1,095 |
| Wilkes Barre | PA | 3,861 | 2,611,320 | 2,708 | 1,153 | 1,555 |
| Charlotte | NC | 3,844 | 5,465,120 | 2,378 | 1,466 | 912 |
| Grand Rapids | MI | 3,804 | 2,212,150 | 3,352 | 452 | 2,900 |
| Ft. Myers | FL | 3,692 | 2,000,750 | 2,510 | 1,182 | 1,328 |
| Minneapolis | MN | 3,394 | 3,296,750 | 3,036 | 358 | 2,678 |
| Madison | WI | 3,010 | 1,163,960 | 2,832 | 178 | 2,654 |
| Flint | MI | 2,824 | 1,027,130 | 2,477 | 347 | 2,130 |
| Tallahassee | FL | 2,767 | 511,430 | 2,633 | 134 | 2,499 |
| Numbers include ads aired on broadcast television (national cable appears as its own row) between September 28 and October 11, 2020. Numbers include candidate, party, and group-sponsored ads. Download the data in this table as a spreadsheet. CITE SOURCE OF DATA AS: Kantar/CMAG with analysis by the Wesleyan Media Project. |
||||||
Figure 1: Advertising Advantage in the Presidential Race on Television
Numbers include ads aired on broadcast television (excluding national cable airings) between April 9, 2020 and October 11, 2020,
and between September 28, 2020 and October 11, 2020. Totals include candidate, party, and group-sponsored ads.
Figure by Delta Lab’s Spencer Dean ’21 and Kevin McMorrow ’20
Download the data in this map as a spreadsheet.
CITE SOURCE OF DATA AS: Kantar/CMAG with analysis by the Wesleyan Media Project.
Figure 1 shows which candidate has led in ad airings in each media market since April 9 (and also since September 28, which you access via the drop down menu). Clearly, the television advertising advantage map has turned largely blue, with many markets in key states—Florida, Pennsylvania and Michigan—a deep blue. The Trump campaign and its allies appear to have backed away from advertising in Minnesota, Michigan and Wisconsin. In Detroit, for instance, the pro-Biden ad advantage is almost 15 to 1 over the past two weeks. Trump has his largest ad advantage (since September 28) in Atlanta, followed by several other Georgia media markets. [To view our new interactive tool where you can compare geographic spend on TV ads for different weeks during the general election, please click here.]
Figure 2 shows Facebook spending by week in the four key battleground states of Florida, Michigan, Pennsylvania and Wisconsin. As shown in the upper left panel, Florida has seen the most spending out of the four, and while Trump and Biden spending were closer a few weeks ago, Trump’s Facebook advertising there has pulled ahead by a substantial margin. Biden, by contrast, has the lead in spending in Pennsylvania by a smaller margin whereas the spending in Michigan and Wisconsin has consistently been close with Biden taking a slight edge in Michigan in recent weeks.
Figure 2: Facebook Advertising by Presidential Candidates in Battlegrounds over Time
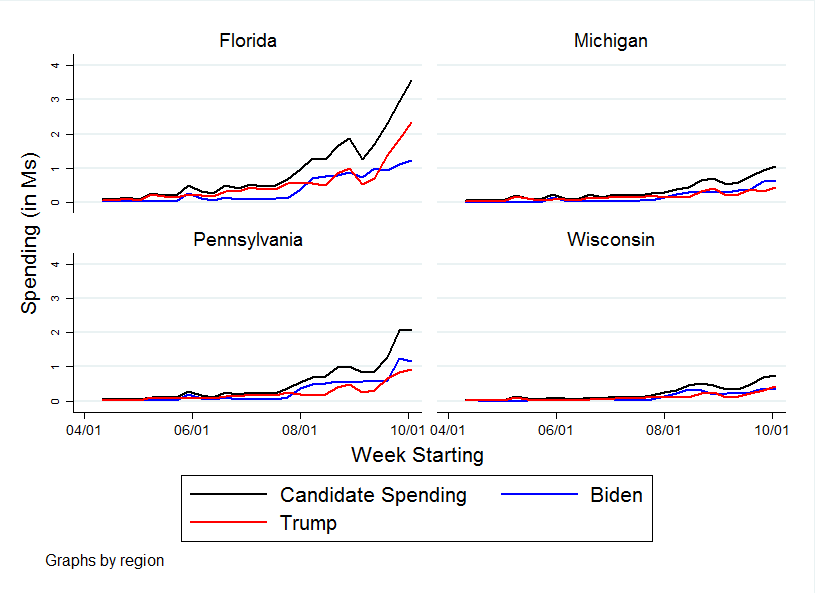
Digital spending figures come from the Facebook ad library reports. Spending covers April 4 to October 10, 2020. Candidate spending numbers include spending by official campaign committees, leadership PACs, and joint fundraising committees. See About the Data section at the end of this report for more information on our methodology along with the specific page names and disclaimers that are counted.
Looking at our interactive tool (Figure 3) for combined spending during the period between September 27 and October 10, Trump is now outspending Biden in Florida by a large margin, $4.2 million to $2.3 million. Biden also has a slight edge in Pennsylvania, $2.4 million to Trump’s $1.75 million. Beyond those two states, Biden leads Facebook spending in Michigan (and California) while Trump leads in Arizona, Georgia and Ohio. The two campaigns are spending roughly equally in Wisconsin and Texas.
Figure 3: Regional Focus of Facebook Advertising by Top Sponsors (Interactive Tool)
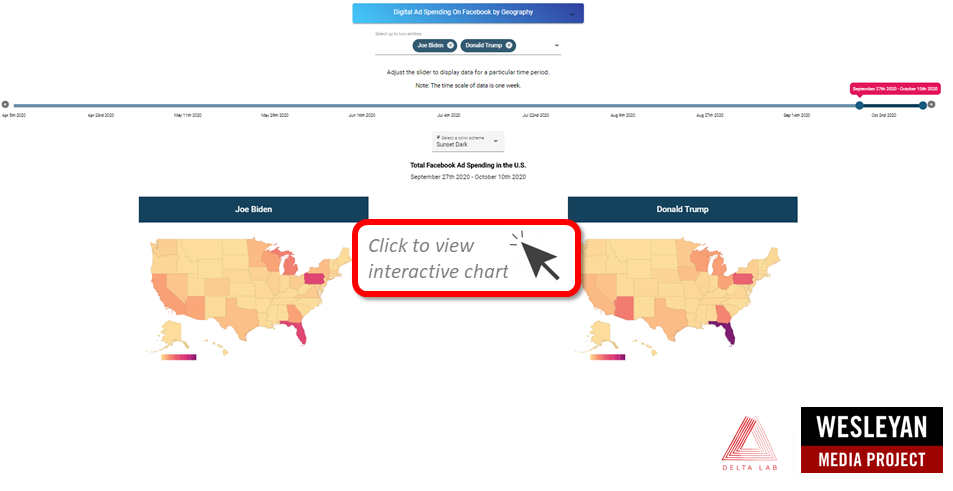
Digital spending comes from the Facebook ad library reports. Data visualization application by Delta Lab’s Roshaan Siddiqui ’22. Classifications from the Wesleyan Media Project with help from the Center for Responsive Politics.
Pro-Trump TV Ads Plateau While Pro-Biden Ads Rise
Figure 4 shows the number of pro-Biden and pro-Trump ad airings over time, starting on April 9, the day after Bernie Sanders suspended his presidential campaign. Although pro-Trump ads were more numerous until late July, since that time pro-Biden ads have outnumbered pro-Trump ads, and that margin has increased in recent weeks.
“In a typical presidential race, we see a pattern of a rising number of television ads leading up to Election Day, but that’s not what we’re seeing from President Trump,” said Michael Franz, co-director of the Wesleyan Media Project. “For the past month, the volume of Trump ads has been flat.”
Figure 4: Advertising Advantage in the Presidential Race on Television
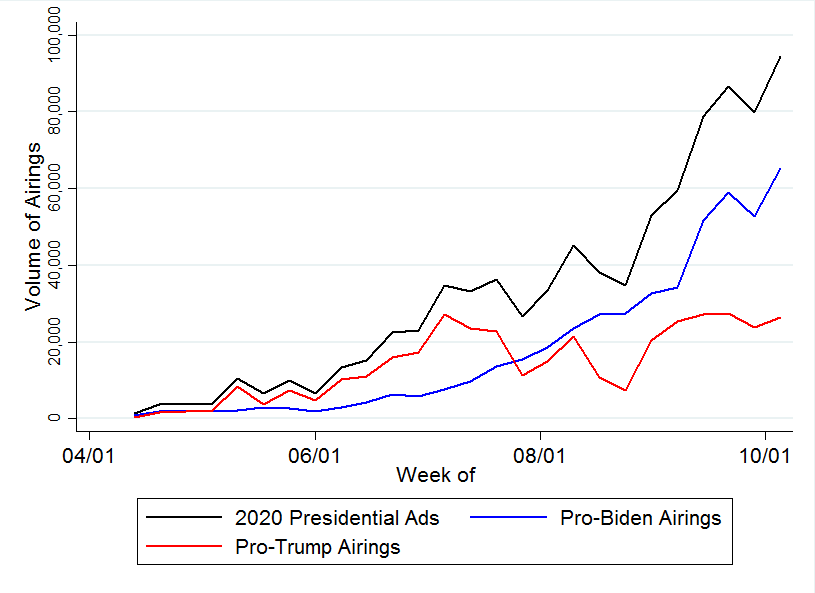
Numbers include ads aired on broadcast television (excluding national cable airings) between April 9 and October 11, 2020. Numbers include candidate, party, and group-sponsored ads.
Download the data in this figure as a spreadsheet.
CITE SOURCE OF DATA AS: Kantar/CMAG with analysis by the Wesleyan Media Project.
Figure 5 shows both Biden and Trump spending on Facebook and Google ads over time. Although Trump led in spending on these platforms for much of the race, Biden has matched or exceeded Trump spending in many of the most recent weeks of the campaign.
Figure 5: Advertising Advantage in the Presidential Race on Facebook and Google
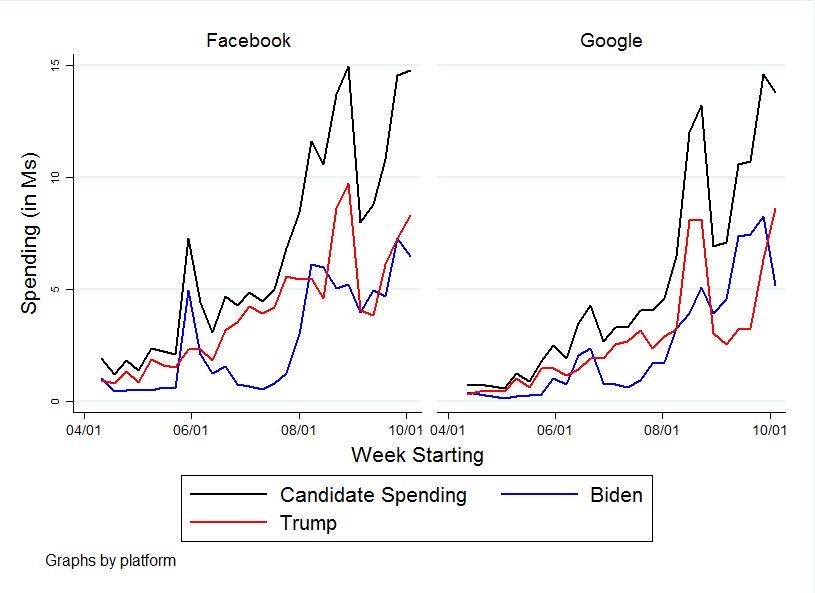
Digital spending figures come from the Facebook ad library reports and the Google Transparency Report. Spending covers April 4 to October 10, 2020. Candidate spending numbers include spending by official campaign committees, leadership PACs, and joint fundraising committees. See About the Data section at the end of this report for more information on our methodology along with the specific page names and disclaimers that are counted.
Presidential Ads Take Positive Turn
Figure 6 depicts the tone of television advertising—both pro-Biden and pro-Trump—in the presidential race. The top panels show the volume of airings that are positive or promotional (in white), contrast (in the medium shade) and negative or attack (in the dark shade), while the bottom panels show the percentage of each candidate’s ad airings fitting into each of these three categories. Clearly, this past week took a very positive turn after the president tested positive for COVID-19, with the vast majority of pro-Biden ads being positive and only a small percent being attacks on Trump. Pro-Trump ads have become both more positive and more negative at the expense of contrast ads. About 40 percent of pro-Trump ad airings in the past week were positive, and about an equal percentage were negative.
Figure 6: Weekly Volume and Percentage of Presidential Airings by Tone
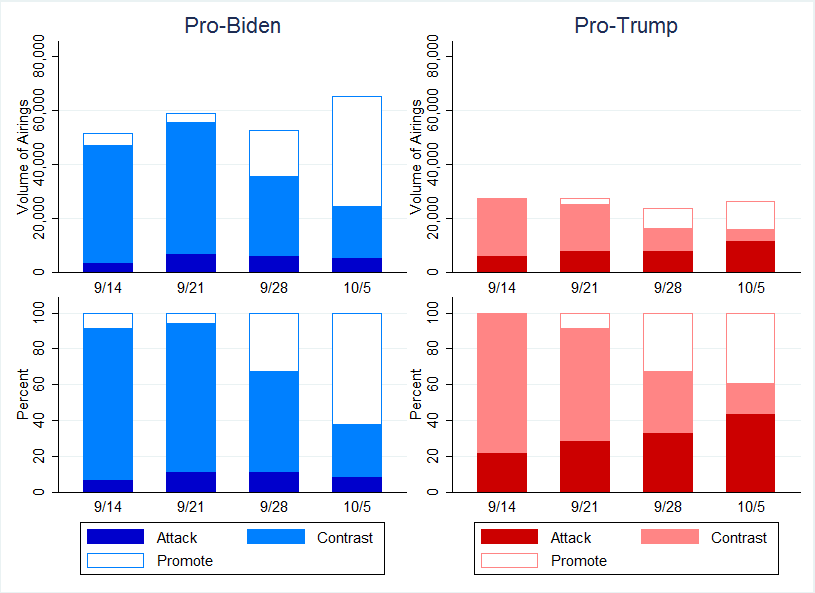
Numbers include ads aired on broadcast television and national cable between September 14 and October 11 for pro-Biden airings (left panel) and pro-Trump airings (right panel). Numbers include candidate, party, and group-sponsored ads.
CITE SOURCE OF DATA AS: Based on ongoing Wesleyan Media Project coding of Kantar/CMAG data, which is subject to change.
As Figure 7 shows, comparing 2020 advertising to past cycles, the past few weeks of this presidential campaign and the general election period overall have seen fewer negative ads as a share of all ads airing on television. By this point in the 2012 presidential election, for example, 60 percent of the ads aired were negative. That compares to under 40 percent in 2020. This election has also featured a higher share of contrast ads in comparison to 2012 and 2016.
Figure 7: Tone of Advertising in Presidential Race (2012, 2016 and 2020)
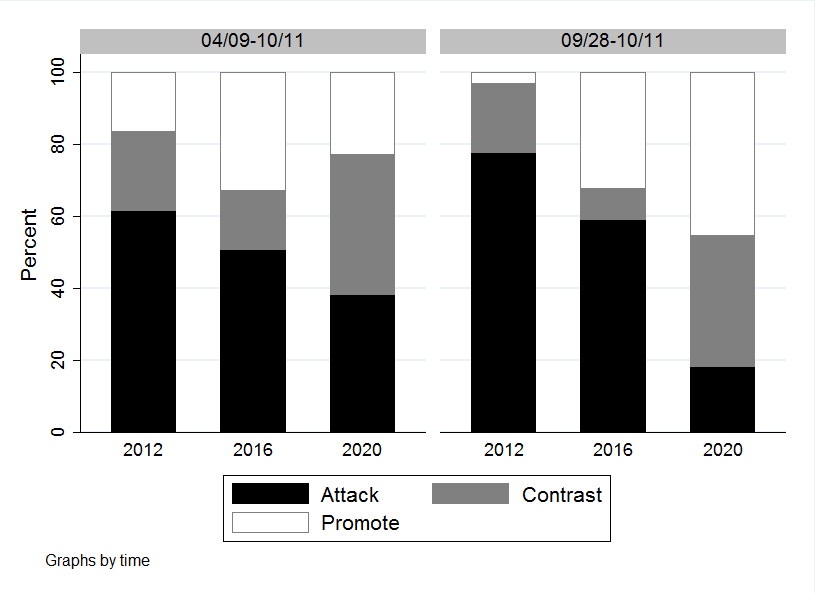
Numbers include ads aired on broadcast television and national cable between April 9 and October 11 in each year (left panel) and between September 28 and October 11 in each year (right panel). Numbers include candidate, party, and group-sponsored ads.
CITE SOURCE OF DATA AS: Based on ongoing Wesleyan Media Project coding of Kantar/CMAG data, which is subject to change.
Consistent with WMP-related research comparing candidate advertising on television versus Facebook, advertising in 2020 on Facebook is more positive (measured as no mention of the opposing candidate) than advertising on television. More specifically, over the September 28 to October 11 period, roughly 31 percent of Biden’s spending on advertising mentioned Trump whereas roughly 23 percent of Trump’s spending mentioned Biden.
Trump Mentions COVID-19 and Jobs; Biden Talks Taxes
Since September 28, Donald Trump has mentioned COVID-19 in nearly half of his ad airings. One ad, titled “Delivered,” aired over 12,000 times in the last two weeks. It lays out his priorities for a second term, including a promise to “eradicate the coronavirus.” In the same ad, he lists ending American reliance on China, a topic he mentions in over 44 percent of his recent airings. Trump’s top issue, though, was jobs, mentioned in over half of his recent ads. In our previous release, we noted that immigration was a top issue for Trump in ads that aired in September. Since the end of the month, though, that issue has fallen to just 11 percent of ad airings.
Biden is also talking about COVID-19, as that’s his second-most noted issue in ads since September 28. It has consistently been a top issue for him in the general election. Taxes was Biden’s top issue, though, mentioned in 37 percent of airings. In one ad, called “The Biden Plan,” the former vice president touts his plan to give first-time homebuyers a $15,000 tax credit. In another ad, “Lying Again,” he responds to claims from Donald Trump that he would raise taxes on middle class families. He also criticizes President Trump’s tax bill, which Biden says threatens the long-term viability of Social Security and Medicare. Other top issues, all mentioned in about 31 percent of ads in the last two weeks, include Social Security, seniors, and business.
Table 4: Issue Focus of Biden and Trump Ads
| Biden Issues | Percent of Airings | Trump Issues | Percent of Airings |
|---|---|---|---|
| Taxes | 36.70% | Jobs | 52.90% |
| Infectious Diseases | 32.20% | Infectious Diseases | 47.10% |
| Social Security | 31.10% | China | 44.20% |
| Seniors (Not Medicare) | 30.80% | Trade | 41.70% |
| Business | 30.60% | Medical Bills | 20.40% |
| Health Care | 29.30% | Medicare | 16.50% |
| Minimum Wage | 21.50% | Social Security | 16.50% |
| Medicare | 20.30% | Crime | 16.00% |
| Economy (Generic) | 19.30% | Prescription Drugs | 15.50% |
| Jobs | 18.20% | Seniors (Not Medicare) | 15.40% |
| Emergency Prep/Response | 17.80% | Protests/Riots | 13.50% |
| Prescription Drugs | 12.80% | Police Brutaility/Racial Violence | 13.50% |
| Medical Bills | 12.10% | Immigration | 11.20% |
| Tax Reform Bill/Tax Overhaul | 10.90% | Health Care | 11.10% |
| Child Care/Family Leave | 10.90% | Economy (Generic) | 9.90% |
| Housing/Subprime | 10.80% | Taxes | 9.30% |
| Climate Change/Global Warming | 7.60% | Business | 5.70% |
| Civil Rights/Racial Discrimination | 7.50% | Energy Policy | 5.70% |
| Protests/Riots | 7.40% | Other | 4.90% |
| Education | 6.40% | Camp Fin Reform | 3.90% |
| Numbers include ads aired on broadcast television between September 28 and October 11, 2020. Totals refer only to candidate-sponsored ads. CITE SOURCE OF DATA AS: Based on ongoing Wesleyan Media Project coding of Kantar/CMAG data, which is subject to change. |
|||
SC, IA, MT and GA Top U.S. Senate Contests
South Carolina featured the most ads in a Senate race since September 28, with 34,000 ad airings on broadcast television (Table 5). The campaigns in Iowa (about 33,000 airings) and Montana (almost 32,000 airings) were next on the list. There are two Senate elections in Georgia this year, and advertising in both those races totaled just over 31,000 ads.
In all of the most competitive Senate races Democrats are out-advertising Republicans. In South Carolina, Democrat Jaime Harrison aired over 19,300 ads since September 28, with some additional help (about 1,300 airings) from Senate Majority PAC. Combined, that’s nearly 6,000 more spots than Republican incumbent Lindsey Graham (and his allies).
Outside groups are active in many of these races. Groups are less involved in South Carolina (about 15 percent of the total airings in the last week) than in North Carolina (where groups account for half of all ads aired in that time period), Maine (about 47 percent), Kansas (38 percent), Iowa (37 percent), Michigan (37 percent), and Arizona (35 percent).
Table 5: Senate TV Ad Airings and Spending
| State | Airings | Spend ($) | Pro-Dem Airings | Pro-GOP Airings | % groups |
|---|---|---|---|---|---|
| SC | 34,701 | 19,638,630 | 20,728 | 13,973 | 14.70% |
| IA | 32,916 | 23,403,640 | 20,280 | 12,636 | 37.40% |
| MT | 31,758 | 14,457,640 | 18,329 | 13,429 | 24.20% |
| GA | 31,207 | 18,455,490 | 17,912 | 13,291 | 26.50% |
| NC | 25,555 | 27,683,580 | 16,139 | 9,416 | 50.90% |
| AZ | 18,512 | 21,838,480 | 10,421 | 8,091 | 34.90% |
| KY | 17,395 | 7,547,640 | 10,784 | 6,611 | 23.10% |
| MI | 17,049 | 15,743,440 | 9,788 | 7,261 | 37.10% |
| ME | 13,856 | 12,786,820 | 7,139 | 6,624 | 46.70% |
| TX | 13,021 | 6,559,160 | 8,858 | 4,163 | 0.00% |
| CO | 12,243 | 8,430,070 | 6,553 | 5,690 | 31.80% |
| KS | 10,946 | 5,625,510 | 7,910 | 3,036 | 38.40% |
| AK* | 8,703 | 1,721,570 | 5,586 | 3,117 | 57.2% |
| AL | 7,996 | 3,100,330 | 5,017 | 2,979 | 0.00% |
| NM | 4,517 | 3,184,810 | 3,122 | 1,395 | 2.50% |
| MS | 4,323 | 842,880 | 3,501 | 822 | 0.00% |
| MN | 3,486 | 2,037,580 | 3,234 | 252 | 0.00% |
| VA | 3,061 | 1,100,210 | 2,307 | 754 | 0.00% |
| OK | 2,335 | 551,540 | 642 | 1,693 | 0.00% |
| LA | 2,175 | 524,670 | 171 | 2,004 | 0.00% |
| NH | 1,846 | 1,049,290 | 1,693 | 153 | 0.00% |
| IL | 1,188 | 993,540 | 1,110 | 0 | 0.00% |
| ID | 997 | 88,700 | 121 | 876 | 0.00% |
| WV | 473 | 66,310 | 0 | 473 | 0.00% |
| AR | 404 | 108,740 | 0 | 404 | 0.00% |
| RI | 186 | 97,140 | 186 | 0 | 0.00% |
| SD | 175 | 15,790 | 175 | 0 | 0.00% |
| Numbers include ads aired on broadcast television between September 28 and October 11, 2020. Numbers include candidate, party, and group-sponsored ads. *Numbers in the Democratic columns for the Alaska Senate race show airings and spending by and on behalf of Al Gross, the independent candidate in that race. CITE SOURCE OF DATA AS: Kantar/CMAG with analysis by the Wesleyan Media Project. |
|||||
Dem Senate Candidates 9 out of Top 10 Digital Ad Spenders
Democratic senatorial candidates are dominating the list of top spenders in digital advertising over the past two weeks, taking up nine out of the top ten slots (Table 6). Jamie Harrison, the Democrat running against Lindsey Graham in South Carolina, has been the top digital ad spender in Senate races over the past two weeks. Harrison has spent $3.2 million on ads on Facebook and Google, but Graham’s digital ad spending has also been high, clocking in at $2.6 million. All told, Harrison has spent $13.7 million on digital ads in his run for the Senate.
Amy McGrath, who is running to defeat Mitch McConnell in Kentucky, is third on the list with $2 million in spending in the past two weeks. Mark Kelly, the Democratic candidate in the Arizona Senate race, is third on the list of overall digital spending in the full cycle (at nearly $8 million) and fourth in the last two weeks (at about $1.8 million).
Table 6: Top U.S. Senate Digital Ad Spenders on Facebook and Google
| State | Party | Candidate | FB+Google $ (since Jan 2019) | FB+Google $ (since 9/5/20) | FB+Google $ (since 9/27/20) |
|---|---|---|---|---|---|
| SC | DEM | Harrison, Jaime | 13,724,367 | 6,650,303 | 3,189,275 |
| KY | DEM | McGrath, Amy | 10,331,423 | 3,420,659 | 2,012,069 |
| AZ | DEM | Kelly, Mark | 7,990,124 | 3,201,794 | 1,758,479 |
| SC | REP | Graham, Lindsey | 7,267,662 | 3,887,640 | 2,575,387 |
| ME | DEM | Gideon, Sara | 6,155,621 | 2,295,683 | 1,171,591 |
| KY | REP | McConnell, Mitch | 6,101,275 | 1,696,254 | 671,422 |
| MT | REP | Daines, Steven | 3,977,628 | 1,326,774 | 604,790 |
| GA | DEM | Ossoff, T. Jonathan | 3,194,650 | 1,936,321 | 1,282,204 |
| CO | DEM | Hickenlooper, John | 3,122,591 | 1,161,523 | 588,979 |
| IA | DEM | Greenfield, Theresa | 3,085,126 | 2,088,552 | 1,375,140 |
| MT | DEM | Bullock, Steve | 2,946,921 | 1,540,367 | 848,744 |
| AZ | REP | McSally, Martha | 2,869,625 | 949,675 | 610,399 |
| MI | DEM | Peters, Gary | 2,322,513 | 1,200,429 | 690,141 |
| TX | REP | Cornyn, John Sen | 2,231,546 | 1,101,100 | 646,813 |
| GA | DEM | Warnock, Raphael | 2,230,617 | 1,091,250 | 740,048 |
| NC | DEM | Cunningham, Cal | 2,141,730 | 974,965 | 577,685 |
| IA | REP | Ernst, Joni | 1,559,998 | 448,166 | 224,064 |
| KS | DEM | Bollier, Barbara | 1,296,058 | 531,260 | 389,661 |
| ME | REP | Collins, Susan | 1,259,928 | 432,117 | 276,085 |
| KY | DEM | Booker, Charles | 1,117,386 | 0 | 0 |
| AL | DEM | Jones, Doug | 1,046,174 | 293,972 | 134,324 |
| MA | DEM | Markey, Ed | 797,323 | 5,743 | 1,798 |
| CO | REP | Gardner, Cory | 762,321 | 260,169 | 152,853 |
| NH | DEM | Shaheen, Jeanne | 735,712 | 215,110 | 130,164 |
| MA | DEM | Kennedy, Joseph P III | 722,995 | 0 | 0 |
| Digital spending figures come from the Facebook ad library reports and the Google Transparency Report. Spending covers January 6, 2019, September 5, 2020, or September 27 to October 10, 2020 (for Facebook); January 6, 2019, September 6, 2020, or September 27, 2020 to October 10, 2020 (for Google). Candidate spending numbers include spending by official campaign committees, leadership PACs, and joint fundraising committees. See About the Data section at the end of this report for more information on our methodology along with the specific page names and disclaimers that are counted. Click here to download a spreadsheet showing all candidates and separate totals for Google and Facebook. |
|||||
Ad Tone in Senate Races More Positive Overall
Overall, the tone of advertising in 2020 Senate races is slightly more positive than in 2016 and 2012, as Figure 8 shows. About 40 percent of the ads aired in the race between January 1, 2019, and October 11, 2020, were positive, while about 40 percent were negative ads. Looking at the most recent two weeks of the general election campaign, we also see evidence that this year’s race is more positive, with about 30 percent of ads falling into the positive category, up from 20 percent in 2012.
Figure 8: Tone of Advertising in U.S. Senate Races (2012, 2016 and 2020)

Numbers include ads aired on broadcast television and national cable between January 1 of the off year and October 11 of the election year in each cycle (left panel) and between September 28 and October 11 of the election year in each year (right panel). Numbers include candidate, party, and group-sponsored ads.
CITE SOURCE OF DATA AS: Based on ongoing Wesleyan Media Project coding of Kantar/CMAG data, which is subject to change.
Figure 9 shows the change in the proportion of ads that contain an attack (negative or contrast ads) over time in U.S. Senate races, back to early July. The black line shows the attacks rose from July to early September, but since that time have declined a bit. In recent weeks, pro-Republican ads, shown in the red, have been more likely to attack than pro-Democratic ads, shown in the blue.
Figure 9: Percentage of Negative (Attack or Contrast) Ad Airings in U.S. Senate Races by Week

Numbers include weekly proportion of ads aired on broadcast television and national cable between the week of July 13 and October 11, 2020.
Numbers include candidate, party, and group-sponsored ads.
CITE SOURCE OF DATA AS: Based on ongoing Wesleyan Media Project coding of Kantar/CMAG data, which is subject to change.
Table 7 speaks to negativity in U.S. Senate races during the past two weeks. The third column shows the percentage of television ads in the race that are negative, regardless of whether they were sponsored by candidates, groups or parties. By this measure, the North Carolina Senate race is the most negative in the country, with 72.9 percent of ad airings coded as negative. The races in Alaska, Maine and Oklahoma have also been quite negative, with over 60 percent of ads falling into that category. The last two columns report on the percentage of candidate-sponsored ads in each race, both Democratic and Republican, that are negative. By this metric, Senator Thom Tillis in North Carolina and Roger Marshall in Kansas are the most negative Senate candidates in the past two weeks. Notably, the negativity in Maine, in Iowa and in Montana is being driven primarily by party and outside group advertising.
Table 7: Most Negative U.S. Senate Races (Pure Attack Only)
| State | Airings | Neg % | Neg % (Dem Cand Only) | Neg % (Rep Cand Only) |
|---|---|---|---|---|
| NC | 25,555 | 72.9% | 0.0% | 100.0% |
| AK* | 8,703 | 66.0% | 13.4% | 53.4% |
| ME | 13,856 | 61.9% | 28.2% | 12.8% |
| OK | 2,335 | 61.8% | 0.0% | 85.3% |
| MI | 17,049 | 53.8% | 0.0% | 57.0% |
| IA | 32,916 | 52.3% | 0.0% | 8.9% |
| GA | 31,207 | 51.9% | 29.4% | 43.5% |
| MT | 31,758 | 51.4% | 19.0% | 0.0% |
| NM | 4,517 | 45.4% | 44.2% | 23.5% |
| SC | 34,701 | 44.4% | 24.1% | 55.1% |
| KS | 10,946 | 44.0% | 14.0% | 100.0% |
| CO | 12,243 | 43.2% | 25.8% | 8.7% |
| AZ | 18,512 | 42.9% | 0.0% | 7.3% |
| MN | 3,486 | 42.3% | 45.6% | 0.0% |
| KY | 17,395 | 31.7% | 4.0% | 28.9% |
| MS | 4,323 | 14.3% | 17.7% | 0.0% |
| TX | 13,021 | 3.8% | 0.0% | 12.0% |
| AL | 7,996 | 2.3% | 0.0% | 6.1% |
| VA | 3,061 | 0.0% | 0.0% | 0.0% |
| LA | 2,175 | 0.0% | 0.0% | 0.0% |
| NH | 1,846 | 0.0% | 0.0% | 0.0% |
| IL | 1,188 | 0.0% | 0.0% | |
| ID | 997 | 0.0% | 0.0% | 0.0% |
| WV | 473 | 0.0% | 0.0% | |
| AR | 404 | 0.0% | 0.0% | |
| RI | 186 | 0.0% | 0.0% | |
| SD | 175 | 0.0% | 0.0% | |
| Numbers include ads aired on broadcast television between September 28 and October 11, 2020. Totals in the last two columns refer only to candidate-sponsored ads. *Numbers in the Democratic candidate column for the Alaska Senate race show airings by Al Gross, the independent candidate in that race. CITE SOURCE OF DATA AS: Based on ongoing Wesleyan Media Project coding of Kantar/CMAG data, which is subject to change. |
||||
The Return of Health Care as a Top Issue in 2020 U.S. Senate Races
Health care is now the top issue in U.S. Senate races—for both Democrats and Republicans. As Table 8 shows, over 42 percent of ad airings from Democrats and their allies have focused on health care in the past two weeks, while over 30 percent of pro-Republican ad airings have focused on the issue. Other top issues in Democratic ads are business, COVID-19 and campaign finance. In Republican ads, taxes, police brutality/racial violence and government ethics/scandal have been emphasized.
Table 8: Issue Focus of U.S. Senate Contests by Party
| Pro-Dem Issues | % of Airings | Pro-Rep Issues | % of Airings |
|---|---|---|---|
| Health Care (Not Prescription Drugs) | 42.30% | Health Care (Not Prescription Drugs) | 30.20% |
| Business | 33.60% | Taxes | 24.70% |
| Infectious Diseases | 28.10% | Police Brutaility/Racial Violence | 16.10% |
| Camp Fin Reform | 26.20% | Other | 15.50% |
| Other | 22.80% | Government Ethics/Scandal | 12.70% |
| Taxes | 16.40% | Jobs | 12.40% |
| Jobs | 15.90% | Energy Policy | 12.10% |
| Prescription Drugs | 14.60% | Supreme Court/Judiciary | 10.40% |
| Veterans | 10.20% | Protests/Riots | 10.10% |
| Medicare | 7.90% | Business | 9.90% |
| Seniors (Not Medicare) | 7.80% | Gun Control/Guns | 9.80% |
| Emergency Prep/Response | 7.80% | Veterans | 9.70% |
| Government Ethics/Scandal | 7.10% | Abortion | 9.20% |
| Education | 6.90% | Military | 8.70% |
| Social Security | 5.90% | Infectious Diseases | 7.50% |
| Moral/Family/Religious Values | 5.30% | Socialism | 7.00% |
| Afghanistan | 5.30% | China | 6.80% |
| Farming | 5.20% | Camp Fin Reform | 6.30% |
| Medical Bills | 5.00% | Domestic Violence/Sexual Assault/Harassment | 6.20% |
| Military | 5.00% | Prescription Drugs | 5.80% |
| Numbers include ads aired on broadcast television between September 28 and October 11, 2020. Totals refer only to candidate-sponsored ads. CITE SOURCE OF DATA AS: Based on ongoing Wesleyan Media Project coding of Kantar/CMAG data, which is subject to change. |
|||
Senate Republicans Attack Pelosi and Rarely Tout Trump
Table 9 shows that mentions of Trump in Senate advertising vary considerably from race to race. In Alabama, for example, 35 percent of ad airings mention Trump—and all of them do so positively. But in New Mexico, New Hampshire, Maine, Michigan and Colorado, all mentions of Trump in Senate advertising are negative.
Overall, 6 percent of pro-Republican Senate ads mention Trump approvingly, and none mention the president disapprovingly. Among pro-Democratic Senate ads, 5 percent mention Trump disapprovingly, while 2 percent mention him in an approving fashion.
Nancy Pelosi is the top Democratic target in Republican ads. Pelosi is mentioned in a negative fashion in 22 percent of pro-Republican ad airings, compared to 12 percent that mention Chuck Schumer and 6 percent that mention Biden.
Table 9: Trump Mentions in Senate Races
| State | Trump Mention | Pos Trump Mention | Neg Trump Mention |
|---|---|---|---|
| AL | 35.0% | 35.0% | 0.0% |
| NM | 32.6% | 0.0% | 32.6% |
| NH | 31.3% | 0.0% | 31.3% |
| ME | 17.7% | 0.0% | 17.7% |
| MI | 15.3% | 0.0% | 15.3% |
| CO | 13.7% | 0.0% | 13.7% |
| KY | 11.8% | 11.8% | 0.0% |
| GA | 8.3% | 8.3% | 0.0% |
| MS | 8.0% | 8.0% | 0.0% |
| NC | 5.6% | 5.6% | 0.0% |
| SC | 4.2% | 3.0% | 1.2% |
| TX | 2.0% | 0.0% | 2.0% |
| AZ | 1.7% | 0.0% | 1.7% |
| MT | 0.8% | 0.8% | 0.0% |
| VA | 0.4% | 0.0% | 0.4% |
| IL | 0.2% | 0.0% | 0.2% |
| IA | 0.0% | 0.0% | 0.0% |
| KS | 0.0% | 0.0% | 0.0% |
| AK | 0.0% | 0.0% | 0.0% |
| MN | 0.0% | 0.0% | 0.0% |
| OK | 0.0% | 0.0% | 0.0% |
| LA | 0.0% | 0.0% | 0.0% |
| ID | 0.0% | 0.0% | 0.0% |
| WV | 0.0% | 0.0% | 0.0% |
| AR | 0.0% | 0.0% | 0.0% |
| RI | 0.0% | 0.0% | 0.0% |
| SD | 0.0% | 0.0% | 0.0% |
| TN | 0.0% | 0.0% | 0.0% |
| Numbers include ads aired on broadcast television between September 28 and October 11, 2020. Numbers include candidate, party, and group-sponsored ads. CITE SOURCE OF DATA AS: Based on ongoing Wesleyan Media Project coding of Kantar/CMAG data, which is subject to change. |
|||
Advertising Favors Dems in Top House Races
The House race that has seen the most ad airings since September 28 is the race in California’s 21st congressional district (Table 10). Democrat T.J. Cox is facing Republican David Valadao in that race, which has seen over 11,000 ad airings in the past two weeks. New Mexico’s second congressional district race and Utah’s 4th congressional district race also have seen a deluge of advertising. In each of these top 25 races, there have been more pro-Democratic than pro-Republican ad airings (though ad airings were the same in Florida’s 26th congressional district).
Table 10: House TV Ad Airings and Spending (Since September 28)
| Race | Airings | Spend ($) | Pro-Dem | Pro-GOP | % groups |
|---|---|---|---|---|---|
| CA21 | 11,124 | 3,578,160 | 6,398 | 4,726 | 13.20% |
| NM02 | 10,105 | 3,693,370 | 6,479 | 3,626 | 27.80% |
| UT04 | 8,116 | 3,074,480 | 4,847 | 3,269 | 30.40% |
| NY22 | 7,665 | 2,701,730 | 5,207 | 2,458 | 35.00% |
| MT01 | 6,701 | 1,328,910 | 3,491 | 3,210 | 20.60% |
| VA05 | 5,899 | 1,139,950 | 4,339 | 1,560 | 32.10% |
| TX21 | 5,015 | 2,801,650 | 3,732 | 1,283 | 30.00% |
| VA07 | 4,967 | 2,475,950 | 3,240 | 1,727 | 22.90% |
| TX23 | 4,872 | 2,752,520 | 3,091 | 1,781 | 4.00% |
| MN07 | 4,857 | 4,471,810 | 3,161 | 1,696 | 38.50% |
| CO03 | 4,705 | 1,217,930 | 2,632 | 2,073 | 10.60% |
| OK05 | 4,639 | 2,639,080 | 2,584 | 2,055 | 26.30% |
| IL13 | 4,613 | 2,646,930 | 2,592 | 2,021 | 14.50% |
| IN05 | 4,402 | 1,848,780 | 2,462 | 1,940 | 17.10% |
| OH01 | 4,381 | 3,160,560 | 2,585 | 1,796 | 34.90% |
| OR04 | 4,280 | 845,740 | 2,693 | 1,587 | 24.20% |
| SC01 | 4,199 | 1,726,950 | 2,224 | 1,975 | 52.80% |
| IA02 | 4,112 | 3,805,020 | 2,200 | 1,912 | 27.60% |
| NE02 | 3,698 | 2,682,520 | 1,877 | 1,821 | 25.30% |
| NY24 | 3,690 | 1,268,030 | 2,220 | 1,470 | 12.40% |
| AK01 | 3,554 | 698,400 | 2,224 | 1,330 | 14.60% |
| FL26 | 3,274 | 5,444,100 | 1,637 | 1,637 | 23.00% |
| ME02 | 3,231 | 1,665,650 | 2,181 | 1,050 | 32.40% |
| MO02 | 3,219 | 2,860,390 | 1,943 | 1,276 | 30.80% |
| VA02 | 3,093 | 1,373,650 | 2,063 | 1,030 | 40.10% |
| Numbers include ads aired on broadcast television between September 28 and October 11, 2020. Numbers include candidate, party, and group-sponsored ads. *Numbers in the Democratic columns for the Alaska House race show airings and spending by Alyse Galvin, the independent candidate in that race. Download a file of all U.S. House races with TV spending here. CITE SOURCE OF DATA AS: Kantar/CMAG with analysis by the Wesleyan Media Project. |
|||||
Top Digital Ad Spenders in House
As Table 11 shows, over the past two weeks, the top digital ad spender in U.S. House races was Alexandria Ocasio-Cortez from New York’s 14th district. Democrats Katie Porter (CA-45) and Wendy Davis (TX-21) rank two and three.
Table 11: Top U.S. House Digital Ad Spenders on Facebook and Google
| State | District | Party | Candidate | FB+Google (since Jan 2019) | FB+Google (since 9/5/20) | FB+Google (since 9/27/20) |
|---|---|---|---|---|---|---|
| NY | 14 | DEM | Ocasio-Cortez, Alexandria | 5,599,544 | 692,491 | 338,318 |
| CA | 45 | DEM | Porter, Katherine | 544,554 | 510,536 | 273,854 |
| TX | 21 | DEM | Davis, Wendy | 638,721 | 397,609 | 235,585 |
| NY | 14 | REP | Cummings, John C. | 645,867 | 365,304 | 160,802 |
| CA | 43 | REP | Collins, Joe | 1,013,472 | 500,264 | 153,754 |
| MN | 5 | REP | Johnson, Lacy | 1,299,854 | 321,573 | 122,504 |
| NC | 8 | DEM | Timmons-Goodson, Patricia | 687,701 | 297,346 | 119,293 |
| MD | 7 | REP | Klacik, Kimberly | 953,211 | 369,981 | 114,261 |
| NY | 11 | DEM | Rose, Max | 406,314 | 196,494 | 113,376 |
| VA | 2 | DEM | Luria, Elaine | 325,293 | 196,943 | 104,964 |
| IL | 6 | DEM | Casten, Sean | 181,414 | 160,490 | 100,480 |
| FL | 13 | REP | Paulina Luna, Anna | 396,400 | 230,583 | 97,306 |
| IL | 14 | DEM | Underwood, Lauren | 234,710 | 130,348 | 94,739 |
| NY | 2 | DEM | Gordon, Jacqueline | 206,121 | 158,804 | 93,511 |
| AZ | 6 | DEM | Tipirneni, Hiral Vyas | 213,324 | 112,234 | 91,046 |
| NV | 3 | REP | Rodimer, Dan | 384,073 | 181,235 | 87,649 |
| CA | 48 | DEM | Rouda, Harley E Jr | 260,693 | 142,453 | 87,183 |
| SC | 1 | DEM | Cunningham, Joe | 430,840 | 158,115 | 85,583 |
| CA | 39 | REP | Kim, Young | 799,205 | 170,918 | 82,273 |
| SC | 2 | DEM | Boroughs, Adair Ford | 386,965 | 194,063 | 80,614 |
| CO | 3 | DEM | Mitsch Bush, Diane Ms. | 204,437 | 139,240 | 76,370 |
| TX | 24 | DEM | Valenzuela, Candace | 152,406 | 104,815 | 75,742 |
| MI | 3 | DEM | Scholten, Hillary | 160,339 | 123,668 | 73,364 |
| MI | 11 | DEM | Stevens, Haley | 181,186 | 154,656 | 73,361 |
| OH | 4 | REP | Jordan, James D. | 1,219,646 | 146,016 | 72,930 |
| MN | 1 | DFL | Feehan, Daniel | 236,947 | 133,571 | 71,957 |
| OR | 4 | REP | Skarlatos, Alek | 269,433 | 152,775 | 70,640 |
| NY | 21 | REP | Stefanik, Elise M. | 672,399 | 138,407 | 69,708 |
| CA | 50 | DEM | Campa-Najjar, Ammar | 390,257 | 153,588 | 68,817 |
| TX | 32 | DEM | Allred, Colin | 104,276 | 86,854 | 66,702 |
| VA | 7 | DEM | Spanberger, Abigail | 277,174 | 123,243 | 65,666 |
| IA | 3 | DEM | Axne, Cindy | 156,646 | 92,220 | 64,692 |
| CA | 22 | REP | Nunes, Devin G. | 800,694 | 166,306 | 64,584 |
| PA | 8 | DEM | Cartwright, Matthew A. | 142,740 | 88,654 | 62,049 |
| CA | 48 | REP | Steel, Michelle | 414,848 | 107,319 | 59,988 |
| TX | 2 | DEM | Ladjevardian, Sima Jandaghi | 95,113 | 76,611 | 58,284 |
| NJ | 7 | REP | Kean, Thomas H. Jr. | 158,101 | 93,289 | 57,573 |
| MI | 8 | DEM | Slotkin, Elissa | 161,867 | 133,255 | 56,691 |
| VA | 5 | DEM | Webb, Bryant Cameron | 198,920 | 121,503 | 55,909 |
| MN | 3 | DFL | Phillips, Dean | 120,323 | 91,695 | 55,855 |
| IA | 3 | REP | Young, David | 111,395 | 96,234 | 55,692 |
| NJ | 3 | DEM | Kim, Andy | 303,351 | 132,303 | 54,495 |
| IA | 1 | DEM | Finkenauer, Abby | 191,151 | 105,618 | 53,593 |
| NJ | 2 | REP | Van Drew, Jeff Mr | 276,179 | 90,829 | 52,991 |
| IN | 5 | DEM | Hale, Christina | 206,746 | 105,430 | 52,670 |
| IL | 13 | DEM | Londrigan, Betsy Dirksen | 181,403 | 106,341 | 51,515 |
| PA | 1 | REP | Fitzpatrick, Brian | 213,228 | 94,566 | 51,463 |
| NY | 22 | DEM | Brindisi, Anthony | 219,560 | 98,738 | 50,866 |
| CO | 3 | REP | Boebert, Lauren | 120,426 | 79,846 | 49,646 |
| MN | 2 | DEM | Craig, Angela Dawn | 137,882 | 80,755 | 49,194 |
| Digital spending figures come from the Facebook ad library reports and the Google Transparency Report. Spending covers January 6, 2019 September 5, 2020 or September 27, 2020 to October 10, 2020 (for Facebook); January 6, 2019, September 6, 2020 or September 27 to October 10, 2020 (for Google). Candidate spending numbers include spending by official campaign committees, leadership PACs, and joint fundraising committees. See About the Data section at the end of this report for more information on our methodology along with the specific page names and disclaimers that are counted. Click here to download a spreadsheet showing all candidates and separate totals for Google and Facebook. |
||||||
TV Ad Volumes Reach Historic Highs
The volume of televised advertising in the presidential race continues to outpace the volume in 2012 and 2016—and has done so for almost the past two months (Figure 10). Almost 100,000 ads aired in the past week alone. Cycle-to-date 2020 presidential advertising is up 147 percent over 2016 and 80 percent over the 2012 cycle.
Figure 10: Number of Presidential Ad Airings by Week (2012, 2016 and 2020)
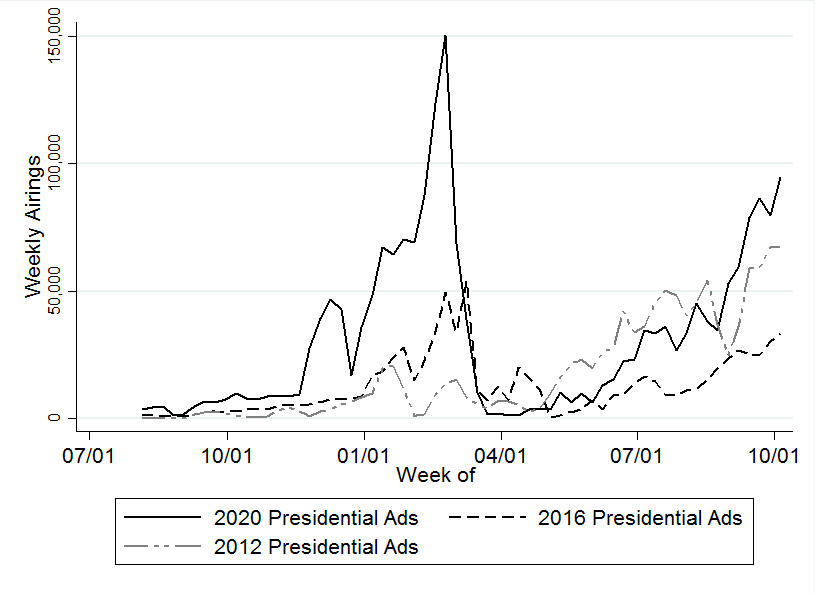
Numbers include ads aired on broadcast television and national cable between July 1, 2019 and October 11, 2020.
CITE SOURCE OF DATA AS: Kantar/CMAG with analysis by the Wesleyan Media Project.
As Figure 11 shows, advertising in U.S. Senate races is also outpacing levels of advertising in the past two presidential cycles; over the past several weeks, the volume of ads has more than doubled the number that aired in 2012 and 2016. Cycle-to-date U.S. Senate volume is up 187 percent over the 2016 cycle and 82 percent over the 2018 cycle, which was itself record-breaking.
“A large number of competitive races, combined with the ability to raise large sums of money, especially on the Democratic side, has resulted in an astounding barrage of ads in Senate contests this year,” said Erika Franklin Fowler, co-director of the Wesleyan Media Project.
Figure 11: Number of U.S. Senate Ad Airings by Week (2012, 2016 and 2020)
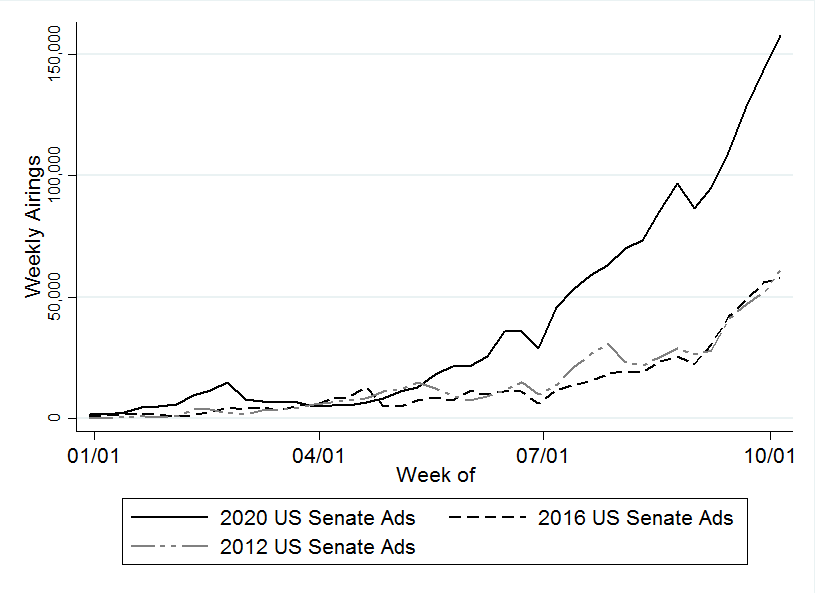
Numbers include ads aired on broadcast television between January 1 and October 11, 2020.
CITE SOURCE OF DATA AS: Kantar/CMAG with analysis by the Wesleyan Media Project.
House advertising in 2020 is also substantially outpacing House advertising in 2012 and 2016, with well over 100,000 ads airing in the past week (Figure 12). Cycle-to-date U.S. House volume is up 154 percent over the 2016 cycle and 6 percent over 2018 totals, which were record breaking.
Figure 12: Number of U.S. House Ad Airings by Week (2012, 2016 and 2020)
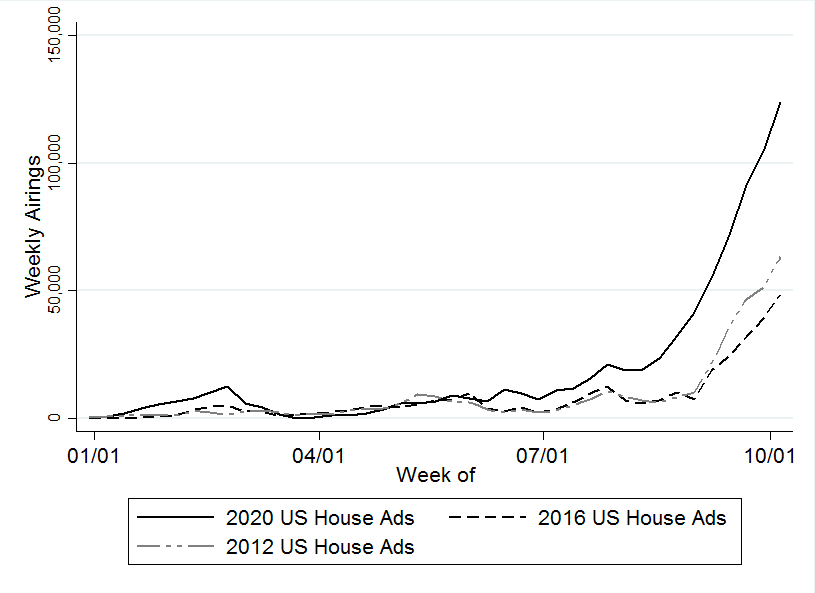
Numbers include ads aired on broadcast television between January 1 and October 11, 2020.
CITE SOURCE OF DATA AS: Kantar/CMAG with analysis by the Wesleyan Media Project.
Senate Leadership Fund Tops Group Spender List
Outside groups have spent millions in the past two weeks on television and digital advertising in an attempt to sway races (Table 12). The top spender is the Senate Leadership Fund, with $34.8 million in spending in support of Republican candidates in 11 different Senate races. Meanwhile, Senate Majority PAC, a Democratic group, has aired $27 million worth of ads in 9 states.
Table 12: Top Outside Group Spenders Since Late September
| Sponsor | Party Lean | TV spend ($) | FB spend ($) | Google spend ($) | Total ($) | Races (with TV ads) |
|---|---|---|---|---|---|---|
| Senate Leadership Fund | R | 32,417,300 | 222,339 | 2,156,100 | 34,795,739 | Sen: AK, AZ, CO, GA, IA, KS, ME, MI, MT, NC, SC |
| Senate Majority PAC | L | 26,950,640 | 376,212 | 1,176,600 | 28,503,452 | Sen: AZ, CO, GA, IA, ME, MI, MT, NC, SC |
| Congressional Leadership Fund | R | 21,150,470 | 219,441 | 898,100 | 22,268,011 | AK-01, AR-02, CA-21, FL-26, GA-07, IA-01, IA-02, IA-03, IL-13, ME-02, MI-03, MI-06, MI-11, MN-07, MO-02, NC-08, NC-11, NE-02, NJ-02, NM-02, NV-03, NY-11, NY-22, NY-24, OH-01, OK-05, OR-04, PA-01, PA-10, SC-01, TX-07, TX-22, TX-24, UT-04, VA-02, VA-05, WI-03 |
| FF PAC | L | 18,311,440 | 0 | 0 | 18,311,440 | Pres |
| Preserve America PAC | R | 15,747,350 | 440,456 | 2,006,400 | 18,194,206 | Pres |
| House Majority PAC | L | 10,690,540 | 503,899 | 694,200 | 11,888,639 | CA-21, CA-48, FL-26, IA-01, IA-02, IL-13, MN-07, MO-02, NE-02, NJ-02, NM-02, NV-03, NY-11, NY-24, OH-01, OK-05, OR-04, SC-01, TX-07, TX-23, TX-24, UT-04, VA-02, VA-07 |
| America First Action | R | 10,473,140 | 875,076 | 1,112,300 | 12,460,516 | Pres |
| Independence USA PAC | L | 8,687,580 | 0 | 0 | 8,687,580 | Pres |
| Priorities USA Action | L | 6,535,080 | 1,213,220 | 1,009,400 | 8,757,700 | Pres |
| American Crossroads | R | 3,834,350 | 0 | 0 | 3,834,350 | Sen: IA, MN, NC |
| Club for Growth Action | R | 3,682,300 | 239,067 | 73,600 | 3,994,967 | AZ-06, GA-07, IN-05, MT-01, OH-01, PA-10, TX-21, VA-07 |
| AB PAC | L | 3,201,200 | 148,769 | 0 | 3,349,969 | Pres |
| Defend AZ | R | 2,942,990 | 60,691 | 0 | 3,003,681 | Sen: AZ |
| NEA Advocacy Fund | L | 2,771,150 | 0 | 0 | 2,771,150 | Sen: NC; AR-02 |
| Plains PAC | L | 2,632,530 | 0 | 0 | 2,632,530 | Sen: IA |
| Women Vote | L | 2,557,420 | 1,109,134 | 345,500 | 4,012,054 | Sen: KS, ME; MI-03, MO-02, OH-01, TX-21, TX-23 |
| Keep Kentucky Great | R | 2,164,050 | 24,849 | 189,200 | 2,378,099 | Sen: KY |
| Everytown for Gun Safety Victory Fund | L | 2,009,280 | 0 | 5,500 | 2,014,780 | Pres; GA-06 |
| LCV Victory Fund | L | 1,886,690 | 20,358 | 10,600 | 1,917,648 | Pres; Sen: IA; NM-02, SC-01, VA-07 |
| Republican Jewish Coalition Victory Fund | R | 1,883,750 | 1,400 | 0 | 1,885,150 | Pres |
| Security is Strength PAC | R | 1,348,890 | 36,357 | 0 | 1,385,247 | Sen: SC |
| Priorities USA Action & Latino Victory Fund | L | 1,287,960 | 0 | 0 | 1,287,960 | Pres |
| Ditch Fund | L | 1,169,830 | 7,700 | 161,900 | 1,339,430 | Sen: KY |
| AFSCME PEOPLE | L | 1,084,530 | 0 | 0 | 1,084,530 | Sen: ME; NY-22 |
| 1820 PAC | R | 1,028,870 | 0 | 0 | 1,028,870 | Sen: ME |
| Republican Voters Against Trump | R | 909,850 | 785,855 | 0 | 1,695,705 | Pres |
| NRA Victory Fund, Inc. | R | 888,400 | 462,471 | 495,800 | 1,846,671 | Pres |
| AFSCME | L | 884,020 | 110,043 | 0 | 994,063 | Sen: AZ, NC; PA-08 |
| Duty And Country | L | 832,530 | 36,483 | 0 | 869,013 | Sen: KS |
| LCV Victory Fund & House Majority PAC | L | 782,050 | 0 | 0 | 782,050 | MI-08, SC-01 |
| Table shows television, Facebook and Google spending for the top group spenders on television. For TV, numbers include ads aired on broadcast television and national cable between September 28 and October 11, 2020. Facebook ads are between September 27 and October 10, 2020. Google ads are between September 27 and October 10, 2020. See About the Data section at the end of this report for more information on our methodology along with the specific page names and disclaimers (Facebook) and advertiser IDs (Google) that are counted. CITE SOURCE OF DATA AS: Kantar/CMAG, Facebook Ad Library and Google Transparency Report with analysis by the Wesleyan Media Project. |
||||||
Dark Money Declines but Partial Disclosure Rises
In partnership with the Center for Responsive Politics, the Wesleyan Media Project also tracks outside group ad spending by the type of donor disclosure. We classify groups as full-disclosure groups (meaning they disclose contributor lists to the Federal Election Commission), non-disclosing dark money groups (which are not required to disclose publicly their donors; these are most often 501c4 non-profits), and partial-disclosure groups (those that disclose donors but also accept contributions from dark money sources).
Spending by dark money groups has declined in recent weeks, making up just 4 percent of group spending in the presidential race, 2 percent in Senate races and 0.9 percent in House races (Table 13). September 5 was the start of the 60-day “window” before the general election, when all pro-candidate spending by dark money groups must be reported to the Federal Election Commission. Since the start of that period, there has been a shift away from ad airings sponsored by dark money groups toward partial and full-disclosure groups. Still, a lot of spending is coming from groups that only partially disclose their doners. In fact, 72 percent of ads in House races in the past two weeks are from groups that only partially disclose.
Table 13: Group-sponsored TV Ad Airings by Disclosure Type
| 1/1/19 to 8/9/20 | 8/10 to 9/4 | 9/5 to 9/27 | 9/28 to 10/11 | Total | |
|---|---|---|---|---|---|
| PRESIDENT | |||||
| Total Group Ads | 131,083 | 44,774 | 41,221 | 56,063 | 273,141 |
| % Dark Money | 11.6% | 20.5% | 2.09% | 4.0% | 10.0% |
| % Partial | 40.2% | 19.0% | 37.26% | 47.9% | 37.8% |
| US SENATE | |||||
| Total Group Ads | 264,652 | 140,535 | 97,053 | 82,813 | 585,053 |
| % Dark Money | 55.6% | 52.8% | 1.8% | 2.0% | 38.4% |
| % Partial | 19.1% | 22.6% | 38.2% | 36.1% | 25.5% |
| US HOUSE | |||||
| Total Group Ads | 73,114 | 18,563 | 37,641 | 45,326 | 174,644 |
| % Dark Money | 51.2% | 27.3% | 29.0% | 0.9% | 30.8% |
| % Partial | 6.4% | 16.0% | 36.8% | 72.0% | 31.0% |
| Numbers include ads aired on broadcast television between January 1, 2019 and October 11, 2020. CITE SOURCE OF DATA AS: Kantar/CMAG with analysis by the Wesleyan Media Project. Group classifications by Center for Responsive Politics |
|||||
Candidate Mentions in Facebook Ads
Additional page names (including other outside groups and parties in addition to candidates) mentioning senatorial and presidential candidates on Facebook can be investigated through the help of the Wesleyan Media Project’s student-driven Delta Lab via our interactive tables. Table 14 shows all entities that have spent approximately $25,000 or more on Facebook advertising that mentions 2020 presidential or senatorial candidates (removing candidate self-references) since early April or $5,000 or more in the past few weeks.
Table 14: Facebook Pages Mentioning Candidates for President and Senate in 2020
Click here to view the table in a new tab (with larger text)
Table includes Facebook page names spending approximately $25,000 or more on advertising that mentions 2020 presidential or senatorial candidates (excluding candidate self-references) between April 9 and October 10, 2020 or approximately $5,000 or more on advertising between September 27 and October 10, 2020. This interactive table is part of an ongoing, work-in-progress project from WMP’s student-driven Delta Lab. Data table by Delta Lab’s Kevin McMorrow ’20, Sam Feuer ’23 and Jielu Yao. False positive mentions are unavoidable at this stage as candidates are identified through search term queries while we develop methods to improve their accuracy.
Table 15 presents the same set of pages as Table 15 but aggregates the proportion of spending on ads mentioning candidates by the major party affiliation of the candidate mention. The columns “Democrats” and “Republicans” contain the proportion of ads mentioning candidates from the respective parties out of the total number of ads mentioning a candidate at all.
Table 15: Facebook Pages Mentioning Candidates for President and Senate in 2020 by Party
Click here to view the table in a new tab (with larger text)
Table includes Facebook page names spending approximately $25,000 or more on advertising that mentions 2020 presidential or senatorial candidates (excluding candidate self-references) between April 9 and October 10, 2020 or approximately $5,000 or more on advertising between September 27 and October 10, 2020. This interactive table is part of an ongoing, work-in-progress project from WMP’s student-driven Delta Lab. Data table by Delta Lab’s Kevin McMorrow ’20, Sam Feuer ’23 and Jielu Yao. False positive mentions are unavoidable at this stage as candidates are identified through search term queries while we develop methods to improve their accuracy.
About the Data
For the television ad totals, data reported here are from Kantar/CMAG and do not cover local cable buys, only broadcast television, national network and national cable advertising.
For Facebook ads, data come from the aggregate reports, but our figures are more comprehensive than what Facebook reports on their campaign page because we include spending on ads that are funded by the campaigns even when they run on different pages in our totals (e.g., Trump funded ads on Mike Pence or Brad Parscale’s pages are included in the Trump totals). We looked for pages attached to each candidate, including possible leadership PACs, joint-fund-raising committees, and, in the case of presidential candidates, affiliated Senate/House pages. Aggregate report entries are provided for each page name and disclaimer combination. Totals for most of this report reflect spending between January 6, 2019, September 5, 2020, or September 27, 2020 and October 10, 2020. These totals are calculated by subtracting the reported cumulative spending (as reported by Facebook as the total spent since May 2018) for the October 10, 2020 report and subtracting off the cumulative spending reported for December 31, 2019 or September 4, 2020.
Calculating cycle-to-date Facebook totals is more challenging than looking at totals from the last couple of months. In early January 2019, Facebook did not include page IDs (a unique identifier) for each entry in the aggregate report. Because pages can have the same name, a unique identifier for each page would be required to definitively identify an aggregate report entry, which Facebook does not provide going backward. Therefore, we did our best to associate each entry in the January 5, 2019, report with a page ID, which we had access to through the library API. There may be some slippage if two pages associated with candidates had identical names and disclaimers, but we believe these instances are rare for the set of ads covered in this report. For cycle-to-date spending, we subtracted the January 5, 2019 total from the October 10, 2020 total to get the spending by page and disclaimer for January 6, 2019 through October 10, 2020. As noted above, we also report spending from January 1, 2020 through October 10, 2020 and September 5, 2020 through October 10, 2020. We rely on a Delta Lab monitoring tool to identify and avoid using days on which Facebook has a problem with the aggregated spending report.
In Table A (click here to download), we list the page names/disclaimer rows from the Facebook aggregate reports that we identified for this report. It is possible that we missed some spending from a Facebook page affiliated with a candidate running for office. This is exacerbated by the absence of EIN or FEC identifiers in the Facebook reports.
For Google ads, we downloaded the weekly reports from the platform’s Transparency Report. As a matter of practice with all of the platform data, we try to replicate our prior spending figures when we are calculating numbers for a new release. In that process, we discovered discrepancies between the data we downloaded in November and the information available in the December download for the same dates, which persists in October. Based on conversations with Google, we believe the discrepancies are partially but not exclusively due to the addition of advertisers targeting state-level races. We are working on a process to report these discrepancies, but the totals reflected in this release are current as of 10/13/20, the day on which we pulled the transparency report. Google only includes spending in federal and state races and only includes weekly totals but lists the sponsor’s EIN or FEC committee ID. We searched the list of advertisers for presidential candidates and affiliated leadership PACs and joint-fund-raising committees, and candidates for U.S Senate and affiliated single-candidate super PACs. We made the same assumption as with the Facebook data about any spending from House and Senate campaign committees by declared presidential candidates. Google spending is from the following time periods: January 5, 2019, September 6, 2020, or September 27 through October 10, 2020.
In Table B (click here to download), we list the advertiser name for all entities used in this report to calculate Google spending totals.
About This Report
The Wesleyan Media Project (WMP) provides real-time tracking and analysis of political advertising in an effort to increase transparency in elections. Housed in Wesleyan’s Quantitative Analysis Center (QAC) – part of the Allbritton Center for the Study of Public Life – the Wesleyan Media Project is the successor to the Wisconsin Advertising Project, which disbanded in 2009. It is directed by Erika Franklin Fowler, associate professor of government at Wesleyan University, Michael M. Franz, professor of government at Bowdoin College and Travis N. Ridout, professor of political science at Washington State University. WMP personnel include Laura Baum (Project Manager), Colleen Bogucki (Project Coordinator), Pavel Oleinikov (Associate Director, QAC), Markus Neumann (Post-Doctoral Fellow), and Jielu Yao (Post-Doctoral Fellow).
The Wesleyan Media Project’s digital advertising tracking is supported by the contributions of students in Delta Lab, an interdisciplinary research collaborative focusing on computationally-driven and innovative analyses and visualizations of media messaging. We especially thank Spencer Dean ’21, Kevin McMorrow ‘20, Sam Feuer ’23 and Roshaan Siddiqui ‘22 for their contributions to this report.
The Wesleyan Media Project is supported by Wesleyan University, the John S. and James L. Knight Foundation, and the Democracy Fund. WMP is partnering again this year with the Center for Responsive Politics, to provide added information on outside group disclosure.
Periodic releases of data will be posted on the project’s website and dispersed via Twitter @wesmediaproject. To be added to our email update list, click here.
For more information contact: Lauren Rubenstein, lrubenstein@wesleyan.edu, (203) 644-7144
About Wesleyan University Wesleyan University, in Middletown, Conn., is known for the excellence of its academic and co-curricular programs. With more than 2,900 undergraduates and 200 graduate students, Wesleyan is dedicated to providing a liberal arts education characterized by boldness, rigor and practical idealism. For more, visit wesleyan.edu.
About the John S. and James L. Knight Foundation Knight Foundation is a national foundation with strong local roots. We invest in journalism, in the arts, and in the success of cities where brothers John S. and James L. Knight once published newspapers. Our goal is to foster informed and engaged communities, which we believe are essential for a healthy democracy.
About Democracy Fund Created by eBay founder and philanthropist Pierre Omidyar, Democracy Fund is a foundation helping to ensure that our political system can withstand new challenges and deliver on its promise to the American people. Democracy Fund has invested more than $125 million in support of a healthy, resilient, and diverse democracy with a particular focus on modern elections, effective governance, and a vibrant public square.