Groups are bolstering Republicans in Senate campaigns;
Dems also have ad advantages in many House Races
(MIDDLETOWN, CT) October 6, 2022 – Democrats are out-airing their Republican opponents in nine of the top 10 Senates races, according to a new report from the Wesleyan Media Project. While the air war is very balanced in the Wisconsin Senate race, as shown in Table 1, Democratic ad advantages are over 1,000 spots in seven contests, including Georgia, New Hampshire, Nevada, Ohio, and Pennsylvania.
Outside groups are responsible for one-third to nearly one-half of the broadcast spots on television in the last two weeks, with Republicans getting more support from groups than Democrats (last two columns of Table 1).
“Control of the Senate is a major prize, and Democrats clearly have the airing advantage at the moment,” said Michael Franz, co-director of the Wesleyan Media Project. “Republican candidates are still being out-aired even with significant cover from super PACs and other groups. The pace of outside group spending in these competitive Senate races is unprecedented.”
Table 1: Volume of TV Airings in Senate Races (September 19-October 2)
| State | Airings | Pro-Dem Airings | Pro-Rep Airings | Pro-Dem Advantage | % Group Airings | % Pro-Dem IG | % Pro-GOP IG |
|---|---|---|---|---|---|---|---|
| WI | 16,613 | 8,531 | 8,082 | 449 | 48.5% | 44.2% | 53.1% |
| GA | 13,191 | 7,257 | 5,934 | 1,323 | 40.7% | 27.8% | 56.6% |
| NH | 11,120 | 6,549 | 4,571 | 1,978 | 41.2% | 29.0% | 58.7% |
| NV | 11,062 | 6,646 | 4,416 | 2,230 | 35.3% | 20.9% | 57.0% |
| OH | 10,642 | 5,870 | 4,772 | 1,098 | 37.3% | 18.1% | 60.9% |
| PA | 10,359 | 5,712 | 4,647 | 1,065 | 43.0% | 29.2% | 60.0% |
| NC | 9,450 | 5,266 | 4,184 | 1,082 | 42.9% | 24.0% | 66.6% |
| AZ | 9,365 | 6,935 | 2,430 | 4,505 | 36.4% | 28.6% | 58.6% |
| FL | 7,195 | 3,268 | 3,927 | -659 | 0.0% | 0.0% | 0.0% |
| CO | 4,751 | 3,392 | 1,359 | 2,033 | 47.4% | 41.0% | 63.4% |
| WA | 3,574 | 2,277 | 1,297 | 980 | 16.7% | 10.7% | 27.3% |
| UT | 2,950 | 0 | 1,995 | -1,995 | 51.8% | 51.8% | |
| AK | 2,855 | 614 | 2,241 | -1,627 | 81.4% | 100.0% | 76.3% |
| ID | 2,576 | 0 | 2,576 | -2,576 | 0.0% | 0.0% | |
| IA | 2,439 | 924 | 1,515 | -591 | 0.0% | 0.0% | 0.0% |
| LA | 2,408 | 531 | 1,877 | -1,346 | 0.0% | 0.0% | 0.0% |
| OR | 1,635 | 1,635 | 0 | 1,635 | 0.0% | 0.0% | |
| MO | 1,314 | 1,070 | 244 | 826 | 0.0% | 0.0% | 0.0% |
| NY | 1,051 | 1,051 | 0 | 1,051 | 0.0% | 0.0% | |
| KY | 760 | 0 | 760 | -760 | 0.0% | 0.0% | |
| ND | 749 | 0 | 749 | -749 | 0.0% | 0.0% | |
| CT | 662 | 662 | 0 | 662 | 0.0% | 0.0% | |
| AR | 620 | 0 | 620 | -620 | 36.8% | 36.8% | |
| IN | 540 | 0 | 540 | -540 | 0.0% | 0.0% | |
| SC | 313 | 0 | 313 | -313 | 0.0% | 0.0% | |
| IL | 173 | 173 | 0 | 173 | 0.0% | 0.0% | |
| VT | 165 | 137 | 28 | 109 | 0.0% | 0.0% | 0.0% |
| AK | 30 | 0 | 30 | -30 | 0.0% | 0.0% | |
| Figures are from September 19, 2022, to October 2, 2022. Numbers include broadcast television. Table does not show 955 airings from independent candidate Evan McMullin in Utah. CITE SOURCE OF DATA AS: Kantar/CMAG with analysis by the Wesleyan Media Project. |
|||||||
The Wesleyan Media Project is also tracking ad spending in Senate races for a wider set of venues beyond broadcast television. This includes satellite and local cable TV along with digital advertising on Facebook and Google. Table 2 reports those totals for the past two weeks, focusing on candidate spending only (including any coordinated spending with the political parties). The top six candidate spenders were Democrats. Raphael Warnock has spent over $6 million in the last two weeks, including over $1 million on Facebook and Google. Mark Kelly in Arizona is close behind, with nearly $5.5 million in advertising spending since September 19. Looking just at candidate and candidate/party coordinated spending on ads, Democrats are out-spending their opponents in Georgia, Arizona, Nevada, Florida, New Hampshire, Pennsylvania, Wisconsin, Ohio, North Carolina, and Colorado.
Table 2: Spending by Senate Candidates Across Sources (September 19-October 2)
| State | Party | Sponsor | TV Broadcast Cost (in $Ms) | Other TV & Radio Cost (in $Ms) | Facebook Cost (in $Ms) | Google Cost (in $Ms) | Total Cost (in $Ms) | Digital |
|---|---|---|---|---|---|---|---|---|
| GA | DEM | Warnock, Raphael | 3.29 | 1.62 | 0.37 | 0.83 | 6.12 | 20% |
| AZ | DEM | Kelly, Mark | 3.79 | 1.17 | 0.20 | 0.29 | 5.45 | 9% |
| NV | DEM | Masto, Catherine Cortez | 3.56 | 0.71 | 0.04 | 0.11 | 4.41 | 3% |
| FL | DEM | Demings, Val | 2.82 | 0.61 | 0.20 | 0.34 | 3.98 | 14% |
| NH | DEM | Hassan, Maggie | 2.54 | 1.22 | 0.05 | 0.14 | 3.95 | 5% |
| PA | DEM | Fetterman, John | 2.53 | 0.84 | 0.23 | 0.30 | 3.90 | 14% |
| WI | DEM | Barnes, Mandela | 2.42 | 0.37 | 0.34 | 0.50 | 3.63 | 23% |
| FL | REP | Rubio, Marco | 2.53 | 0.52 | 0.04 | 0.21 | 3.31 | 8% |
| OH | DEM | Ryan, Tim | 2.30 | 0.55 | 0.14 | 0.20 | 3.19 | 11% |
| WI | REP | Johnson, Ron | 2.10 | 0.85 | 0.05 | 0.10 | 3.10 | 5% |
| NC | DEM | Beasley, Cheri | 1.72 | 0.66 | 0.02 | 0.34 | 2.72 | 13% |
| GA | REP | Walker, Herschel | 1.11 | 0.90 | 0.06 | 0.10 | 2.17 | 7% |
| NV | REP | Laxalt, Adam | 1.30 | 0.72 | 0.00 | 0.04 | 2.05 | 2% |
| PA | REP | Oz, Mehmet | 1.49 | 0.17 | 0.02 | 0.11 | 1.79 | 7% |
| CO | DEM | Bennet, Michael | 1.24 | 0.35 | 0.08 | 0.09 | 1.75 | 10% |
| OH | REP | Vance, Jd | 1.00 | 0.28 | 0.00 | 0.07 | 1.35 | 5% |
| WA | DEM | Murray, Patty | 0.80 | 0.31 | 0.03 | 0.17 | 1.30 | 15% |
| WA | REP | Smiley, Tiffany | 0.71 | 0.26 | 0.03 | 0.05 | 1.05 | 8% |
| NC | REP | Budd, Ted | 0.72 | 0.16 | 0.00 | 0.06 | 0.94 | 7% |
| LA | REP | Kennedy, John | 0.56 | 0.33 | 0.02 | 0.03 | 0.94 | 5% |
| MO | DEM | Busch Valentine, Trudy | 0.42 | 0.16 | 0.01 | 0.10 | 0.70 | 16% |
| KY | REP | Paul, Rand | 0.29 | 0.32 | 0.02 | 0.03 | 0.67 | 8% |
| IA | DEM | Franken, Michael | 0.29 | 0.12 | 0.13 | 0.05 | 0.59 | 30% |
| NY | DEM | Schumer, Chuck | 0.25 | 0.30 | 0.01 | 0.02 | 0.58 | 5% |
| CO | REP | O'Dea, Joe | 0.33 | 0.17 | 0.01 | 0.02 | 0.54 | 7% |
| ID | REP | Crapo, Mike | 0.23 | 0.27 | 0.01 | 0.01 | 0.52 | 3% |
| CT | DEM | Blumenthal, Richard | 0.23 | 0.25 | 0.00 | 0.02 | 0.49 | 4% |
| UT | REP | Lee, Mike | 0.41 | 0.04 | 0.03 | 0.02 | 0.49 | 9% |
| SC | REP | Scott, Tim | 0.20 | 0.21 | 0.02 | 0.05 | 0.48 | 16% |
| AK | REP | Murkowski, Lisa | 0.20 | 0.10 | 0.05 | 0.09 | 0.44 | 32% |
| IN | REP | Young, Todd | 0.19 | 0.16 | 0.01 | 0.06 | 0.42 | 15% |
| IA | REP | Grassley, Chuck | 0.38 | 0.00 | 0.00 | 0.01 | 0.40 | 3% |
| ND | REP | Hoeven, John | 0.20 | 0.04 | 0.00 | 0.00 | 0.24 | 1% |
| LA | DEM | Mixon, Luke | 0.19 | 0.00 | 0.00 | 0.00 | 0.19 | 1% |
| UT | UN | Mcmullin, Evan | 0.12 | 0.04 | 0.03 | 0.00 | 0.19 | 15% |
| AR | REP | Boozman, John | 0.14 | 0.04 | 0.00 | 0.00 | 0.18 | 0% |
| MO | REP | Schmitt, Eric | 0.16 | 0.00 | 0.00 | 0.00 | 0.16 | 4% |
| OR | DEM | Wyden, Ron | 0.00 | 0.03 | 0.02 | 0.03 | 0.08 | 65% |
| AK | REP | Tshibaka, Kelly | 0.02 | 0.01 | 0.00 | 0.01 | 0.04 | 27% |
| IL | DEM | Duckworth, Tammy | 0.00 | 0.00 | 0.02 | 0.00 | 0.03 | 100% |
| VT | DEM | Welch, Peter | 0.01 | 0.00 | 0.00 | 0.01 | 0.02 | 51% |
| AZ | REP | Masters, Blake | 0.00 | 0.00 | 0.00 | 0.02 | 0.02 | 100% |
| NH | REP | Bolduc, Donald C. | 0.00 | 0.00 | 0.01 | 0.00 | 0.01 | 100% |
| VT | REP | Malloy, Gerald | 0.00 | 0.00 | 0.00 | 0.00 | 0.01 | 4% |
| AL | REP | Britt, Katie Boyd | 0.00 | 0.00 | 0.01 | 0.00 | 0.01 | 100% |
| TV and radio figures are from September 19, 2022, to October 2, 2022. Figures include coordinated spending between candidates and parties. Numbers include broadcast television, local and national cable, radio, and satellite television. Facebook figures are from September 18, 2022, to October 1, 2022. Google figures are from September 18, 2022, to October 1, 2022. Spending figures smaller than $5,000 will show as $0 in this table. Table includes candidates heading into the general election with at least $5,000 in total spending across these sources. Candidate status provided by OpenSecrets and the Wesleyan Media Project. CITE SOURCE OF DATA AS: Kantar/CMAG (for TV and radio) and the Google and Facebook Ad Libraries (for digital) with analysis by the Wesleyan Media Project. |
||||||||
Additionally, the Wesleyan Media Project is looking at the content of digital ads placed on Facebook. For this report, WMP examined general election Senate candidates and their Facebook ads in the month of September. A longer description of the methodology of the estimates in Table 3 is provided at the end of this report. WMP assessed whether each of the Facebook ads purchased by Senate candidates were likely intended to persuade voters to cast a ballot for or against a candidate or were intended to raise money. The analysis also examines the geographic reach of these ads, reporting the percentage of impressions on Facebook that were in the candidate’s state.
The results suggest a lot of focus on fund-raising out-of-state, but with some notable exceptions. For example, Senator Ron Johnson and Mandela Barnes are both overwhelmingly concentrating their Facebook advertising on Wisconsin. Ninety-five percent of Johnson’s ad impressions are in Wisconsin, and only 4 percent of his ads are estimated to be donation appeals. Similarly, nearly three-quarters (71 percent) of Mandela Barnes’ Facebook ad impressions have been in Wisconsin, and the same percentage feature persuasion appeals, but Barnes has a higher percentage of ads – just over a quarter (27 percent) – seeking donations.
In contrast, nearly 80 percent of John Fetterman’s ads are fund-raising, and only 40 percent of the impressions for his ads were in Pennsylvania. Herschel Walker has devoted over 80 percent of his Facebook ads in September to fund-raising appeals, with only a one-quarter of the impressions from Facebook users in Georgia.
Table 3: Facebook Ad Spending by Senate Candidates (September 5-October 2 )
| Sponsor | Party | State | Pct Goal Persuade | Pct Goal Fundraising | Pct In-State | Est. Spend from Fb Ad Library Report |
|---|---|---|---|---|---|---|
| Warnock, Raphael | DEM | GA | 33% | 48% | 39% | 646,207 |
| Fetterman, John | DEM | PA | 20% | 79% | 42% | 501,608 |
| Barnes, Mandela | DEM | WI | 71% | 27% | 71% | 468,633 |
| Demings, Val | DEM | FL | 25% | 73% | 36% | 395,775 |
| Kelly, Mark | DEM | AZ | 82% | 18% | 67% | 279,939 |
| Ryan, Tim | DEM | OH | 40% | 60% | 50% | 271,798 |
| Franken, Michael T | DEM | IA | 4% | 96% | 7% | 230,396 |
| Bennet, Michael | DEM | CO | 74% | 26% | 78% | 176,647 |
| Johnson, Ron | REP | WI | 94% | 4% | 95% | 100,335 |
| Hassan, Margaret Wood | DEM | NH | 51% | 49% | 53% | 87,582 |
| Cortez Masto, Catherine | DEM | NV | 66% | 29% | 67% | 77,902 |
| Rubio, Marco | REP | FL | 9% | 69% | 39% | 62,917 |
| Murkowski, Lisa | REP | AK | 99% | 0% | 94% | 59,098 |
| Smiley, Tiffany | REP | WA | 100% | 0% | 99% | 47,290 |
| Paul, Rand | REP | KY | 93% | 2% | 93% | 44,626 |
| Murray, Patty | DEM | WA | 74% | 24% | 94% | 43,436 |
| Mcmullin, Evan | UN | UT | 31% | 69% | 45% | 42,109 |
| Scott, Timothy E | REP | SC | 51% | 0% | 21% | 39,406 |
| Duckworth, L. Tammy | DEM | IL | 47% | 49% | 38% | 36,055 |
| Wyden, Ronald Lee | DEM | OR | 100% | 0% | 89% | 33,226 |
| O'Dea, Joseph Matthew | REP | CO | 70% | 30% | 83% | 31,864 |
| Lee, Mike | REP | UT | 17% | 67% | 48% | 28,335 |
| Kennedy, John Neely | REP | LA | 10% | 29% | 32% | 27,875 |
| Oz, Mehmet Dr | REP | PA | 0% | 76% | 14% | 26,134 |
| Beasley, Cheri | DEM | NC | 10% | 90% | 53% | 21,538 |
| Busch Valentine, Trudy | DEM | MO | 0% | 99% | 28% | 17,944 |
| Bolduc, Donald C. | REP | NH | 81% | 0% | 95% | 13,447 |
| Young, Todd Christopher | REP | IN | 100% | 0% | 93% | 11,624 |
| Grassley, Charles E | REP | IA | 58% | 25% | 53% | 10,457 |
| Booker, Charles | DEM | KY | 0% | 100% | 21% | 7,088 |
| Crapo, Michael D | REP | ID | 55% | 30% | 56% | 6,762 |
| Welch, Peter | DEM | VT | 0% | 100% | 9% | 6,617 |
| Budd, Ted | REP | NC | 51% | 48% | 51% | 6,559 |
| Meuser, Mark | REP | CA | 100% | 0% | 95% | 6,222 |
| Pinion, Joseph Iii | REP | NY | 98% | 2% | 12% | 5,948 |
| Schumer, Charles E | DEM | NY | 100% | 0% | 100% | 5,746 |
| Britt, Katie | REP | AL | 100% | 0% | 39% | 5,575 |
| See the About the Data section for a description of the methodology used to produce this table. Figures are from September 5, 2022, to October 1, 2022. Table includes candidates heading into the general election with at least $5,000 in total spending as reported by Facebook. Candidate status provided by OpenSecrets and the Wesleyan Media Project. CITE SOURCE OF DATA AS: Facebook Ad Libraries (for digital) with analysis by the Wesleyan Media Project. |
||||||
O’Rourke Gets Air Cover in Texas;
Crist spending very little in FL, while Ads in Georgia are Nearly Even
Table 4 shows the balance of broadcast advertising in gubernatorial races between September 19 and October 2. In these races, the Democratic advantages are far less consistent than in Senate races. Beto O’Rourke in Texas has benefited from over 13,000 spots in the last two weeks compared to 8,700 for the Republican incumbent, Greg Abbott. Nearly 3 in every 5 pro-O’Rourke ads, however, are from an outside group, a dark money LLC known as Coulda Been Worse.
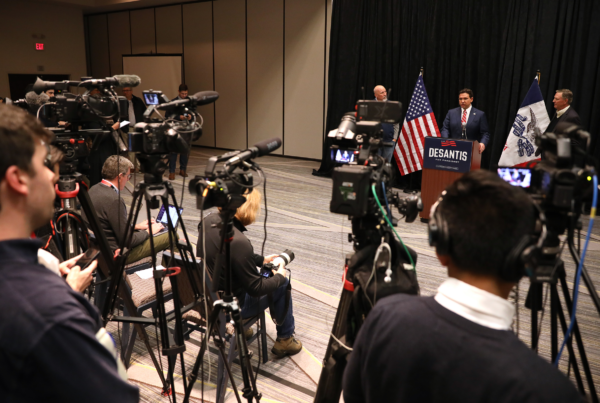
In Florida, however, outside groups are absent from the air war, as is (nearly) the Democratic candidate, Charlie Crist. The Florida Republican Party and incumbent Ron DeSantis have sponsored over 14,000 spots on broadcast television in the last two weeks, compared to just under 2,000 from Crist and the state Democratic Party.
Democrats have large ad advantages in Michigan, Colorado, and Pennsylvania, and smaller advantages in Georgia, Wisconsin, Illinois, and Maine. Outside groups are active on both sides in Wisconsin, but Democrats are getting more help in many races, including Michigan, Kansas, New Mexico, and Maine.
Table 4: Volume of TV Airings in Governor Races (September 19-October 2)
| State | Airings | Pro-Dem Airings | Pro-Rep Airings | Pro-Dem Advantage | % Group Airings | % Pro-Dem IG | % Pro-GOP IG |
|---|---|---|---|---|---|---|---|
| TX | 21,841 | 13,088 | 8,753 | 4,335 | 35.9% | 60.0% | 0.0% |
| FL | 16,283 | 1,957 | 14,326 | -12,369 | 0.0% | 0.0% | 0.0% |
| GA | 12,854 | 6,737 | 6,117 | 620 | 0.0% | 0.0% | 0.0% |
| WI | 10,236 | 5,936 | 4,300 | 1,636 | 50.7% | 44.2% | 59.8% |
| OR | 10,193 | 4,041 | 2,820 | 1,221 | 0.0% | 0.0% | 0.0% |
| NY | 6,211 | 3,369 | 2,842 | 527 | 26.9% | 1.3% | 57.3% |
| MI | 5,532 | 5,309 | 223 | 5,086 | 56.2% | 54.3% | 100.0% |
| NV | 5,519 | 1,865 | 3,654 | -1,789 | 29.4% | 0.0% | 44.4% |
| KS | 5,281 | 2,770 | 2,511 | 259 | 30.7% | 58.6% | 0.0% |
| IL | 5,023 | 3,435 | 1,588 | 1,847 | 31.6% | 0.0% | 100.0% |
| NM | 4,778 | 2,580 | 2,198 | 382 | 35.5% | 65.8% | 0.0% |
| CO | 4,328 | 4,237 | 32 | 4,205 | 23.1% | 22.5% | 100.0% |
| OH | 4,086 | 1,285 | 2,801 | -1,516 | 0.0% | 0.0% | 0.0% |
| ME | 3,468 | 2,338 | 1,130 | 1,208 | 33.1% | 49.1% | 0.0% |
| PA | 2,929 | 2,929 | 0 | 2,929 | 0.1% | 0.1% | |
| CT | 2,917 | 1,724 | 1,193 | 531 | 15.9% | 0.0% | 38.8% |
| MN | 2,615 | 2,281 | 332 | 1,949 | 40.9% | 46.9% | 0.0% |
| AZ | 2,592 | 1,884 | 708 | 1,176 | 0.0% | 0.0% | 0.0% |
| OK | 2,288 | 1,756 | 532 | 1,224 | 63.0% | 82.1% | 0.0% |
| SC | 1,823 | 592 | 1,231 | -639 | 0.0% | 0.0% | 0.0% |
| RI | 1,476 | 468 | 1,008 | -540 | 6.7% | 21.2% | 0.0% |
| TN | 1,292 | 0 | 1,292 | -1,292 | 0.0% | 0.0% | |
| AR | 1,253 | 0 | 1,253 | -1,253 | 0.0% | 0.0% | |
| SD | 965 | 172 | 793 | -621 | 0.0% | 0.0% | 0.0% |
| MA | 874 | 874 | 0 | 874 | 0.0% | 0.0% | |
| IA | 687 | 0 | 687 | -687 | 0.0% | 0.0% | |
| AK | 392 | 0 | 0 | 0 | |||
| NH | 277 | 178 | 99 | 79 | 0.0% | 0.0% | 0.0% |
| MD | 122 | 122 | 0 | 122 | 0.0% | 0.0% | |
| HI | 14 | 14 | 0 | 14 | 0.0% | 0.0% | |
| Figures are from September 19, 2022, to October 2, 2022. Numbers include broadcast television. Table does not show 3,332 airings from independent candidate Betsy Johnson in Oregon. CITE SOURCE OF DATA AS: Kantar/CMAG with analysis by the Wesleyan Media Project. |
|||||||
CA-22 Tops the List of House Races; Groups Active in Most Top Races
Democrats have modest airing advantages (in broadcast television spots) in most high-volume House races, though the top two on the list—CA22 and NM02—are nearly balanced in pro-Democratic and pro-Republican ads. CA22 has drawn astronomical ad totals in the last two weeks, over 10,000 spots. This exceeds the totals in all but three gubernatorial campaigns and five Senate campaigns. The Democrat, challenger Rudy Salas, has benefited from outside group support in 1 of 5 ads on his behalf, while the incumbent Republican, David Valadao, has benefited from more than 2 in 5 ads from outside groups. Similar levels of outside group support are present in many other high-volume House races, with six of the top ten races featuring at least 1 in 3 ads from outside groups.
Table 5: Volume of TV Airings in Top U.S. House Races (September 19-October 2)
| State | District | Airings | Pro-Dem Airings | Pro-Rep Airings | Pro-Dem Advantage | % Group Airings | % Pro-Dem IG | % Pro-GOP IG |
|---|---|---|---|---|---|---|---|---|
| CA | 22 | 10,425 | 5,265 | 5,160 | 105 | 32.8% | 22.3% | 43.6% |
| NM | 2 | 4,641 | 2,268 | 2,373 | -105 | 39.9% | 33.2% | 46.4% |
| MI | 7 | 4,217 | 2,540 | 1,677 | 863 | 21.5% | 15.1% | 31.1% |
| ME | 2 | 4,106 | 2,185 | 1,921 | 264 | 41.5% | 41.0% | 42.1% |
| VA | 7 | 4,106 | 2,241 | 1,865 | 376 | 16.6% | 28.1% | 2.7% |
| MT | 1 | 4,048 | 2,152 | 1,896 | 256 | 22.2% | 41.7% | 0.0% |
| IL | 17 | 3,908 | 2,282 | 1,626 | 656 | 45.5% | 37.4% | 56.8% |
| WA | 8 | 3,669 | 2,431 | 1,238 | 1,193 | 47.2% | 24.3% | 92.0% |
| KS | 3 | 3,434 | 2,041 | 1,393 | 648 | 39.4% | 25.1% | 60.2% |
| IA | 3 | 3,194 | 2,154 | 1,040 | 1,114 | 20.5% | 1.7% | 59.3% |
| CA | 49 | 3,152 | 1,291 | 1,861 | -570 | 59.7% | 50.4% | 66.1% |
| VA | 2 | 3,151 | 2,139 | 1,012 | 1,127 | 35.7% | 20.1% | 68.9% |
| CO | 3 | 3,124 | 0 | 3,124 | -3,124 | 0.0% | 0.0% | |
| NE | 2 | 3,083 | 1,235 | 1,848 | -613 | 30.5% | 0.0% | 50.9% |
| TX | 28 | 3,077 | 1,294 | 1,783 | -489 | 55.3% | 33.1% | 71.5% |
| NY | 19 | 3,011 | 2,323 | 688 | 1,635 | 16.9% | 0.0% | 74.1% |
| CO | 8 | 2,971 | 1,614 | 1,357 | 257 | 31.6% | 0.0% | 69.1% |
| CA | 13 | 2,756 | 969 | 1,787 | -818 | 49.5% | 31.7% | 59.2% |
| OR | 5 | 2,699 | 1,001 | 1,698 | -697 | 36.4% | 0.0% | 57.8% |
| IA | 2 | 2,694 | 941 | 1,753 | -812 | 16.0% | 0.0% | 24.6% |
| MN | 2 | 2,585 | 1,435 | 1,150 | 285 | 47.7% | 21.2% | 80.8% |
| PA | 7 | 2,584 | 1,222 | 1,362 | -140 | 51.2% | 37.6% | 63.5% |
| GA | 2 | 2,565 | 2,565 | 0 | 2,565 | 0.0% | 0.0% | |
| OH | 1 | 2,539 | 1,626 | 913 | 713 | 29.2% | 31.3% | 25.4% |
| MI | 8 | 2,336 | 1,280 | 1,056 | 224 | 42.2% | 32.7% | 53.6% |
| MI | 3 | 2,213 | 1,222 | 991 | 231 | 30.7% | 0.0% | 68.5% |
| NH | 1 | 2,179 | 764 | 1,415 | -651 | 59.5% | 0.0% | 91.6% |
| NV | 4 | 2,167 | 2,167 | 0 | 2,167 | 0.0% | 0.0% | |
| PA | 8 | 2,057 | 954 | 1,103 | -149 | 27.1% | 3.1% | 47.8% |
| OR | 4 | 2,046 | 1,033 | 1,013 | 20 | 4.5% | 0.0% | 9.1% |
| IA | 1 | 1,983 | 706 | 1,277 | -571 | 24.4% | 0.0% | 37.9% |
| NY | 22 | 1,970 | 1,052 | 918 | 134 | 42.7% | 0.0% | 91.6% |
| CT | 5 | 1,964 | 957 | 1,007 | -50 | 66.4% | 49.2% | 82.7% |
| RI | 2 | 1,859 | 996 | 863 | 133 | 46.9% | 26.7% | 70.2% |
| TX | 34 | 1,747 | 764 | 983 | -219 | 95.2% | 89.0% | 100.0% |
| NC | 13 | 1,745 | 633 | 1,112 | -479 | 9.3% | 25.8% | 0.0% |
| AZ | 6 | 1,737 | 661 | 1,076 | -415 | 35.3% | 0.0% | 57.0% |
| OH | 13 | 1,664 | 942 | 722 | 220 | 43.4% | 0.0% | 100.0% |
| IL | 13 | 1,634 | 1,505 | 129 | 1,376 | 55.9% | 60.7% | 0.0% |
| TX | 15 | 1,571 | 455 | 1,116 | -661 | 14.4% | 0.0% | 20.3% |
| NC | 1 | 1,560 | 1,560 | 0 | 1,560 | 0.0% | 0.0% | |
| IN | 1 | 1,543 | 960 | 583 | 377 | 36.1% | 0.0% | 95.5% |
| OR | 6 | 1,394 | 1,169 | 225 | 944 | 26.8% | 32.0% | 0.0% |
| PA | 17 | 1,374 | 660 | 714 | -54 | 55.8% | 38.2% | 72.1% |
| OH | 9 | 1,351 | 1,093 | 258 | 835 | 26.8% | 33.1% | 0.0% |
| CA | 41 | 1,306 | 787 | 519 | 268 | 0.0% | 0.0% | 0.0% |
| AZ | 4 | 1,293 | 1,034 | 259 | 775 | 40.1% | 50.2% | 0.0% |
| WA | 5 | 1,209 | 0 | 1,209 | -1,209 | 0.0% | 0.0% | |
| WI | 3 | 1,206 | 341 | 865 | -524 | 11.0% | 0.0% | 15.4% |
| NV | 3 | 1,205 | 430 | 775 | -345 | 55.9% | 0.0% | 86.8% |
| CA | 9 | 1,164 | 1,164 | 0 | 1,164 | 0.0% | 0.0% | |
| AK | 1 | 1,055 | 1,055 | 0 | 1,055 | 0.0% | 0.0% | |
| NV | 1 | 1,038 | 700 | 338 | 362 | 32.6% | 0.0% | 100.0% |
| Figures are from September 19, 2022, to October 2, 2022. Numbers include broadcast television. CITE SOURCE OF DATA AS: Kantar/CMAG with analysis by the Wesleyan Media Project. |
||||||||
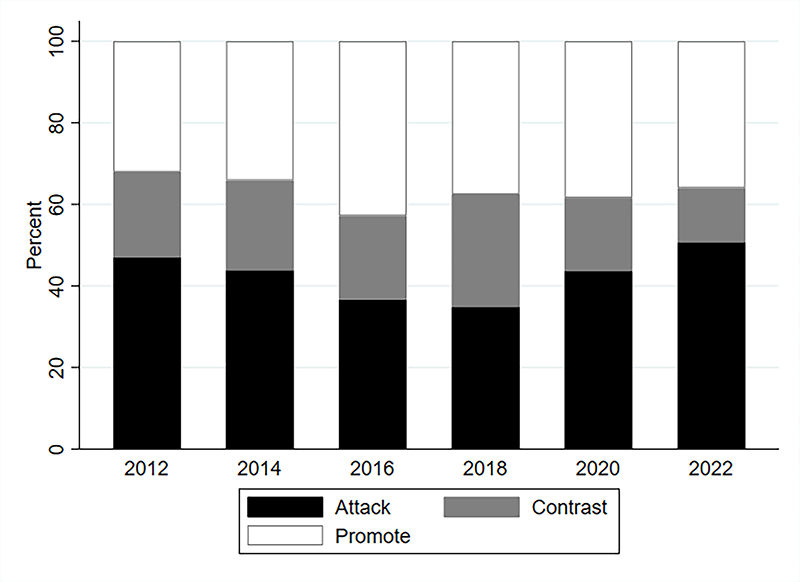
Senate Ads Most Negative of Past Decade
Television advertising in the U.S. Senate general election contests are breaking records for negativity. From September 5 through October 2, more than half (55 percent) of all the broadcast ads on television have been pure attack ads, and more than three in four (76 percent) contain an attack (adding attack and contrast advertising percentages). Both figures indicate record-breaking negativity. The 2022 pure attack percentage is higher than the prior record of 52 percent from the 2012 election, and the prior record for ads containing an attack was 74 percent, set two years ago in the 2020 election.
Figure 1: Tone of U.S. Senate Advertising by Year (September 5-October 2)
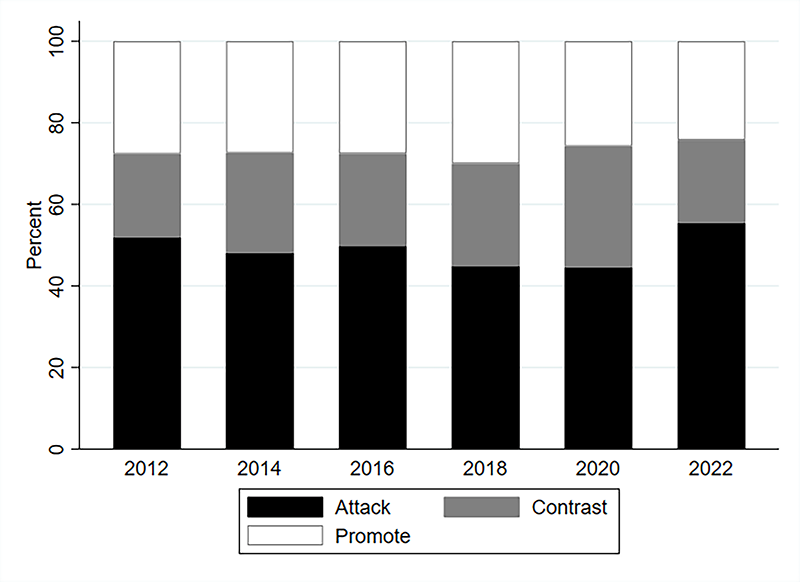
Figures are from September 5-October 2, 2022. Numbers include broadcast television for all sponsors, and 2022 figures are based on ongoing assessments, which are subject to change.
CITE SOURCE OF DATA AS: Kantar Media/CMAG with analysis by the Wesleyan Media Project.
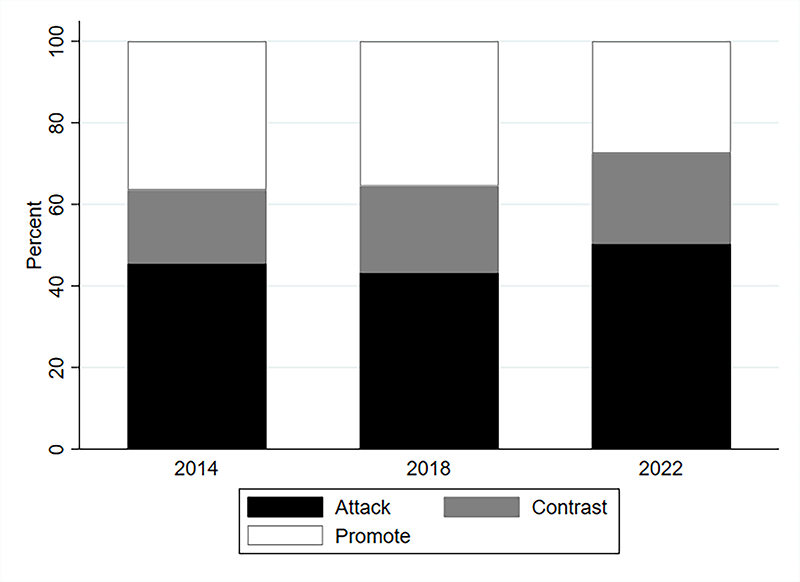
House Negativity Rises Since 2018
On the U.S. House side, the 2022 general election (the September 5 to October 2 period) has also featured many more pure attacks than any other cycle in the past decade. More specifically, 51 percent of ads airing in these races are pure attacks, which is up from a low of 35 percent set in 2018 and above the prior record of 47 percent from the 2012 election.
Figure 2: Tone of U.S. House Advertising by Year (September 5-October 2)
Figures are from September 5-October 2, 2022. Numbers include broadcast television for all sponsors, and 2022 figures are based on ongoing assessments, which are subject to change.
CITE SOURCE OF DATA AS: Kantar Media/CMAG with analysis by the Wesleyan Media Project.
More Negativity in Governor Races in 2022
Turning to gubernatorial races, rates of pure attack ads climbed to 50 percent for the first time in the last decade, well over the prior rates of 43 percent from 2018 and 44 percent from the 2014 midterms.
Figure 3: Tone of Governor Advertising by Year (September 5-October 2)
Figures are from September 5-October 2, 2022. Numbers include broadcast television for all sponsors, and 2022 figures are based on ongoing assessments, which are subject to change.
CITE SOURCE OF DATA AS: Kantar Media/CMAG with analysis by the Wesleyan Media Project.
Record Group Activity in House and Senate Races
As suggested by the race-by-race totals above, outside groups are playing a central role in congressional and gubernatorial campaigns this cycle. The Wesleyan Media Project examined outside group efforts in the five previous election cycles, both for the full cycle up to October 2 and for the September 5 to October 2 period in each cycle. The percentage of total ads sponsored by groups is shown in Table 6, which focuses on broadcast television spots.
Most notable is that outside group efforts are breaking records in House races, with 30 percent of all House ads in the past month sponsored by outside groups and nearly 40 percent of House ads in the full cycle from groups. No prior election comes close to these totals for House races. In Senate campaigns, outside groups have set a record pace in the September period compared to prior elections (over 34 percent of spots compared to the previous record of 32 percent in 2016) and have essentially matched the full cycle record set in 2016 (42.5 percent of ads in 2016 compared to 41.3 percent in this cycle, through October 2).
“Traditionally, groups have made up a small share of ad spending in the House—much smaller than in the Senate—but that is changing in 2022,” said Travis Ridout, co-director of the Wesleyan Media Project. “With the House forecasted to be the most likely to flip control, but both chambers very much in play, outside spending is off the charts this cycle.”
Outside group efforts are slightly smaller as a share, though, in gubernatorial campaigns, comprising 1 in 5 ads in the past month (compared to over one-third of ads in the 2012 cycle during the comparable time-period) and just short of that rate in the full cycle (compared to about 29 percent of all gubernatorial ads in 2012).
Table 6: Percentage of Ads Sponsored by Groups by Race and Year
| Last Month | Full Cycle | |||||
|---|---|---|---|---|---|---|
| House Group % | Senate Group % | Gov Group % | House Group % | Senate Group % | Gov Group % |
|
| 2012 | 14.6% | 21.2% | 35.4% | 18.6% | 33.0% | 28.8% |
| 2014 | 7.4% | 28.8% | 18.0% | 19.1% | 41.2% | 23.2% |
| 2016 | 8.5% | 32.4% | 9.4% | 11.6% | 42.5% | 22.0% |
| 2018 | 15.4% | 28.6% | 19.4% | 22.2% | 37.9% | 16.4% |
| 2020 | 17.4% | 27.9% | 29.4% | 20.7% | 34.9% | 20.3% |
| 2022 | 30.4% | 34.4% | 20.2% | 38.4% | 41.3% | 18.0% |
Dark Money
In partnership with OpenSecrets, the Wesleyan Media Project also tracks outside group ad spending by the type of donor disclosure. We classify groups as full-disclosure groups (meaning they disclose contributor lists to the relevant reporting agency at the federal or state level), non-disclosing dark money groups (which are not required to disclose publicly their donors; these are most often 501c4 non-profits), and partial-disclosure groups (those that disclose donors but also accept contributions from dark money sources).
Table 7 shows that spending by dark money groups is not that common, the only exception being pro-Democratic groups in races for governor, where 37.5 percent of group-sponsored ads are from dark money sponsors. But while full-disclosure groups are common in races for governor, they are rare in races for the House and U.S. Senate. In these congressional races, partial-disclosure groups have dominated group advertising in the past month. Approximately 4 in 5 group ads in Senate races, whether Republican or Democratic, were from partial-disclosing groups, while the share is even higher in U.S. House races.
Table 7: Ad Airings on Behalf of Democrats and Republicans by Outside Groups
| Full | Partial | None | Total | |
|---|---|---|---|---|
| GOVERNOR | ||||
| Pro Dem | 15,844 | 6,827 | 13,578 | 36,249 |
| row % | 43.7% | 18.8% | 37.5% | |
| Pro-GOP | 10,577 | 2,188 | 660 | 13,425 |
| row % | 78.8% | 16.3% | 4.9% | |
| U.S. SENATE | ||||
| Pro Dem | 4,855 | 24,228 | 507 | 29,590 |
| row % | 16.4% | 81.9% | 1.7% | |
| Pro-GOP | 9,519 | 38,426 | 1,165 | 49,110 |
| row % | 19.4% | 78.2% | 2.4% | |
| U.S. HOUSE | ||||
| Pro Dem | 3,054 | 20,391 | 753 | 24,198 |
| row % | 12.6% | 84.3% | 3.1% | |
| Pro-GOP | 1,590 | 47,253 | 0 | 48,843 |
| row % | 3.3% | 96.7% | 0.0% | |
| TOTAL | ||||
| 45,439 | 139,313 | 16,663 | 201,415 | |
| 22.6% | 69.2% | 8.3% | ||
“Fueled in part by party-aligned super PACs funded by closely-tied dark money groups, outside spending on 2022 federal elections has topped $1 billion and is on track to set a new midterm cycle record.” –Anna Massoglia, Editorial & Investigations Manager, OpenSecrets.
“The sudden absence of major dark money groups spending directly on TV ads referring to congressional candidates in the last month as disclosure windows kick in suggests strategic maneuvers to avoid more transparency” –Sheila Krumholz, Executive Director, OpenSecrets.
Table 8 displays the top outside group spenders in federal and gubernatorial races since September 5. Atop the list is the Congressional Leadership Fund, a pro-Republican group that has aired 46,000 spots in congressional races over the past month. The group is classified as a super PAC, but according to analysis by OpenSecrets, the group accepts contributions from other dark money sources, making the PAC a partial-disclosing one. Second on the list is the Senate Leadership fund, which has placed 35,000 spots in Senate races on behalf of Republican candidates. The Democratic House Majority PAC and Senate Majority PAC have each aired over 15,000 ads over the past month. Each of these top four groups in ad volume is a partial-disclosing group. Of the top 10 groups in ad volume since September 5, seven are partial disclosing, one is a dark money group, and two are full disclosure ones.
Table 8: Top Outside Group TV Ad Sponsors (September 5-October 2)
| Sponsor | Total Airings | Senate Airings | House Airings | Gov Airings | Disclose Donors? | Type |
|---|---|---|---|---|---|---|
| Congressional Leadership Fund | 46,322 | 0 | 46,322 | 0 | Partial | SuperPAC |
| Senate Leadership Fund | 35,525 | 35,525 | 0 | 0 | Partial | SuperPAC |
| House Majority PAC | 15,574 | 0 | 15,574 | 0 | Partial | Carey |
| Senate Majority PAC | 15,026 | 15,026 | 0 | 0 | Partial | SuperPAC |
| Coulda Been Worse LLC | 10,566 | 0 | 0 | 10,566 | No | Corp. |
| Put MI First | 5,484 | 0 | 0 | 5,484 | Yes | State IE Comm. |
| Alliance For Common Sense | 4,666 | 0 | 0 | 4,666 | Partial | 527 |
| Right Direction Wisconsin PAC | 4,619 | 0 | 0 | 4,619 | Yes | State PAC |
| Women Vote | 4,137 | 3,733 | 404 | 0 | Partial | SuperPAC |
| Georgia Honor | 3,946 | 3,946 | 0 | 0 | Partial | SuperPAC |
| Kansas Values Institute | 3,012 | 0 | 0 | 3,012 | No | 501c |
| A Stronger New Mexico | 3,010 | 0 | 0 | 3,010 | Yes | 527 |
| Wisconsin Truth PAC | 2,733 | 2,733 | 0 | 0 | Yes | SuperPAC |
| People Who Play by The Rules PAC | 2,715 | 0 | 0 | 2,715 | Yes | State IE Comm. |
| Club For Growth Action | 2,491 | 2,491 | 0 | 0 | Partial | SuperPAC |
| White Mountain PAC | 2,376 | 2,376 | 0 | 0 | Yes | SuperPAC |
| Alliance For Better Minnesota | 2,305 | 0 | 0 | 2,305 | Yes | State IE Comm. |
| LCV Victory Fund | 2,295 | 0 | 2,295 | 0 | Partial | SuperPAC |
| A Stronger Nevada | 2,185 | 0 | 0 | 2,185 | Partial | State PAC |
| Better Maine | 1,903 | 0 | 0 | 1,903 | Partial | State PAC |
| Figures are from September 5 to October 2, 2022. Numbers include broadcast television for all sponsors. CITE SOURCE OF DATA AS: Kantar/CMAG with analysis by the Wesleyan Media Project. |
||||||
Abortion is Top Democratic Issue in House, Gov, and Senate;
Republicans Focus on Budget, Taxes, and Public Safety
Pro-Democratic advertisements have hammered on the issue of abortion over the past two weeks, making abortion the top issue on the Democratic side in Senate, House and gubernatorial races. Twenty-seven percent of pro-Democratic ads in the Senate (Table 9), 38 percent of pro-Democratic ads in the House (Table 10), and 43 percent of pro-Democratic ads in races for governor (Table 11) mention abortion.
For example, 50 percent of the ads from the pro-Beto O’Rourke group, Coulda Been Worse, have mentioned the issues in its ads over the past two weeks. Stacey Abrams has coordinated on ad buys with the group One Georgia in her campaign for Governor, and abortion has been featured in nearly 2 in every 3 of those ads over the past two weeks. Josh Shapiro, the Democratic candidate for Governor in Pennsylvania, has mentioned abortion in 80 percent of his spots over the same period. In Senate campaigns, Val Demings in Florida, who is challenging Marco Rubio, mentioned abortion in 90 percent of her campaign-sponsored ads in the past two weeks. And Senate Majority PAC, the pro-Democratic group, has centered the issue in its ads in Wisconsin, Arizona, Nevada, and Pennsylvania.
By contrast, mentions of abortion in pro-Republican ads are rare. The budget is the top issue mention in pro-Republican ads in races for Senate, House and governor, with mentions of taxes and public safety also common.
All of Greg Abbott’s spots in the last two weeks in the Texas gubernatorial campaign have mentioned public safety concerns. Over half of Brian Kemp’s spots in Georgia are also concerned with public safety. And it is a top issue for the pro-Republican group Senate Leadership Fund in its ads in the Wisconsin, Pennsylvania, and Georgia Senate races.
“We are seeing a real divergence in attention to abortion with Democrats featuring it prominently and Republican ads avoiding the topic,” said Erika Franklin Fowler, co-director of the Wesleyan Media Project, “Republicans, by contrast, are concentrating on the budget, taxes and public safety – all topics that pro-Democratic ads touch on as well, just in lower volumes.”
Table 9: Top Issues in Senate Races by Party Lean (September 19-October 2)
| Issue | Pro-Dem % | Issue | Pro-GOP % |
|---|---|---|---|
| Abortion | 27.4% | Budget | 45.8% |
| Public Safety | 22.6% | Taxes | 39.6% |
| Budget | 16.9% | Public Safety | 39.3% |
| Manufacturing | 15.0% | Economy | 23.5% |
| Jobs | 14.6% | Immigration | 22.3% |
| Healthcare | 14.2% | Inflation | 22.0% |
| Taxes | 14.0% | Drugs | 9.5% |
| Prescription Drugs | 13.3% | Education | 9.4% |
| Trade with China | 11.8% | LGBT | 9.0% |
| Supreme Court | 10.1% | Energy/Environment | 8.9% |
| Figures are from September 19 to October 2, 2022. Numbers include broadcast television for all sponsors. CITE SOURCE OF DATA AS: Kantar Media/CMAG with analysis by the Wesleyan Media Project. |
|||
Table 10: Top Issues in House Races by Party Lean (September 19-October 2)
| Issue | Pro-Dem % | Issue | Pro-GOP % |
|---|---|---|---|
| Abortion | 38.4% | Budget | 49.0% |
| Healthcare | 28.0% | Taxes | 40.8% |
| Public Safety | 21.0% | Economy | 40.2% |
| Budget | 19.9% | Inflation | 37.6% |
| Taxes | 14.7% | Oil | 23.6% |
| Supreme Court | 14.3% | Public Safety | 21.6% |
| Cost of Prescription Drugs | 13.9% | Jobs | 8.8% |
| Jobs | 11.2% | Immigration | 8.1% |
| Energy/Environment | 11.2% | Healthcare | 8.0% |
| Medicare | 10.6% | Prescription Drugs | 6.8% |
| Figures are from September 19 to October 2, 2022. Numbers include broadcast television for all sponsors. CITE SOURCE OF DATA AS: Kantar Media/CMAG with analysis by the Wesleyan Media Project. |
|||
Table 11: Top Issues in Governor Races by Party Lean (September 19-October 2)
| Issue | Pro-Dem % | Issue | Pro-GOP % |
|---|---|---|---|
| Abortion | 42.5% | Budget | 41.1% |
| Budget | 41.2% | Public Safety | 38.7% |
| Education | 29.9% | Taxes | 38.1% |
| Women's Rights | 27.6% | Economy | 26.5% |
| Healthcare | 25.7% | Inflation | 20.0% |
| Taxes | 24.8% | Education | 18.1% |
| Public Safety | 16.0% | Immigration | 18.0% |
| Jobs | 12.9% | Coronavirus | 15.1% |
| Energy/Environment | 11.0% | Jobs | 14.7% |
| Voting | 10.3% | Energy/Environment | 14.3% |
| Figures are from September 19 to October 2, 2022. Numbers include broadcast television for all sponsors. CITE SOURCE OF DATA AS: Kantar Media/CMAG with analysis by the Wesleyan Media Project. |
|||
Cycle-to-Date US. House and Governor TV Ad Volumes are Up;
U.S. Senate Airings Down from 2020 Pace
Over 3.1 million television advertisements have aired in federal and gubernatorial races in the 2022 midterms so far this cycle, an increase of 16.9 percent compared to the same period from the 2018 midterms. Over a million ads have aired in U.S. Senate contests this year, which is a 34 percent increase over 2018 but a 26 percent decrease from 2020. The U.S. House has seen 737,827 airings, which is a 6 percent increase over the prior record of 697,692 from the 2020 cycle (see Figure 4).
Figure 4: Ad Volume in Congressional Races
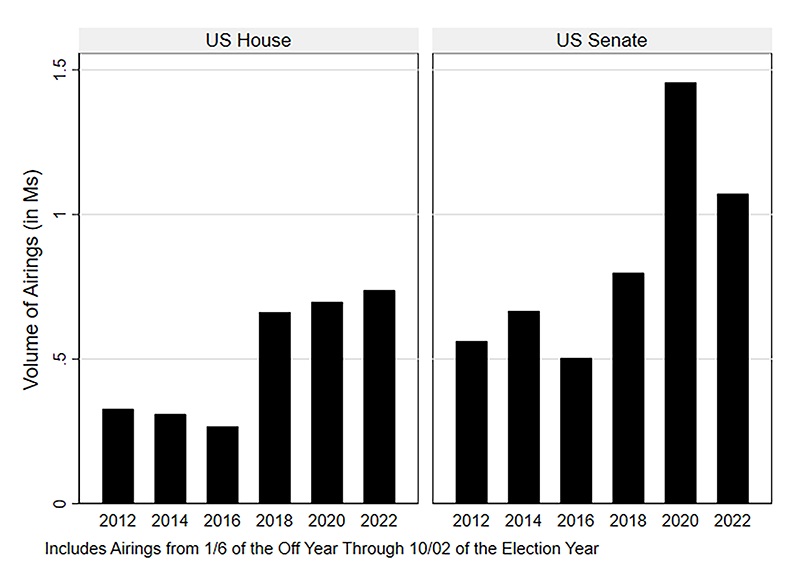
Figures are from January 6 of the off-year to October 2 of the election year for each cycle. Numbers include broadcast television for all sponsors.
CITE SOURCE OF DATA AS: Kantar Media/CMAG with analysis by the Wesleyan Media Project.
Gubernatorial airings are also up by 9 percent over the 2018 midterms with over 1.3 million ads aired in 2022 cycle-to-date compared to 1.2 from the 2018 cycle.
Figure 5: Ad Volume in Gubernatorial Races
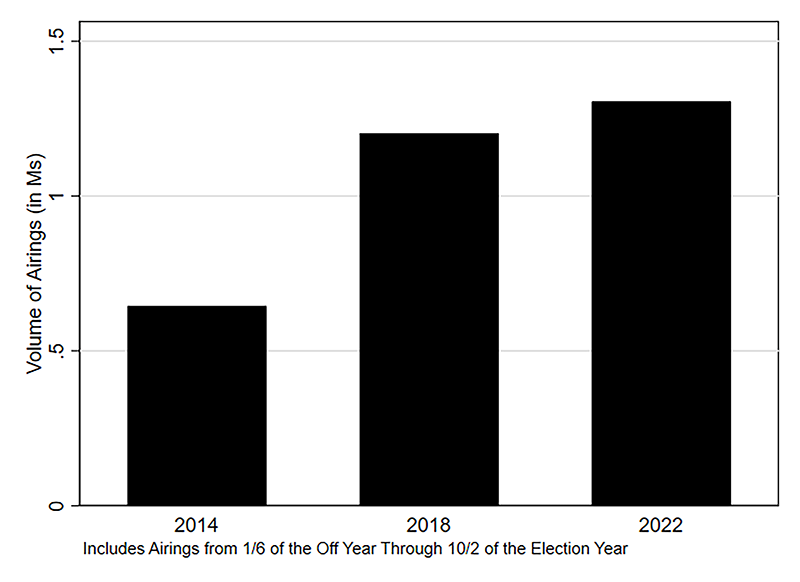
Figures are from January 6 of the off-year to October 2 of the election year for each cycle. Numbers include broadcast television for all sponsors.
CITE SOURCE OF DATA AS: Kantar Media/CMAG with analysis by the Wesleyan Media Project.
About the Data
Television ad totals reported here are from Kantar/CMAG (unless otherwise specified) and refer to broadcast television. All cost estimates for television are precisely that: estimates.
Facebook spending data come from the aggregate reports, which provide spending information for each page name and disclaimer combination. Totals in this report reflect spending between January 6, 2021, September 5, 2022, or September 18, 2022, and October 1, 2022. These totals are calculated by subtracting the reported cumulative spending (as reported by Facebook as the total spent since May 2018) for the October 1, 2022 report and subtracting the cumulative spending reported for January 5, 2021, September 4, or September 17, 2022.
In Table A (click here to download), we list the page names/disclaimer rows from the Facebook aggregate reports that we identified for this report. It is possible that we missed some spending from a Facebook page affiliated with a candidate or group. This is exacerbated by the absence of EIN or FEC identifiers in the Facebook reports.
For Google ads, we downloaded the weekly reports from the platform’s Transparency Report. The totals reflected in this release are current as of 9/20/22, the day on which we pulled the transparency report. Google only includes spending in federal and state races and only includes weekly totals but lists the sponsor’s EIN or FEC committee ID. Google spending is from the following time periods: January 10, 2021 or September 18, 2022 and October 1, 2022.
In Table B (click here to download), we list the advertiser name for all entities used in this report to calculate Google spending totals.
For Table 3 figures in this report, we utilize content information from Facebook ads and machine learning to assess the predicted goal of the ad and to calculate whether the ad was primarily seen by users inside or outside each candidate’s state.
To determine the ad goal, human coders at WMP classify ads into several types of goals, including persuasion, fund-raising, contact, purchase, get out the vote, event, polling, gathering information, and learning more. In this report we focus only on the ad goals of persuasion and fund-raising. Random forest classifiers (one model per goal) were trained and validated on an 80/20 split sample of 3,671 human-coded ads. The F1-score performance for each classifier was 85 percent for persuasion and 99 percent for fund-raising. The models are binary predictions and therefore it is possible that an ad ID could be identified as both persuasion and fund-raising. We apply these classification models to the Facebook data retrieved through Facebook’s API. This includes the following text fields: ad creative body, page name, disclaimer, ad creative link caption, ad creative link title, and ad creative link description. Additionally, we transcribe the audio of the videos through automatic speech recognition and then concatenate the API text fields and the transcribed audio together for classification at the unique ad ID level.
For in-state ads, we identified the state of each senator and used Facebook’s “delivery by region” variable to identify what proportion of an ad’s impressions went to the senator’s state.
Unique ad IDs are best thought of as unique purchases by the advertiser rather than unique creatives because of the way Facebook assigns ad IDs, and each ad ID has an estimated upper and lower bound on spending. We filter out advertising from each page that occurred before September 5, 2022 but keep unique IDs that ran between September 5 and October 1, 2022, even if the ad started before September 5.
We calculated estimated spend by taking the average of the upper and lower spending bounds for each ad ID. In order to calculate the percentage of a candidate’s ads associated with each goal, we created new ad-level variables (goal_persuade_spending, goal_donate_spending). These new variables were assigned the estimated ad spend if the binary predication variable for that goal equaled one (an ad ID can be assigned both goals). For the in-state calculations, Facebook provides the proportion of the ad ID’s impressions by state, so we applied this proportion for the candidate’s state to the estimated ad spend for each ad ID, giving us a variable with the estimated in-state spending per ad ID (instate_spending).
We then sum over all of the ad IDs for each candidate to arrive at an estimated amount of spending devoted to each goal and to in-state impressions. We then calculate the percentage of each candidate’s advertising for each of those variables. Because the ad-level spending is reported in buckets by Facebook (upper bound and lower bound), rather than in actual spending, in Table 3 we report only the actual spending reported in the Facebook ad library report even though we used the bucketed spending to produce the percentages.
About this Report
The Wesleyan Media Project provides real-time tracking and analysis of all political television advertising in an effort to increase transparency in elections. Housed in Wesleyan’s Quantitative Analysis Center – part of the Allbritton Center for the Study of Public Life – the Wesleyan Media Project is the successor to the Wisconsin Advertising Project, which disbanded in 2009. It is directed by Erika Franklin Fowler, professor of government at Wesleyan University, Michael M. Franz, professor of government at Bowdoin College and Travis N. Ridout, professor of political science at Washington State University. WMP personnel include Laura Baum (Associate Director), Breeze Floyd (Research Coordinator), Pavel Oleinikov (Associate Director, QAC), Markus Neumann (Post-Doctoral Fellow), and Jielu Yao (Post-Doctoral Fellow).
Data are provided by Kantar/CMAG with analysis by the Wesleyan Media Project. The Wesleyan Media Project is partnering again this year with OpenSecrets, to provide added information on outside group disclosure and candidate status.
The Wesleyan Media Project’s digital advertising tracking is supported by the contributions of students in Delta Lab, an interdisciplinary research collaborative focusing on computationally-driven and innovative analyses and visualizations of media messaging.
Periodic releases of data will be posted on the project’s website and dispersed via Twitter @wesmediaproject. To be added to our email update list, click here.
For more information contact: media@wesleyan.edu.
About Wesleyan University
Wesleyan University, in Middletown, Conn., is known for the excellence of its academic and co-curricular programs. With more than 2,900 undergraduates and 200 graduate students, Wesleyan is dedicated to providing a liberal arts education characterized by boldness, rigor and practical idealism. For more, visit www.wesleyan.edu.