Photo: Gage Skidmore/Flickr
Biden up big in ad war,
overtakes Trump in recent digital spend
Report Highlights
President
- Top TV spenders in the presidential race (Table 1)
- Biden overtakes Trump in digital advertising (Table 2)
- Pro-Biden ads outnumber pro-Trump ads in all top media markets (Table 3)
- Map of presidential candidate TV ad airings (Figure 1) and interactive map of Facebook advertising (Figure 2)
- Pro-Trump ads much more negative than ads for Biden (Figure 3)
- Biden stresses pandemic, healthcare; Trump talks jobs, immigration (Table 4)
US Senate
- Dems lead ad race in all top Senate contests (Table 5)
- Digital ad spending in Senate races (Table 6)
- ME, AZ, IA are among the most negative Senate contests (Table 7)
- Issues in Senate TV ads (Table 8)
US House
- Dems hold an ad advantage in most top House races, including NM02, CA21, NY22, UT04 (Table 9)
- AOC is top digital ad spender in House, spending almost $4M across Facebook and Google in 2020 (Table 10)
Other Highlights
- Cycle-to-date, presidential ad volume is up 145% over 2016 totals and 87% over 2012 totals (see here)
- Cycle-to-date, ad volume in U.S. Senate races is up 193% and in U.S. House races is up 152% over 2016 (see here)
- Dark money groups ad airings update (Table 12)
- Interactive tables of Facebook advertisers that are mentioning presidential and Senate candidates in their ads (Tables 13 and 14)
(MIDDLETOWN, CT) October 1, 2020 – A new analysis from the Wesleyan Media Project, in conjunction with the Center for Responsive Politics, finds that Democrats—helped by pro-Democratic interest groups—have dominated ad spending in the presidential, Senate and House races since Labor Day.
In the presidential race, Joe Biden’s campaign was the top spender since September 5, purchasing almost $95 million worth of broadcast and national television advertisements totaling 135,000 ad airings. That’s over twice the spending of Donald Trump’s campaign, which purchased $41 million in ads, which constitutes 59,000 ad airings. Although the Biden campaign’s ad advantage is large, it is mitigated somewhat by spending from pro-Trump groups—namely, Preserve America PAC and America First Action—each of which paid for about 12,000 ad airings in the past month.
All told, sponsors, including candidates and groups, have spent $112 million on pro-Democratic presidential ads (151,597 airings) since September 5. Spending on pro-Republicans ads was $80 million (83,721 airings).
Table 1: Top TV Spenders in Presidential Race (since September 5)
| Sponsor | Airings | Spending ($) | Party |
|---|---|---|---|
| Biden, Joe | 135,382 | 94,682,260 | D |
| Trump, Donald | 58,714 | 41,494,410 | R |
| Preserve America PAC | 12,534 | 22,967,080 | R |
| America First Action | 11,395 | 12,635,710 | R |
| Priorities USA Action | 8,897 | 10,063,540 | D |
| AB PAC | 4,848 | 4,409,450 | D |
| Everytown For Gun Safety Victory Fund | 1,577 | 2,009,890 | D |
| Restoration PAC | 334 | 1,356,650 | R |
| Committee to Defend the President | 375 | 846,470 | R |
| Republican Voters Against Trump | 508 | 707,590 | D |
| Nra Victory Fund, Inc. | 353 | 257,830 | R |
| Por Nuestras Familias | 268 | 205,600 | D |
| Nuestro PAC | 16 | 149,190 | D |
| Meidastouch | 59 | 144,750 | D |
| VoteVets | 30 | 52,420 | D |
| Aft Solidarity | 2 | 22,440 | D |
| Vote Vets & Nuestro PAC | 5 | 17,300 | D |
| Future45 | 1 | 15,370 | R |
| Conservatives For Effective Government | 15 | 6,970 | R |
| The Lincoln Project | 2 | 840 | D |
| Defending Democracy Together | 2 | 820 | D |
| Biden, Joe & DNC | 1 | 60 | D |
| Numbers include ads aired on broadcast television and national cable between September 5 and 27, 2020. CITE SOURCE OF DATA AS: Kantar/CMAG with analysis by the Wesleyan Media Project. |
|||
Biden Jumps Past Trump in Digital Spending
Although Trump has dominated digital ad spending for almost the entire election cycle, Biden has taken the lead in digital ad spending during the past three weeks. Table 2 shows spending by the Biden and Trump campaigns (and their associated super PACs) on Facebook and Google advertising since April and since September 5. In the past few weeks, Biden’s digital spending has outpaced Trump’s digital spending by about $9 million, $32.6 million for Biden compared to $23.5 million for Trump. The lead comes from Biden’s spending on Google where he is outspending Trump by $10 million dollars ($19.4 million compared to Trump’s $9 million). Facebook spending is much closer. Biden’s spending trails Trump’s spending slightly, $13.2 million to $14.4 million. Looking at the total general election period (since April), however, the Trump campaign has spent more on digital ads ($135 million) than the Biden campaign ($102 million). Notably, since our last release, the Trump campaign has set up several new Facebook pages designed to target specific states (e.g., Trump for Wisconsin, Trump for North Carolina, etc) along with another page called “Promises Made Promises Kept.”
Not included in the table is an additional large digital lead for Biden in spending on Snapchat. Biden has spent $1.1 million on Snapchat from September 5-27 compared to Trump’s $72,481. Over the general election from April 9 through September 27, Biden and Trump have spent $1.6 million and $114,332, respectively, on the platform.
“For most of the general election period, Donald Trump has had a huge advantage in digital ads. The gap is quickly narrowing,” said Erika Franklin Fowler, co-director of the Wesleyan Media Project. “Biden’s TV ad advantage and his increased digital spending put him pretty far ahead in recent paid messaging.”
Table 2: Digital Ad Spending by Presidential Candidates and Single-Candidate SuperPACs
| FB $ (since mid-April) | FB $ (since early Sept) | Google $ (since mid-April) | Google $ (since early Sept) | FB+Google $ (since mid-April) | FB+Google $ (since early Sept) |
|
|---|---|---|---|---|---|---|
| Biden | 51,639,719 | 13,184,975 | 50,128,300 | 19,381,600 | 101,768,019 | 32,566,575 |
| Trump | 77,620,820 | 14,444,982 | 57,609,800 | 9,008,800 | 135,230,620 | 23,453,782 |
| Unite the Country (pro-Biden) | 785,791 | 50,960 | 29,900 | 0 | 815,691 | 50,960 |
| Great America PAC (pro-Trump) | 44,150 | 0 | 0 | 0 | 44,150 | 0 |
| Digital spending figures come from the Facebook ad library reports and the Google Transparency Report. Spending covers April 9 or September 5 to September 26, 2020 (for Facebook); April 12 or September 6 to September 26, 2020 (for Google). Candidate spending numbers include spending by official campaign committees, leadership PACs, and joint fundraising committees. See “About the Data” section at the end of this report for more information on our methodology along with the specific page names and disclaimers that are counted. |
||||||
Pro-Biden Ads Outnumber Pro-Trump Ads in All Top Media Markets
Two Florida media markets, Orlando and Tampa, have seen the most presidential ad airings since Labor Day weekend—over 11,000 each (Table 3). In both of those markets, pro-Biden ads outnumbered pro-Trump ads—as is the case with every top media market. Arizona, Wisconsin and North Carolina media markets also make the top ten in terms of the number of ads aired.
Table 3: Volume and Spending on Presidential Ads by Media Market (Since September 5)
| Market | State | Airings | Spending ($) | Pro-Biden | Pro-Trump | Biden Adv |
|---|---|---|---|---|---|---|
| Orlando | FL | 11,886 | 15,281,390 | 7,069 | 4,817 | 2,252 |
| Tampa | FL | 11,581 | 12,262,670 | 7,227 | 4,354 | 2,873 |
| Phoenix | AZ | 9,335 | 11,911,750 | 5,745 | 3,590 | 2,155 |
| Miami | FL | 8,882 | 9,310,860 | 6,395 | 2,487 | 3,908 |
| Green Bay | WI | 7,980 | 3,366,190 | 4,621 | 3,359 | 1,262 |
| Raleigh | NC | 7,363 | 7,473,820 | 4,197 | 3,166 | 1,031 |
| Tucson | AZ | 7,154 | 3,046,620 | 4,815 | 2,339 | 2,476 |
| Milwaukee | WI | 7,079 | 5,041,480 | 4,651 | 2,428 | 2,223 |
| Charlotte | NC | 6,960 | 8,181,860 | 3,945 | 3,015 | 930 |
| Detroit | MI | 6,774 | 6,845,180 | 5,734 | 1,040 | 4,694 |
| Philadelphia | PA | 6,588 | 7,465,290 | 5,249 | 1,339 | 3,910 |
| Jacksonville | FL | 6,396 | 2,834,040 | 4,041 | 2,355 | 1,686 |
| Harrisburg | PA | 6,368 | 3,928,270 | 4,717 | 1,651 | 3,066 |
| Johnstown | PA | 6,050 | 2,027,590 | 4,403 | 1,647 | 2,756 |
| Minneapolis | MN | 5,888 | 5,091,820 | 3,902 | 1,986 | 1,916 |
| West Palm Beach | FL | 5,605 | 2,944,610 | 3,138 | 2,467 | 671 |
| Greensboro | NC | 5,541 | 3,613,430 | 2,964 | 2,577 | 387 |
| Wilkes Barre | PA | 5,458 | 3,528,030 | 3,346 | 2,112 | 1,234 |
| Grand Rapids | MI | 5,405 | 2,584,010 | 4,225 | 1,180 | 3,045 |
| Ft. Myers | FL | 5,335 | 1,895,360 | 3,734 | 1,601 | 2,133 |
| Pittsburgh | PA | 5,200 | 4,992,350 | 3,831 | 1,369 | 2,462 |
| La Crosse | WI | 4,933 | 1,555,110 | 3,111 | 1,822 | 1,289 |
| Greenville | NC | 4,881 | 1,965,660 | 2,441 | 2,440 | 1 |
| Lansing | MI | 4,282 | 964,980 | 2,886 | 1,396 | 1,490 |
| Madison | WI | 4,236 | 1,372,670 | 3,195 | 1,041 | 2,154 |
| Numbers include ads aired on broadcast television between September 5 and 27, 2020. Numbers include candidate, party, and group-sponsored ads. Click here to download the full list as a spreadsheet. CITE SOURCE OF DATA AS: Kantar/CMAG with analysis by the Wesleyan Media Project. |
||||||
As Figure 1 shows, the television advertising advantage map has turned largely blue, with many markets in key states—Florida, Pennsylvania and Michigan—a deep blue. This indicates a substantial advantage for Biden. Trump has his largest advantage (since September 5) in Atlanta, followed by several other Georgia media markets (and small additional advantages in Iowa and Maine’s second congressional district).
Figure 1: Advertising Advantage in the Presidential Race on Television
Numbers include ads aired on broadcast television (excluding national cable airings) between April 9, 2020 and September 27, 2020,
and between September 5, 2020 and September 27, 2020.
Figure by Delta Lab’s Spencer Dean ’21 and Kevin McMorrow ’20
Download the data in this map as a spreadsheet.
CITE SOURCE OF DATA AS: Kantar/CMAG with analysis by the Wesleyan Media Project.
Looking at the regional spend on Facebook for the same time period (between September 6 and September 26, 2020), we see a lot of consistency between Trump and Biden in where the battlegrounds are. Florida is a key focus for both campaigns, followed by Pennsylvania.
Figure 2: Regional Focus of Facebook Advertising by Top Sponsors Over Time
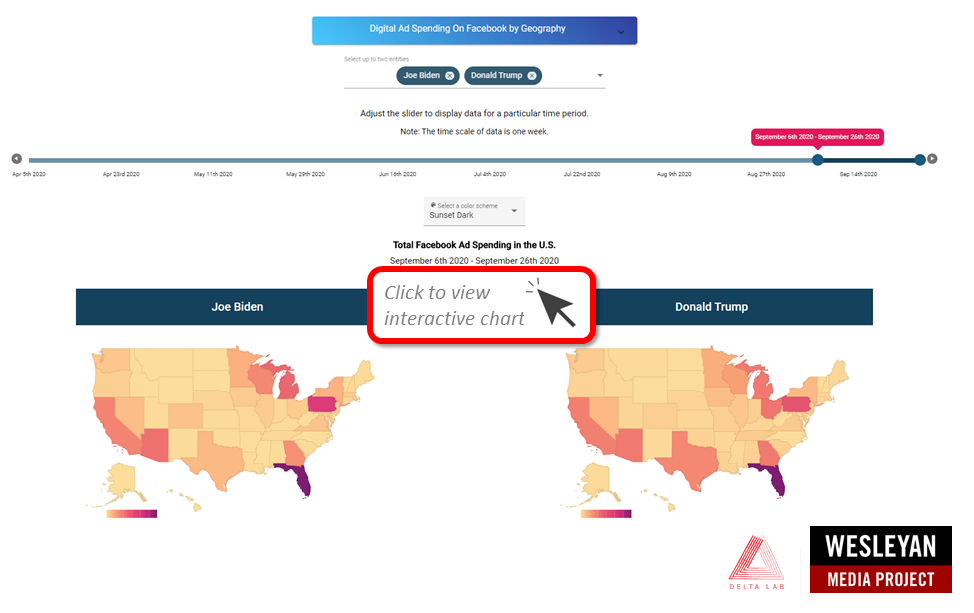
Digital spending comes from the Facebook ad library reports. Data visualization application by Delta Lab’s Roshaan Siddiqui ’22. Classifications from the Wesleyan Media Project with help from the Center for Responsive Politics.
Pro-Trump Ads Much More Negative Than Ads for Biden
Figure 3 shows the volume of ads from pro-Biden and pro-Trump forces over the month of September, broken down by the tone of ads. The top panels show volume of airings, where Biden’s television advantage is clear, while the bottom panel shows the percentage of airings by tone. Biden and his allies have sponsored very few pure attacks on Trump, preferring instead to air ads that contrast the president with Biden. The pro-Biden camp has also aired promotional spots in every week, though their share of the ad activity has decreased over the prior two weeks.
Trump has shifted his ad strategy from pure attacks on Biden to a lot of contrasts with the former vice president, and in the last week has started airing some positive ads, though these are still small in number in comparison to ads that make contrasts with or attack Biden. (An earlier release incorrectly classified one Trump ad as promotional rather than contrast, which once corrected means that Trump had very few promotional airings in early September.)
Figure 3: Weekly Volume and Percentage of Presidential Airings by Tone
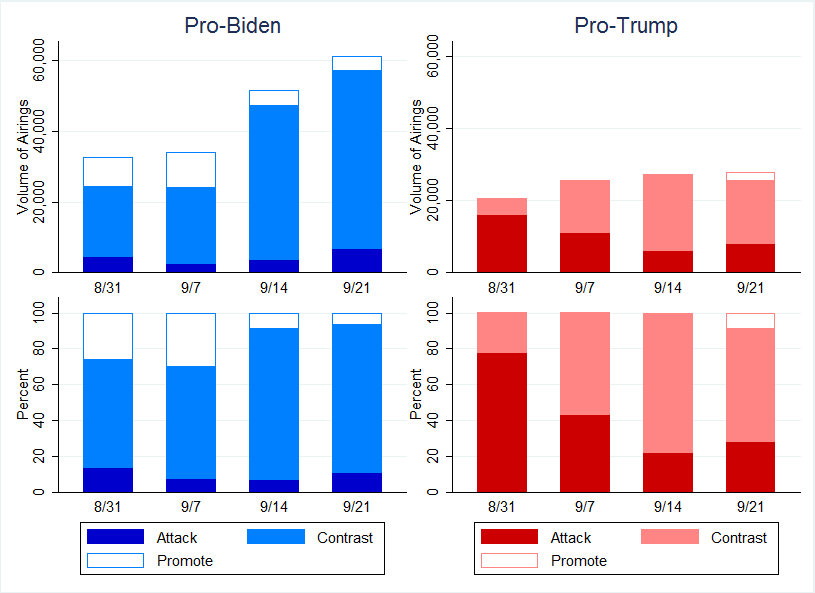
Numbers include ads aired on broadcast television and national cable between August 31 and September 27 for pro-Biden airings (left panel) and pro-Trump airings (right panel). Numbers include candidate, party, and group-sponsored ads. CITE SOURCE OF DATA AS: Based on ongoing Wesleyan Media Project coding of Kantar/CMAG data, which is subject to change.
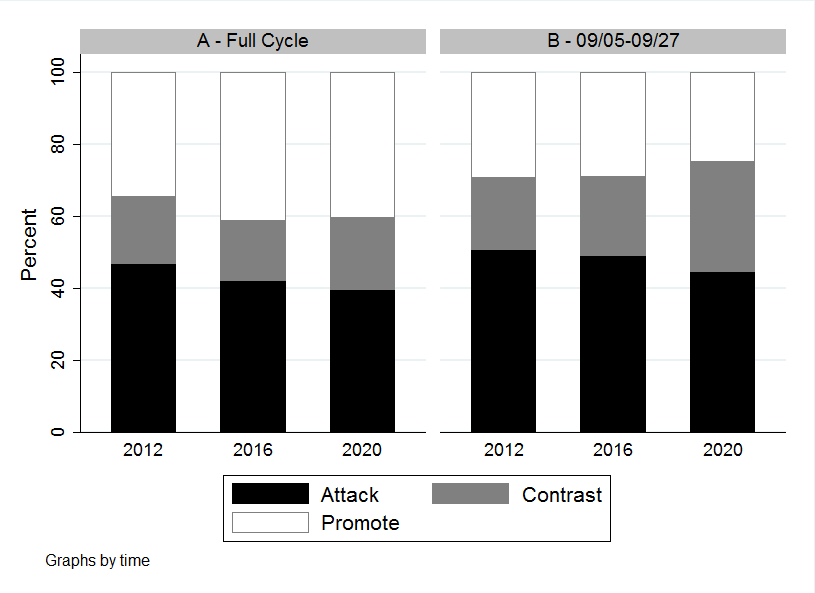
Comparing 2020 advertising to past cycles, the past few weeks of this presidential campaign and the general election period overall have seen fewer pure attacks. Contrast ads this cycle, however, are a higher share of ads than in previous years, both in the full general election period and in the last three weeks. If one combines contrast and attack ads, then 2020 is very similar to the 2012 campaign in negativity overall and in the last few weeks.
Figure 4: Tone of Advertising in Presidential Race (2012, 2016 and 2020)
Numbers include ads aired on broadcast television and national cable between April 9 and September 27 in each year (left panel) and between September 5-27 in each year (right panel). Numbers include candidate, party, and group-sponsored ads.
CITE SOURCE OF DATA AS: Based on ongoing Wesleyan Media Project coding of Kantar/CMAG data, which is subject to change.
On Facebook over the September 5-27 period, Biden has been more likely to mention Trump than vice versa. We estimate that 37.5 percent of Biden’s $13.1 million in spending references Trump, whereas only 17.6 percent of Trump’s $14.4 million in Facebook advertising mentions Biden.
Biden Stresses Pandemic, Healthcare; Trump Talks Jobs, Immigration
Table 4 shows the top issues mentioned by the Biden and Trump campaigns in their television airings since September 5. The COVID-19 pandemic remains the top issue for Biden, appearing in half of his ad airings. Health care as a general issue is mentioned in 41 percent of Biden ad airings, followed by Social Security, which appears in about 30 percent of his airings. By contrast, the top issue for Trump has been jobs, which was mentioned in 63 percent of his ad airings since early September. Immigration is mentioned in just over half of Trump’s ad airings, while the economy is mentioned in just under half. COVID-19, while not emphasized as much as by Biden’s campaign, is mentioned in a third of Trump’s ad airings, often in the context of his “great America comeback” theme and his claim of an impending vaccine.
“Biden’s focus on health care is readily apparent,” said Travis Ridout, co-director of the Wesleyan Media Project. “Beyond his generic health care ad messages, he has discussed healthcare expansion and access in 20 percent of his ads; Obamacare in 17 percent; universal health care in 9 percent; and prescription drugs in 8 percent.”
All told, Biden’s focus on health care is up from our analysis of his ads through the start of August, where generic references to health care appeared in 31.7 percent of his ads.
Notably, looking at the trend across the month of September, there is no evidence of an increase overall in the frequency of health care mentions in either the presidential race or across Senate races since the passing of Ruth Bader Ginsburg on September 18. Because the Court will consider the ACA again in the immediate aftermath of the election, Democrats in particular have suggested that campaigns would emphasize issues around health care more in recent days (pointing to the stakes of the outcome of the election around the Court vacancy). We do not yet see evidence that health care has grown as an issue in the week or so since Ginsburg’s death—perhaps because it has always been core issue for Democrats this cycle or perhaps because there has not been enough time to detect an effect.
Similarly, we see little mention of the Supreme Court vacancy more generally in ads since September 18. It was mentioned in just 3 percent of Senate election ads since September 19, though notably the issue was rarely ever mentioned in ads before then (only 1.5 percent mentioned it from January 1, 2019 through September 18, 2020).
Table 4: Issue Focus of Biden and Trump Ads
| % of Airings | % of Airings | ||
|---|---|---|---|
| COVID-19 | 50.1% | Jobs | 63.0% |
| Health care | 41.3% | Immigration | 50.8% |
| Social Security | 29.6% | Economy (generic) | 47.2% |
| Taxes | 22.4% | Medical bills | 37.1% |
| Health care expansion/access | 20.3% | COVID-19 | 33.3% |
| Medicare | 20.2% | Business | 29.5% |
| Obamacare | 16.9% | Taxes | 29.5% |
| Seniors (not Medicare) | 11.6% | Emergency prep/response | 27.0% |
| Business | 10.5% | Vaccines | 26.9% |
| Emergency prep/response | 10.1% | Gov't spending | 24.8% |
| Protests/riots | 9.4% | Camp. finance reform | 19.5% |
| Universal health care | 8.9% | Energy policy | 19.4% |
| Economy (generic) | 8.5% | Medicare | 17.8% |
| Education | 8.3% | Social security | 17.8% |
| Prescription drugs | 8.0% | Medicaid | 17.8% |
| Numbers include ads aired on broadcast television between September 5 and 27, 2020. Totals refer only to candidate-sponsored ads. CITE SOURCE OF DATA AS: Based on ongoing Wesleyan Media Project coding of Kantar/CMAG data, which is subject to change. |
|||
Dems Lead Ad Race in All Top Senate Contests
Pro-Democratic ads outnumber pro-Republican ads in almost all Senate races in the period since September 5 (Table 5). The largest number of ad airings was in Montana’s race between Steve Daines and Steve Bullock—over 44,000—while the most expensive race was in Michigan, with over $33 million spent on broadcast advertising. The race in North Carolina also topped the $30 million mark in ad spending this month.
Notable is that incumbent Senator Lindsey Graham is being pummeled by Democratic rival Jaime Harrison in South Carolina, where pro-Harrison ads are more than twice as frequent as pro-Graham ads. Even Senator Doug Jones of Alabama—widely believed to be the most vulnerable Democratic incumbent—has a huge ad advantage over his opponent Tommy Tuberville.
“The fact that Democrats are able to air more ads than Republicans in every Senate race—even ones where their chances are slim—suggests that they have little problem raising money this year,” said Michael Franz, co-director of the Wesleyan Media Project. “Donald Trump has been very good for Democratic fundraising.”
Outside groups have contributed to the high ad volumes in many states. For instance, in North Carolina, over 60 percent of the ad airings have been paid for by groups, while in Maine and Kansas, groups accounted for over 40 percent of the ad airings.
Table 5: Senate Ad Airings and Spending
| State | Airings | Spending ($) | Pro-Dem | Pro-GOP | Dem Adv | % group |
|---|---|---|---|---|---|---|
| MT | 44,267 | 14,512,980 | 24,279 | 19,988 | 4,291 | 23.30% |
| IA | 39,058 | 20,753,170 | 24,345 | 14,713 | 9,632 | 33.90% |
| GA | 36,669 | 21,099,610 | 19,475 | 17,129 | 2,346 | 36.80% |
| NC | 30,388 | 31,419,810 | 19,669 | 10,719 | 8,950 | 61.30% |
| SC | 27,119 | 9,846,420 | 18,880 | 8,239 | 10,641 | 3.50% |
| AZ | 23,897 | 20,108,480 | 13,264 | 10,633 | 2,631 | 33.70% |
| KY | 21,104 | 7,430,780 | 12,414 | 8,690 | 3,724 | 22.10% |
| MI | 20,766 | 33,149,780 | 11,167 | 9,599 | 1,568 | 25.70% |
| ME | 17,851 | 13,260,630 | 9,587 | 7,913 | 1,674 | 41.20% |
| CO | 16,693 | 9,594,220 | 8,603 | 8,090 | 513 | 29.70% |
| KS | 12,160 | 4,985,800 | 8,199 | 3,961 | 4,238 | 42.20% |
| AL | 10,819 | 2,198,460 | 8,862 | 1,957 | 6,905 | 0.00% |
| AK* | 10,593 | 1,822,410 | 3,070 | 3,398 | -328 | 31.7 % |
| TX | 5,672 | 3,563,570 | 3,429 | 2,243 | 1,186 | 0.00% |
| VA | 5,616 | 1,549,680 | 4,643 | 973 | 3,670 | 0.00% |
| NM | 4,530 | 3,306,030 | 3,014 | 1,516 | 1,498 | 10.60% |
| MN | 4,479 | 2,138,510 | 4,014 | 465 | 3,549 | 2.00% |
| LA | 3,499 | 742,090 | 0 | 3,499 | -3,499 | 0.00% |
| MS | 2,829 | 357,790 | 2,578 | 251 | 2,327 | 0.00% |
| OK | 2,809 | 794,420 | 1,041 | 1,768 | -727 | 0.00% |
| NH | 1,551 | 695,660 | 1,373 | 178 | 1,195 | 0.00% |
| DE | 570 | 367,360 | 570 | 0 | 570 | 0.00% |
| SD | 191 | 37,670 | 191 | 0 | 191 | 0.00% |
| ID | 126 | 19,200 | 0 | 126 | -126 | 0.00% |
| IL | 4 | 2,400 | 0 | 0 | 0 | 0.00% |
| Numbers include ads aired on broadcast television between September 5 and 27, 2020. Numbers include candidate, party, and group-sponsored ads. *Numbers in the Democratic columns for the Alaska Senate race show airings and spending by and on behalf of Al Gross, the independent candidate in that race. CITE SOURCE OF DATA AS: Kantar/CMAG with analysis by the Wesleyan Media Project. |
||||||
Dem Challengers Are Top Digital Ad Spenders
Table 6 speaks to digital ad spending by U.S. Senate candidates on Facebook (including Instagram) and Google (including YouTube). A trio of Democrats taking on Republican incumbents in South Carolina, Kentucky and Arizona top the list. Indeed, Jaime Harrison’s campaign in South Carolina has spent almost $4 million since early September on digital advertising. Amy McGrath, who is challenging Mitch McConnell in Kentucky, has spent almost $2 million on digital ads, with Mark Kelly in Arizona not far behind. Since January 1, Senate candidates have spent $71,852,798 on Facebook and Google ads.
Table 6: Top U.S. Senate Digital Ad Spenders on Facebook and Google (Since Early September)
| State | Party | FB+Google (since early Sept) | FB (since early Sept) | Google (since early Sept) |
|
|---|---|---|---|---|---|
| SC | DEM | Harrison, Jaime | $ 3,930,828 | $ 2,896,828 | $ 1,034,000 |
| KY | DEM | McGrath, Amy | $ 1,968,790 | $ 660,790 | $ 1,308,000 |
| AZ | DEM | Kelly, Mark | $ 1,877,915 | $ 1,093,515 | $ 784,400 |
| SC | REP | Graham, Lindsey O. | $ 1,766,253 | $ 1,131,353 | $ 634,900 |
| ME | DEM | Gideon, Sara | $ 1,311,992 | $ 736,892 | $ 575,100 |
| KY | REP | McConnell, Mitch | $ 1,148,132 | $ 704,432 | $ 443,700 |
| IA | DEM | Greenfield, Theresa | $ 954,512 | $ 200,412 | $ 754,100 |
| GA | DEM | Ossoff, T. Jonathan | $ 922,617 | $ 373,217 | $ 549,400 |
| MT | DEM | Bullock, Steve | $ 856,523 | $ 496,423 | $ 360,100 |
| MT | REP | Daines, Steve | $ 838,784 | $ 500,584 | $ 338,200 |
| MI | DEM | Peters, Gary | $ 684,388 | $ 308,388 | $ 376,000 |
| CO | DEM | Hickenlooper, John W. | $ 674,544 | $ 471,444 | $ 203,100 |
| TX | REP | Cornyn, John Sen | $ 594,187 | $ 297,487 | $ 296,700 |
| NC | DEM | Cunningham, Cal | $ 522,380 | $ 264,980 | $ 257,400 |
| AZ | REP | McSally, Martha | $ 411,676 | $ 211,176 | $ 200,500 |
| GA | DEM | Warnock, Raphael | $ 337,402 | $ 251,402 | $ 86,000 |
| IA | REP | Ernst, Joni K | $ 281,002 | $ 69,402 | $ 211,600 |
| ME | REP | Collins, Susan M. | $ 225,632 | $ 92,232 | $ 133,400 |
| KS | DEM | Bollier, Barbara | $ 213,599 | $ 55,599 | $ 158,000 |
| AL | DEM | Jones, Doug | $ 182,748 | $ 73,048 | $ 109,700 |
| AK | IND | Gross, Al Dr. | $ 164,064 | $ 77,864 | $ 86,200 |
| NC | REP | Tillis, Thom R. Sen. | $ 160,858 | $ 12,158 | $ 148,700 |
| CO | REP | Gardner, Cory | $ 144,016 | $ 37,616 | $ 106,400 |
| NH | DEM | Shaheen, Jeanne | $ 115,846 | $ 26,946 | $ 88,900 |
| TX | DEM | Hegar, Mary Jennings (MJ) | $ 111,486 | $ 46,386 | $ 65,100 |
| Digital spending figures come from the Facebook ad library reports and the Google Transparency Report. Spending covers September 5 to September 26, 2020 (for Facebook); September 6 to September 26, 2020 (for Google). See About the Data section at the end of this report for more information on our methodology along with the specific page names and disclaimers (Facebook) and advertiser IDs (Google) that are counted. Click here to download a spreadsheet showing all candidates and also showing spending from Jan 2020 through September 26, 2020. |
|||||
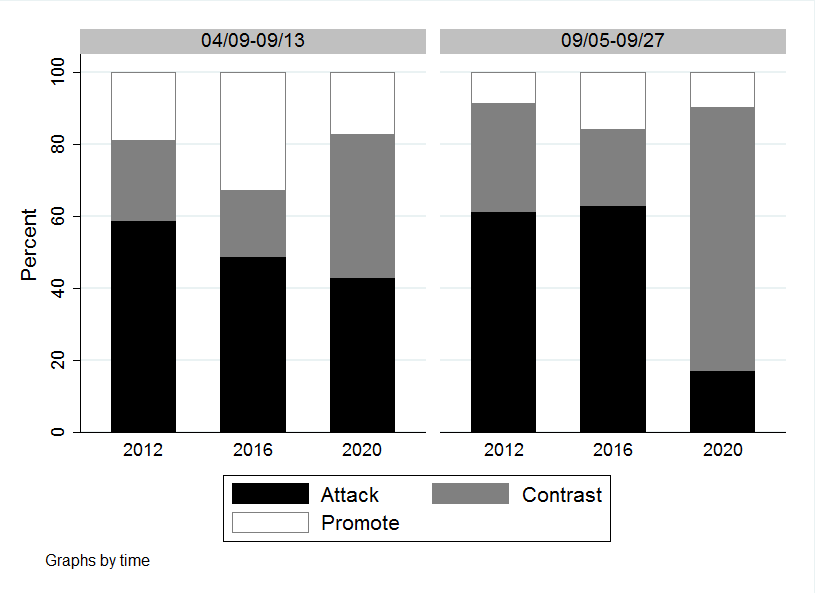
Ad Tone in Senate Races Largely Similar to Past;
ME, AZ and IA Among Most Negative Contests
Figure 5 looks at the tone of Senate advertising in 2020 in comparison to the two previous presidential cycles. As measured through attack and contrast ads, 2020 is more negative during the comparable last few weeks in 2012 and 2016. On the other hand, pure attack spots are slightly down as a share of all ads in September and in the full cycle-to-date in 2020 compared to 2012 and 2016.
Figure 5: Tone of Advertising in U.S. Senate Races (2012, 2016 and 2020)
Numbers include ads aired on broadcast television and national cable between January 1 of the off year and September 27 of the election year in each cycle (left panel) and between September 5-27 of the election year in each year (right panel). Numbers include candidate, party, and group-sponsored ads.
CITE SOURCE OF DATA AS: Based on ongoing Wesleyan Media Project coding of Kantar/CMAG data, which is subject to change.
Figure 6 looks at the trend in negative messages (combining attack and contrast ads) in Senate races since the summer. As is often the case, negative spots make up a larger share of ads as the campaign progresses, such that in the last week they accounted for over 70 percent of all Senate ads. For a few weeks in late August, pro-Democratic ads were more negative than pro-GOP ads. This has reversed since the beginning of September, with about 4 of every 5 pro-Republican ads containing an attack on a Democratic Senate candidate.
Figure 6: Percentage of Negative (Attack or Contrast) Ad Airings in U.S. Senate Races by Week
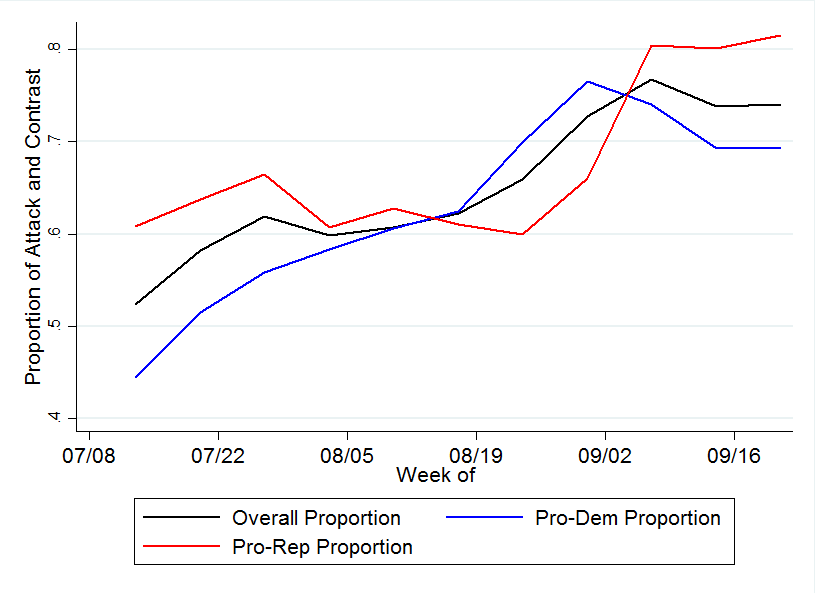
Numbers include weekly proportion of ads aired on broadcast television and national cable between the week of July 13 and September 27, 2020. Numbers include candidate, party, and group-sponsored ads.
CITE SOURCE OF DATA AS: Based on ongoing Wesleyan Media Project coding of Kantar/CMAG data, which is subject to change.
Table 7 displays Senate races sorted by the proportion of pure attack ads in each contest. Maine’s hotly-contested race between incumbent Republican Susan Collins and Democratic challenger Sara Gideon ranks first with over two-thirds of the advertising on television being pure attack. Gideon has been more likely to go negative in her advertising, with over half of her ads solely attacking compared to over a third of Collins’ ads. Iowa’s contest between Joni Ernst and Theresa Greenfield ranks a close second at 61.5 percent negative overall despite the fact that Greenfield has not aired any pure attack ads and Ernst’s percentage of pure attacks is only 42 percent. The bulk of the negativity comes from outside groups and the party committees in that race. The Arizona, Alaska and North Carolina contests round out the top five in negativity with overall half of their ads being negative.
Table 7: Most Negative U.S. Senate Races (Pure Attack Only)
| State | Airings | Neg % | (Dem Cand only) | (Rep Cand only) |
|---|---|---|---|---|
| ME | 17,851 | 63.10% | 49.70% | 35.60% |
| IA | 39,058 | 61.50% | 0.00% | 42.10% |
| AZ | 23,897 | 57.50% | 8.90% | 48.30% |
| AK* | 10,593 | 53.30% | 20.90% | 49.10% |
| NC | 30,388 | 52.30% | 0.00% | 100.00% |
| MT | 44,267 | 48.40% | 0.00% | 4.50% |
| KY | 21,104 | 47.40% | 22.70% | 53.70% |
| KS | 12,160 | 45.60% | 36.90% | 71.70% |
| GA | 36,669 | 44.40% | 14.80% | 11.40% |
| SC | 27,119 | 39.80% | 25.90% | 64.20% |
| AL | 10,819 | 39.20% | 47.90% | 0.00% |
| CO | 16,693 | 33.20% | 10.60% | 0.00% |
| NM | 4,530 | 29.70% | 27.50% | 0.00% |
| MI | 20,766 | 27.20% | 6.70% | 14.40% |
| MN | 4,479 | 8.60% | 7.40% | 0.00% |
| OK | 2,809 | 5.40% | 0% | 8.70% |
| MS | 2,829 | 0% | 0% | 0.00% |
| TX | 5,672 | 0.00% | 0.00% | 0.00% |
| VA | 5,616 | 0.00% | 0.00% | 0.00% |
| LA | 3,499 | 0.00% | 0.00% | |
| NH | 1,551 | 0.00% | 0.00% | 0.00% |
| DE | 570 | 0.00% | 0.00% | |
| SD | 191 | 0.00% | 0.00% | |
| ID | 126 | 0.00% | 0.00% | |
| IL | 4 | 0.00% | ||
| Numbers include ads aired on broadcast television between September 5 and 27, 2020. Totals refer only to candidate-sponsored ads. *Numbers in the Democratic candidate column for the Alaska Senate race show airings by Al Gross, the independent candidate in that race. CITE SOURCE OF DATA AS: Based on ongoing Wesleyan Media Project coding of Kantar/CMAG data, which is subject to change. |
||||
Both Parties Talk Health Care but Diverge on Other Issues in Senate
As shown in Table 8, pro-Democratic ads in Senate races over the last few weeks have centered on business, health care and campaign finance reform while pro-Republican ads have focused on taxes, health care and jobs.
Table 8: Issue Focus of U.S. Senate Contests by Party
| Pro-Dem Issues | % of Airings | Pro-Rep Issues | % of Airings |
|---|---|---|---|
| Business | 32.8% | Taxes | 30.5% |
| Health care | 27.0% | Health care | 24.1% |
| Campaign finance reform | 25.9% | Jobs | 21.3% |
| COVID-19 | 21.4% | Business | 19.9% |
| Prescription drugs | 18.4% | COVID-19 | 17.0% |
| Jobs | 16.0% | Veterans | 13.9% |
| Veterans | 15.2% | Government ethics/scandal | 13.6% |
| Emergency prep/response | 14.6% | Socialism | 12.0% |
| Military | 12.9% | Protests/riots | 11.5% |
| Taxes | 12.3% | China | 10.6% |
| Numbers include ads aired on broadcast television between September 5 and 27, 2020. Totals refer only to candidate-sponsored ads. CITE SOURCE OF DATA AS: Based on ongoing Wesleyan Media Project coding of Kantar/CMAG data, which is subject to change. |
|||
Dem Advantages in House Races
Democrats also hold an ad advantage in most of the top U.S. House races as well, as Table 9 shows. The race in New Mexico’s second congressional district has seen the most ads of any House race since September 5, over 13,000. In that race, pro-Democratic ads outnumber pro-Republican ads two to one. Democrats retain similar large ad advantages in many of the top races, with Republicans leading in only two of the top 25. Outside groups are also heavily involved in many of these top races, accounting for 1 in 4 ads in NM-2 and over 40 percent of the airings in SC-1.
Table 9: U.S. House TV Ad Airings and Spending (Since September 5)
| Race | Airings | Spend | Pro-Dem | Pro-GOP | Dem Adv | % Group |
|---|---|---|---|---|---|---|
| NM02 | 13,279 | $4,104,240 | 8,866 | 4,413 | 4,453 | 24.3% |
| CA21 | 12,287 | $3,506,020 | 7,646 | 4,641 | 3,005 | 13.9% |
| NY22 | 11,649 | $4,071,080 | 7,623 | 4,026 | 3,597 | 15.7% |
| UT04 | 8,805 | $2,859,210 | 5,587 | 3,218 | 2,369 | 31.6% |
| SC01 | 8,392 | $3,329,740 | 4,778 | 3,614 | 1,164 | 41.6% |
| MT01 | 7,823 | $1,365,750 | 3,755 | 4,068 | -313 | 5.8% |
| VA05 | 6,104 | $765,090 | 5,340 | 764 | 4,576 | 33.6% |
| IA02 | 5,911 | $4,125,540 | 3,316 | 2,595 | 721 | 26.0% |
| TX21 | 5,568 | $3,101,170 | 3,636 | 1,932 | 1,704 | 34.2% |
| NY24 | 5,442 | $1,783,940 | 3,124 | 2,318 | 806 | 20.0% |
| VA07 | 4,859 | $2,439,840 | 3,085 | 1,774 | 1,311 | 44.0% |
| OH01 | 4,474 | $2,250,600 | 2,926 | 1,548 | 1,378 | 30.2% |
| VA02 | 4,405 | $1,979,180 | 2,796 | 1,609 | 1,187 | 41.7% |
| IN05 | 4,251 | $1,179,100 | 2,666 | 1,585 | 1,081 | 15.7% |
| IA01 | 4,233 | $2,944,500 | 2,311 | 1,922 | 389 | 26.3% |
| OK05 | 3,875 | $2,088,710 | 2,594 | 1,281 | 1,313 | 39.6% |
| IL13 | 3,838 | $1,652,650 | 2,443 | 1,395 | 1,048 | 12.7% |
| IA03 | 3,817 | $1,856,360 | 2,676 | 1,141 | 1,535 | 8.8% |
| NE02 | 3,802 | $2,134,310 | 1,777 | 2,025 | -248 | 14.0% |
| NY01 | 3,423 | $1,929,220 | 3,423 | 0 | 3,423 | 0.0% |
| ME02 | 3,418 | $888,460 | 2,827 | 591 | 2,236 | 8.9% |
| AK01* | 3,391 | $312,020 | 2,323 | 1,068 | 1,255 | 0.0% |
| MO02 | 3,382 | $1,715,030 | 2,427 | 955 | 1,472 | 3.1% |
| TX23 | 3,324 | $1,527,940 | 2,907 | 417 | 2,490 | 38.1% |
| CO03 | 3,244 | $522,990 | 1,914 | 1,330 | 584 | 6.4% |
| Numbers include ads aired on broadcast television between September 5 and 27, 2020. Numbers include candidate, party, and group-sponsored ads. *Numbers in the Democratic columns for the Alaska House race show airings and spending by Alyse Galvin, the independent candidate in that race. Click here to download a full list of TV ad airings by U.S. House race. Also, please see this post from WMP about tracking TV ads in smaller media markets for more information on why some ads may not be captured. CITE SOURCE OF DATA AS: Kantar/CMAG with analysis by the Wesleyan Media Project. |
||||||
Ocasio-Cortez Top Digital Ad Spender in House
Looking at digital ad spending in races for the U.S. House in Table 10, the top spender since September 5 has been Rep. Alexandra Ocasio-Cortez, who has spent over $360,000 on ads on Facebook and Google. Since the beginning of 2020, the New York Representative has spent almost $4 million on ads on the two platforms. In contrast to the Senate, the candidates who have spent the most online are not necessarily those running the most competitive races but those running in large urban areas where television advertising is extremely expensive and inefficient. Since the beginning of 2020, $44,595,552 has been spent by House candidates on Facebook and Google ads.
Table 10: Top U.S. House Digital Ad Spenders on Facebook and Google
| State | District | Party | FB+Google Spend (since Sept. 5) | FB+Google Spend (since Jan 1) |
|
|---|---|---|---|---|---|
| NY | 14 | DEM | Ocasio-Cortez, Alexandria | 365,173 | 3,930,401 |
| CA | 43 | REP | Collins, Joe | 348,110 | 860,469 |
| MD | 7 | REP | Klacik, Kimberly | 255,720 | 838,950 |
| CA | 45 | DEM | Porter, Katherine | 244,882 | 266,605 |
| NY | 14 | REP | Cummings, John C. | 223,202 | 494,958 |
| MN | 5 | REP | Johnson, Lacy | 201,369 | 1,179,650 |
| NC | 8 | DEM | Timmons-Goodson, Patricia | 183,253 | 573,608 |
| TX | 21 | DEM | Davis, Wendy | 177,624 | 389,080 |
| CA | 28 | DEM | Schiff, Adam | 139,722 | 1,150,574 |
| FL | 13 | REP | Paulina Luna, Anna | 139,577 | 303,550 |
| CA | 23 | REP | McCarthy, Kevin | 137,488 | 1,062,439 |
| VA | 2 | DEM | Luria, Elaine | 118,079 | 233,793 |
| SC | 2 | DEM | Boroughs, Adair Ford | 114,049 | 306,146 |
| CA | 22 | REP | Nunes, Devin G. | 108,022 | 642,623 |
| NV | 3 | REP | Rodimer, Dan | 105,186 | 302,902 |
| NY | 11 | DEM | Rose, Max | 98,818 | 309,796 |
| MI | 11 | DEM | Stevens, Haley | 96,395 | 120,437 |
| CA | 39 | REP | Kim, Young | 95,645 | 564,846 |
| CA | 50 | DEM | Campa-Najjar, Ammar | 86,971 | 305,778 |
| SC | 1 | DEM | Cunningham, Joe | 85,732 | 270,151 |
| OR | 4 | REP | Skarlatos, Alek | 84,835 | 200,893 |
| MI | 8 | DEM | Slotkin, Elissa | 84,464 | 113,076 |
| NY | 2 | DEM | Gordon, Jacqueline | 82,793 | 119,986 |
| OH | 15 | REP | Hunt, Shelby Xavier | 76,784 | 133,531 |
| NY | 21 | REP | Stefanik, Elise M. | 76,299 | 492,788 |
| Digital spending figures come from the Facebook ad library reports and the Google Transparency Report. Spending covers January 1, 2020 or September 5, 2020 to September 26, 2020 (for Facebook); January 5, 2020 or September 6 to September 26, 2020 (for Google). Candidate spending numbers include spending by official campaign committees, leadership PACs, and joint fundraising committees. See About the Data section at the end of this report for more information on our methodology along with the specific page names and disclaimers (Facebook) and advertiser IDs (Google) that are counted. Click here to download a spreadsheet showing all candidates and also showing Facebook and Google totals separately. |
|||||
Television Volumes Continue to Outpace Past Presidential Cycles
The volume of advertising on television in the 2020 election cycle continues to outpace 2012 and 2016, as seen in Figure 7. The increase over ad volumes in 2016 is particularly noticeable. Cycle-to-date, presidential ad volume is up 145 percent over the 2016 totals and 87 percent over 2012 totals. In the period between September 5 and 27, ad volume in the presidential contest is up by 170 percent over the same period 2016 and up 43 percent over the same period in 2012.
We show also in Figures 8 and 9 the weekly totals in House and Senate races in 2012, 2016, and 2020. In both contexts, ad volumes in 2020 greatly outpace the previous two cycles. In the last week, in fact, over twice as many House and Senate ads aired as in the same week in 2012 and 2016. Cycle-to-date, U.S. Senate advertising is up 193 percent, and U.S. House advertising volume is up 152 percent over 2016.
Figure 7: Number of Presidential Ad Airings by Week (2012, 2016 and 2020)
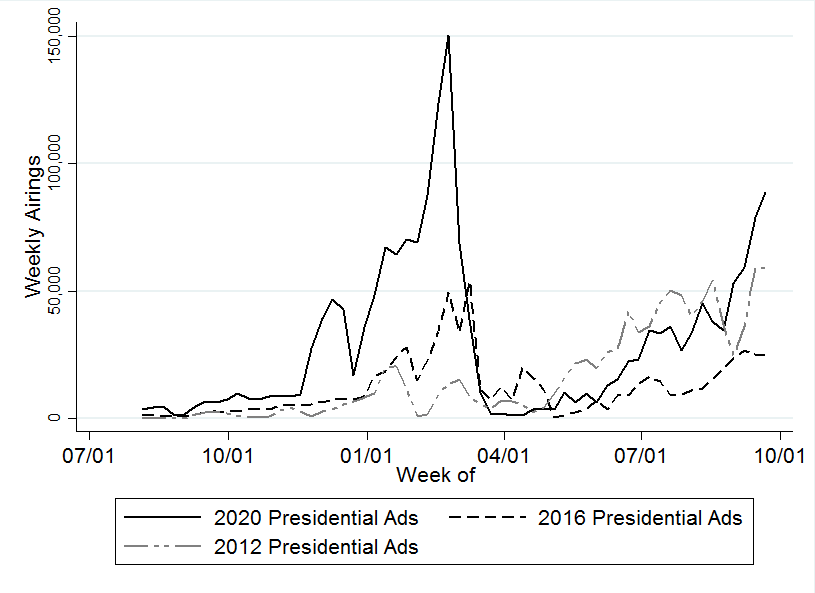
Numbers include ads aired on broadcast television and national cable between July 1, 2019 and September 27, 2020.
CITE SOURCE OF DATA AS: Kantar/CMAG with analysis by the Wesleyan Media Project.
Figure 8: Number of U.S. Senate Ad Airings by Week (2012, 2016 and 2020)
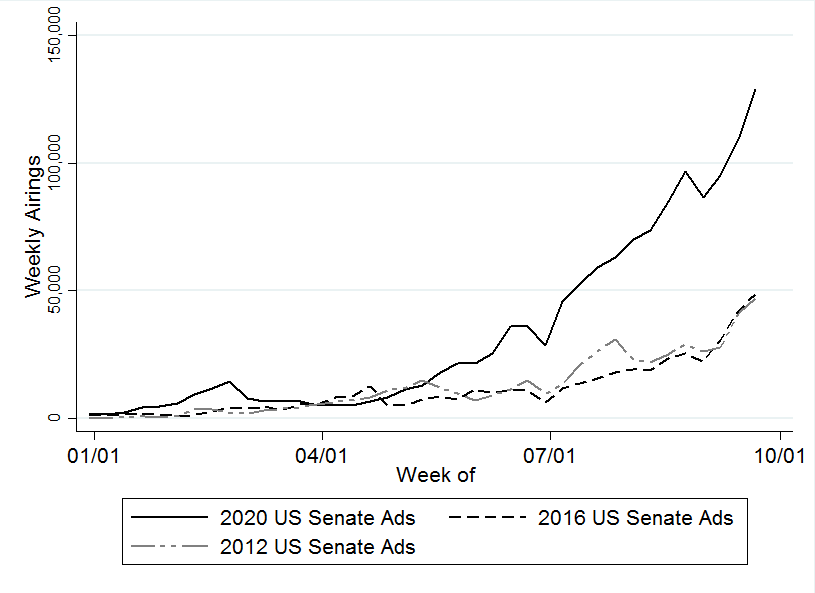
Numbers include ads aired on broadcast television between January 1 and September 27, 2020.
CITE SOURCE OF DATA AS: Kantar/CMAG with analysis by the Wesleyan Media Project.
Figure 9: Number of U.S. House Ad Airings by Week (2012, 2016 and 2020)
Numbers include ads aired on broadcast television between January 1 and September 27, 2020.
CITE SOURCE OF DATA AS: Kantar/CMAG with analysis by the Wesleyan Media Project.
GOP Senate Leadership Fund Tops Group Spenders
Table 11 shows the top group spenders since early September. Senate Leadership Fund, a Republican-supporting group, tops the list with almost $29 million in spending on television, Facebook and Google ads. The Democratic-supporting Senate Majority PAC is second, with $25.7 million in spending, followed closely by Preserve America PAC, which has aired $25.5 million in ads supportive of President Trump in the presidential race.
Table 11: Top Outside Group Spenders Since Early September
| Party Lean | Television Spend ($) | FB spend ($) | Google spend ($) | Total ($) | Races (with TV ads) |
|
|---|---|---|---|---|---|---|
| Senate Leadership Fund | R | 27,620,550 | 414,588 | 955,600 | 28,990,738 | Sen: AK, AZ, CO, GA, IA, KS, ME, MT, NC |
| Senate Majority PAC | D | 23,726,360 | 949,256 | 984,100 | 25,659,716 | Sen: AZ, CO, GA, IA, ME, MI, MT, NC |
| Preserve America PAC | R | 22,967,080 | 924,075 | 1,599,600 | 25,490,755 | Pres |
| America First Action | R | 12,635,710 | 885,759 | 935,200 | 14,456,669 | Pres |
| Priorities USA Action | D | 10,063,540 | 1,750,250 | 773,800 | 12,587,590 | Pres |
| House Majority PAC | D | 8,147,320 | 444,467 | 251,000 | 8,842,787 | CA21, IA01, IA02, IA03, IL13, MN07, NJ02, NY24, OH01, OK05, PA08, SC01, TX21, TX22, TX23, TX24, UT04, VA02, VA07 |
| American Crossroads | R | 7,316,280 | 0 | 0 | 7,316,280 | Sen: ME, NC |
| Congressional Leadership Fund | R | 5,969,350 | 468,550 | 424,300 | 6,862,200 | CA21, FL26, IA01, IA02, IA03, MI11, NM02, NY22, OK05, SC01, TX07, TX22, TX24, UT04, VA02, VA05, VA07, WI03 |
| AB PAC | D | 4,409,450 | 182,558 | 0 | 4,592,008 | Pres |
| VoteVets | D | 4,363,120 | 262,483 | 6,300 | 4,631,903 | Pres; Sen: AK, NC; TX23 |
| Women Vote | D | 3,828,740 | 14,390 | 10,600 | 3,853,730 | Sen: KS, ME; IA02, IN05, NY24, OH01 |
| Club for Growth Action | R | 3,079,350 | 266,976 | 46,800 | 3,393,126 | AZ06, GA07, IN05, MT01, OH01, SC01, TX21, VA07 |
| Everytown for Gun Safety Victory Fund | D | 2,938,790 | 40,382 | 0 | 2,979,172 | Pres; GA06 |
| Plains PAC | D | 2,745,710 | 0 | 0 | 2,745,710 | Sen: IA |
| Keep Kentucky Great | R | 2,698,770 | 47,646 | 141,900 | 2,888,316 | Sen: KY |
| Defend AZ | R | 2,427,280 | 0 | 0 | 2,427,280 | Sen: AZ |
| Restoration PAC | R | 2,033,430 | 78,425 | 90,100 | 2,201,955 | Pres; Sen: MI |
| Better Future MI Fund | R | 1,933,180 | 24,112 | 0 | 1,957,292 | Sen: MI |
| Georgia United Victory | R | 1,729,040 | 140,417 | 69,900 | 1,939,357 | Sen: GA |
| End Citizens United | D | 1,544,280 | 358,260 | 33,600 | 1,936,140 | Sen: NC; ME02, NY11, OK05, SC01, VA07 |
| Patients For Affordable Drugs Action | x | 1,536,820 | 14,866 | 0 | 1,551,686 | Sen: NC |
| LCV Victory Fund | D | 1,385,720 | 52,842 | 5,300 | 1,443,862 | Sen: IA; NM02, NY22, SC01 |
| 1820 PAC | R | 1,272,300 | 0 | 0 | 1,272,300 | Sen: ME |
| LCV Victory Fund & House Majority Pac | D | 872,470 | 0 | 0 | 872,470 | MI08, SC01 |
| Committee to Defend the President | R | 846,470 | 0 | 0 | 846,470 | Pres |
| Ditch Fund | D | 815,750 | 39,758 | 239,800 | 1,095,308 | Sen: KY |
| 314 Action Fund | D | 777,550 | 209,069 | 31,900 | 1,018,519 | Sen: AK; SC01, VA05 |
| Republican Voters Against Trump | R | 707,590 | 935,791 | 0 | 1,643,381 | Pres |
| The Lincoln Project | D | 704,680 | 1,079,230 | 459,400 | 2,243,310 | Pres; Sen: AK, MT, SC |
| NEA Advocacy Fund | D | 493,000 | 0 | 29,700 | 522,700 | Sen: MI; NM02 |
| Table shows television, Facebook and Google spending for the top group spenders on television. For TV, numbers include ads aired on broadcast television and national cable between September 5 and September 27, 2020. Facebook ads are between September 5 and September 26, 2020. Google ads are between September 6 and September 26, 2020. See About the Data section at the end of this report for more information on our methodology along with the specific page names and disclaimers (Facebook) and advertiser IDs (Google) that are counted. CITE SOURCE OF DATA AS: Kantar/CMAG, Facebook Ad Library and Google Transparency Report with analysis by the Wesleyan Media Project. |
||||||
In partnership with the Center for Responsive Politics, the Wesleyan Media Project also tracks outside group ad spending by the type of donor disclosure. We classify groups as full-disclosure groups (meaning they disclose contributor lists to the Federal Election Commission), non-disclosing dark money groups (which are not required to disclose publicly their donors; these are most often 501c4 non-profits), and partial-disclosure groups (those that disclose donors but also accept contributions from dark money sources).
While groups have spent multi-millions in the presidential and congressional races this cycle, the types of groups doing the spending have shifted over time. September 5 was the start of the 60-day “window” before the general election, when all pro-candidate spending by dark money groups must be reported to the Federal Election Commission. Since the start of that period, there has been a shift away from ad airings sponsored by dark money groups toward partial and full-disclosure groups (Table 12). This is especially evident in Senate advertising. In August, over half of ad airings were from dark money groups, but that has declined to less than 2 percent during September. All told, dark money groups constitute over 40 percent of the group-sponsored ads in House and Senate races in the full cycle-to-date.
Table 12: Group-sponsored TV Ad Airings by Disclosure Type
| 1/1/19 to 8/9/20 | 8/10 to 9/4 | 9/5 to 9/27 | total | |
|---|---|---|---|---|
| President | ||||
| Total group ads | 131,083 | 44,774 | 41,221 | 217,078 |
| % Dark money | 11.6% | 20.5% | 2.09% | 11.6% |
| % Partial disclosed | 40.2% | 19.0% | 37.26% | 35.2% |
| Senate | ||||
| Total group ads | 264,652 | 140,535 | 97,053 | 502,240 |
| % Dark money | 55.6% | 52.8% | 1.8% | 44.4% |
| % Partial disclosed | 19.1% | 22.6% | 38.2% | 23.8% |
| House | ||||
| Total group ads | 73,114 | 18,563 | 37,641 | 129,318 |
| % Dark money | 51.2% | 27.3% | 29.0% | 41.3% |
| % Partial closed | 6.4% | 16.0% | 36.8% | 16.6% |
| Numbers include ads aired on broadcast television between January 1, 2019 and September 27, 2020. CITE SOURCE OF DATA AS: Kantar/CMAG with analysis by the Wesleyan Media Project. Group classifications from the Center for Responsive Politics. |
||||
Additional page names (including other outside groups and parties in addition to candidates) mentioning senatorial and presidential candidates on Facebook can be investigated through the help of the Wesleyan Media Project’s student-driven Delta Lab via our interactive tables, Table 13 and 14. Table 13 shows all entities who have spent approximately $25,000 or more on Facebook advertising that mentions 2020 presidential or senatorial candidates (removing candidate self-references).
Table 13: Facebook Pages Mentioning Candidates for President and Senate in 2020
Click here to view the table in a new tab (with larger text)
Table includes Facebook page names spending approximately $25,000 or more on advertising that mentions 2020 presidential or senatorial candidates (excluding candidate self-references) between April 9 and September 26, 2020 or September 5-26, 2020. This interactive table is part of an ongoing, work-in-progress project from WMP’s student-driven Delta Lab. Data table by Delta Lab’s Kevin McMorrow ’20, Sam Feuer ’23 and Jielu Yao. False positive mentions are unavoidable at this stage as candidates are identified through search term queries while we develop methods to improve their accuracy.
Table 14 presents the same set of pages as Table 13 but aggregates the proportion of spending on ads mentioning candidates by the major party affiliation of the candidate mention. The columns “Democrats” and “Republicans” contain the proportion of ads mentioning candidates from the respective parties out of the total number of ads mentioning a candidate at all.
Table 14: Facebook Pages Mentioning Candidates for President and Senate in 2020 by Party
Click here to view the table in a new tab (with larger text)
Table includes Facebook page names spending approximately $25,000 or more on advertising that mentions 2020 presidential or senatorial candidates (excluding candidate self-references) between April 9 and September 26, 2020 or September 5-26, 2020. This interactive table is part of an ongoing, work-in-progress project from WMP’s student-driven Delta Lab. Data table by Delta Lab’s Kevin McMorrow ’20, Sam Feuer ’23 and Jielu Yao. False positive mentions are unavoidable at this stage as candidates are identified through search term queries while we develop methods to improve their accuracy.
About the Data
For the television ad totals, data reported here are from Kantar/CMAG and do not cover local cable buys, only broadcast television, national network and national cable advertising.
For Facebook ads, data come from the aggregate reports, but our figures are more comprehensive than what Facebook reports on their campaign page because we include spending on ads that are funded by the campaigns even when they run on different pages in our totals (e.g., Trump funded ads on Mike Pence or Brad Parscale’s pages are included in the Trump totals). We looked for pages attached to each candidate, including possible leadership PACs, joint-fund-raising committees, and, in the case of presidential candidates, affiliated Senate/House pages. Aggregate report entries are provided for each page name and disclaimer combination. Totals for most of this report reflect spending between January 1, 2020 or September 5, 2020 and September 26, 2020. These totals are calculated by subtracting the reported cumulative spending (as reported by Facebook as the total spent since May 2018) for the September 26, 2020 report and subtracting off the cumulative spending reported for December 31, 2019 or September 4, 2020.
Calculating cycle-to-date Facebook totals is more challenging than looking at totals from the last couple of months. In early January 2019, Facebook did not include page IDs (a unique identifier) for each entry in the aggregate report. Because pages can have the same name, a unique identifier for each page would be required to definitively identify an aggregate report entry, which Facebook does not provide going backward. Therefore, we did our best to associate each entry in the January 5, 2019, report with a page ID, which we had access to through the library API. There may be some slippage if two pages associated with candidates had identical names and disclaimers, but we believe these instances are rare for the set of ads covered in this report. For cycle-to-date spending, we subtracted the January 5, 2019 total from the September 26, 2020 total to get the spending by page and disclaimer for January 6, 2019 through September 26, 2020. As noted above, we also report spending from January 1, 2020 through September 26, 2020 and September 5, 2020 through September 26, 2020. We rely on a Delta Lab monitoring tool to identify and avoid using days on which Facebook has a problem with the aggregated spending report.
In Table A (click here to download), we list the page names/disclaimer rows from the Facebook aggregate reports that we identified for this report. It is possible that we missed some spending from a Facebook page affiliated with a candidate running for office. This is exacerbated by the absence of EIN or FEC identifiers in the Facebook reports.
For Google ads, we downloaded the weekly reports from the platform’s Transparency Report. As a matter of practice with all of the platform data, we try to replicate our prior spending figures when we are calculating numbers for a new release. In that process, we discovered discrepancies between the data we downloaded in November and the information available in the December download for the same dates, which persists in September. Based on conversations with Google, we believe the discrepancies are partially but not exclusively due to the addition of advertisers targeting state-level races. We are working on a process to report these discrepancies, but the totals reflected in this release are current as of 9/8/20, the day on which we pulled the transparency report. Google only includes spending in federal and state races and only includes weekly totals but lists the sponsor’s EIN or FEC committee ID. We searched the list of advertisers for presidential candidates and affiliated leadership PACs and joint-fund-raising committees, and candidates for U.S Senate and affiliated single-candidate super PACs. We made the same assumption as with the Facebook data about any spending from House and Senate campaign committees by declared presidential candidates. Google spending is from the following time periods: January 5, 2020 through September 26, 2020; and September 6, 2020 through September 26, 2020.
In Table B (click here to download), we list the advertiser name for all entities used in this report to calculate Google spending totals.
About This Report
The Wesleyan Media Project (WMP) provides real-time tracking and analysis of political advertising in an effort to increase transparency in elections. Housed in Wesleyan’s Quantitative Analysis Center (QAC) – part of the Allbritton Center for the Study of Public Life – the Wesleyan Media Project is the successor to the Wisconsin Advertising Project, which disbanded in 2009. It is directed by Erika Franklin Fowler, associate professor of government at Wesleyan University, Michael M. Franz, professor of government at Bowdoin College and Travis N. Ridout, professor of political science at Washington State University. WMP personnel include Laura Baum (Project Manager), Colleen Bogucki (Project Coordinator), Pavel Oleinikov (Associate Director, QAC), Markus Neumann (Post-Doctoral Fellow), and Jielu Yao (Post-Doctoral Fellow).
The Wesleyan Media Project’s digital advertising tracking is supported by the contributions of students in Delta Lab, an interdisciplinary research collaborative focusing on computationally-driven and innovative analyses and visualizations of media messaging. We especially thank Spencer Dean ’21, Kevin McMorrow ‘20, Sam Feuer ’23 and Roshaan Siddiqui ‘22 for their contributions to this report.
The Wesleyan Media Project is supported by Wesleyan University, the John S. and James L. Knight Foundation, and the Democracy Fund. WMP is partnering again this year with the Center for Responsive Politics, to provide added information on outside group disclosure.
Periodic releases of data will be posted on the project’s website and dispersed via Twitter @wesmediaproject. To be added to our email update list, click here.
For more information contact: Lauren Rubenstein, lrubenstein@wesleyan.edu, (203) 644-7144
About Wesleyan University Wesleyan University, in Middletown, Conn., is known for the excellence of its academic and co-curricular programs. With more than 2,900 undergraduates and 200 graduate students, Wesleyan is dedicated to providing a liberal arts education characterized by boldness, rigor and practical idealism. For more, visit wesleyan.edu.
About the John S. and James L. Knight Foundation Knight Foundation is a national foundation with strong local roots. We invest in journalism, in the arts, and in the success of cities where brothers John S. and James L. Knight once published newspapers. Our goal is to foster informed and engaged communities, which we believe are essential for a healthy democracy.
About Democracy Fund Created by eBay founder and philanthropist Pierre Omidyar, Democracy Fund is a foundation helping to ensure that our political system can withstand new challenges and deliver on its promise to the American people. Democracy Fund has invested more than $125 million in support of a healthy, resilient, and diverse democracy with a particular focus on modern elections, effective governance, and a vibrant public square.