Photo: Becker1999/Flickr
Record Breaking Volume of US House and US Senate Airings
(MIDDLETOWN, CT) September 9, 2020 – A new analysis from the Wesleyan Media Project, in partnership with the Center for Responsive Politics, shows that pro-Biden television ads have dominated the presidential race in the past month. Since August 10, Joe Biden and his group supporters have aired 106,000 television ads at a cost of $58.9 million compared to 57,000 ads at a cost of $35.8 million for Trump and his group supporters (Table 1). Biden’s campaign has put up 92,000 ad airings (at a cost of almost $46 million), while Trump’s campaign has aired 26,000 ad airings at a cost of about $14 million. America First Action, a pro-Trump super PAC, has spent $6.7 million on ads in the past month.
Table 1: Top Spenders in Presidential Race on TV (since August 10)
| Sponsor | Airings | Spend ($) | Party Lean |
|---|---|---|---|
| Biden, Joe | 92,360 | 45,815,160 | D |
| Trump, Donald | 26,159 | 13,776,640 | R |
| America First Action | 10,887 | 6,746,710 | R |
| Club for Growth Action | 6556 | 4,648,360 | R |
| The Lincoln Project | 2103 | 3,685,500 | D |
| AB PAC | 5710 | 3,348,860 | D |
| NRA Victory Fund, Inc. | 6039 | 3,194,100 | R |
| Preserve America PAC | 4855 | 3,092,420 | R |
| Restoration PAC | 2090 | 2,883,130 | R |
| Americans For Limited Government | 2944 | 2,629,090 | D |
| Priorities USA Action | 2612 | 2,248,800 | D |
| Committee to Defend the President | 218 | 1,342,210 | R |
| Future Majority, Inc | 164 | 422,220 | D |
| EDF Action Votes | 170 | 264,270 | D |
| Unite the Country | 191 | 118,140 | D |
| Independent Women's Voice & Patients for Real Prices | 9 | 112,920 | R |
| MeidasTouch | 113 | 108,920 | D |
| Nuestro PAC | 78 | 99,710 | D |
| Republican Voters Against Trump | 9 | 48,350 | D |
| America's Progressive Promise PAC | 2 | 30,710 | D |
| AFT Solidarity | 5 | 20,830 | D |
| Pharmaceutical Care Management Association | 5 | 19,330 | D |
| ELPC Action Fund | 25 | 4,300 | D |
| Numbers include ads aired on broadcast television and national cable between August 10 and September 4, 2020. CITE SOURCE OF DATA AS: Kantar/CMAG with analysis by the Wesleyan Media Project |
|||
All told, spending on broadcast television and national cable ads in the presidential race, including massive Bloomberg spending during the nomination campaign, is up to $993 million. Television ad spending in all federal races—including Senate, House and the presidential race—now totals $1.54 billion.
The ad advantage to Biden on television overall and in the last month is shown in Figure 1. (National ad buys are excluded from the map, but Biden has and even greater advantage there too, with more national cable spending than Trump and allies and 1,882 airings to 301 for Trump.) When looking at the full general election (defined here as April 9, which is the day after Bernie Sanders dropped out), pro-Biden and pro-Trump totals have been more balanced (247,053 pro-Trump airings to 207,737 pro-Biden spots), with both sides spending nearly the same ($126m for Biden and allies compared to $128.5m for the pro-Trump side). Changing the time filter to the last month shows clearly how the ad balance has tilted in Biden’s favor recently.
“Early in the general election period, Trump was massively out-airing Biden,” said Travis Ridout, co-director of the Wesleyan Media Project. “In our earlier analysis of May and June ad totals, the Trump campaign had put up over 50,000 spots to Biden’s 3,000. With the fall campaign ramping up, the imbalance has heavily tipped to Biden.”
Figure 1: Advertising Advantage in the Presidential Race on Television
Numbers include ads aired on broadcast television (excluding national cable airings) between April 9 and September 4, 2020, and between August 10 and September 4, 2020.
Figure by Delta Lab’s Spencer Dean ’21 and Kevin McMorrow ’20
Download the data in this map as a spreadsheet.
CITE SOURCE OF DATA AS: Kantar/CMAG with analysis by the Wesleyan Media Project.
Phoenix is Top Media Market in Presidential Race in Last Month
When it comes to both presidential ad airings and spending, the Phoenix media market sits on top (Table 2). The presidential campaigns and supportive groups have spent almost $8 million in Phoenix on almost 10,800 ad airings in the past month. Tucson, Arizona, ranks third in terms of total airings. Media markets in Florida (Tampa, Orlando and Miami), Wisconsin (Green Bay and Milwaukee) and Pennsylvania (Harrisburg and Pittsburgh) also make the top 10 in total ad airings for the past month. Pro-Biden forces have out-aired Trump and his allies in all top 25 markets since August 10.
Table 2: Airings and Spending by Media Market in Presidential Race (Since August 10)
| Media Market | Airings | Spend ($) | Dem group spend ($) | Rep group spend ($) | Dem cand spend ($) | Rep Cand spend ($) | Rep (Trump) advantage |
|---|---|---|---|---|---|---|---|
| Phoenix, AZ | 10,786 | 7,949,760 | 1,007,080 | 2,809,340 | 3,330,150 | 803,190 | -1334 |
| Tampa, FL | 6,807 | 4,254,880 | 748,890 | 125,130 | 2,588,060 | 792,800 | -3021 |
| Tucson, AZ | 6,573 | 2,838,920 | 73,130 | 1,066,710 | 1,293,470 | 405,610 | -1907 |
| Green Bay, WI | 6,538 | 2,496,730 | 592,970 | 1,072,250 | 695,050 | 136,460 | -682 |
| Harrisburg, PA | 6,383 | 4,542,090 | 1,038,530 | 1,843,600 | 1,656,660 | 3,300 | -1445 |
| Milwaukee, WI | 6,211 | 3,186,640 | 605,790 | 1,106,000 | 1,232,660 | 242,190 | -1003 |
| Orlando, FL | 5,676 | 4,848,170 | 531,240 | 109,810 | 3,186,180 | 1,020,940 | -2186 |
| Raleigh, NC | 5,581 | 3,191,180 | 0 | 1,543,900 | 1,276,440 | 370,840 | -527 |
| Miami, FL | 5,368 | 3,014,750 | 13,520 | 0 | 2,236,670 | 764,560 | -2502 |
| Pittsburgh, PA | 5,316 | 4,881,290 | 1,432,250 | 2,180,830 | 1,268,210 | 0 | -1520 |
| La Crosse, WI | 5,301 | 1,806,820 | 307,050 | 744,020 | 620,330 | 135,420 | -543 |
| Charlotte, NC | 4,922 | 2,647,580 | 225,580 | 95,620 | 1,508,680 | 817,700 | -1834 |
| Philadelphia, PA | 4,653 | 4,163,490 | 0 | 1,629,340 | 2,534,150 | 0 | -2325 |
| Johnstown, PA | 4,650 | 1,819,870 | 388,100 | 892,980 | 538,790 | 0 | -1010 |
| Wilkes Barre, PA | 4,583 | 2,221,470 | 442,020 | 1,226,010 | 553,440 | 0 | -599 |
| Greensboro, NC | 4,577 | 1,360,820 | 0 | 714,920 | 507,770 | 138,130 | -819 |
| Wausau, WI | 4,200 | 2,908,150 | 542,160 | 862,040 | 1,071,860 | 432,090 | -298 |
| Jacksonville, FL | 3,982 | 1,194,320 | 336,910 | 74,220 | 578,120 | 205,070 | -1584 |
| Erie, PA | 3,669 | 1,514,990 | 432,240 | 777,880 | 304,870 | 0 | -141 |
| Madison, WI | 3,485 | 1,568,060 | 126,040 | 339,530 | 915,870 | 186,620 | -1267 |
| Detroit, MI | 3,460 | 2,948,230 | 1,150,240 | 161,200 | 1,636,790 | 0 | -3346 |
| Ft. Myers, FL | 3,032 | 1,104,230 | 130,680 | 0 | 687,800 | 285,750 | -1464 |
| Grand Rapids, MI | 2,998 | 1,011,280 | 68,560 | 230,330 | 712,390 | 0 | -1738 |
| West Palm Beach, FL | 2,918 | 1,273,130 | 221,030 | 0 | 725,300 | 326,800 | -1146 |
| Greenville, NC | 2,666 | 616,240 | 0 | 175,370 | 308,640 | 132,230 | -502 |
| Numbers include ads aired on broadcast television and national cable between August 10 and September 4, 2020. CITE SOURCE OF DATA AS: Kantar/CMAG with analysis by the Wesleyan Media Project. |
|||||||
Trump Leads Biden in Digital Spending but Gap Narrows
Trump continues to have the upper hand in digital advertising, on both Facebook and Google, though the margin is shrinking (see Table 3). Since early August, Trump’s campaign has spent about $45 million on ads on Facebook and Google, compared to $34 million for Biden’s campaign.
“Although Trump has outspent Biden on digital ads in the past month, that gap has narrowed from earlier in the year, when Trump’s digital spending massively outpaced Biden’s,” said Erika Franklin Fowler, co-director of the Wesleyan Media Project. “Keep in mind also that much of this spending is not directed at persuasion; some of it is spending aimed at raising additional campaign funds.”
Table 3: Digital Ad Spending by Presidential Candidates and Single-Candidate SuperPACs
| FB $ (since mid-April) | FB $ (since early-Aug) | Google $ (since mid-April) | Google $ (since early-Aug) | FB+Google $ (since mid-April) | FB+Google $ (since early-Aug) |
|
|---|---|---|---|---|---|---|
| Biden | 38,454,744 | 18,224,014 | 30,754,100 | 16,195,000 | 69,208,844 | 34,419,014 |
| Trump | 63,175,837 | 22,701,734 | 48,063,900 | 22,262,900 | 111,239,737 | 44,964,634 |
| Unite the Country (pro-Biden) | 734,831 | 404,179 | 29,900 | 21,600 | 764,731 | 425,779 |
| Great America PAC (pro-Trump) | 44,150 | 7,240 | 0 | 0 | 44,150 | 7,240 |
| Digital spending figures come from the Facebook ad library reports and the Google Transparency Report. Spending covers April 9 or August 9 to September 4, 2020 (for Facebook); April 12 or August 9 to September 5, 2020 (for Google). Candidate spending numbers include spending by official campaign committees, leadership PACs, and joint fundraising committees. See “About the Data” section at the end of this report for more information on our methodology along with the specific page names and disclaimers that are counted. |
||||||
Looking at the regional impressions for Trump and Biden on Facebook between August 9 and September 5 (Figure 2) reveals that both California and Florida are key areas of spending by the Biden and Trump campaigns. Texas ranks third in impressions for Trump while Pennsylvania is third for Biden.
Figure 2: Regional Focus of Facebook Advertising by Top Sponsors Over Time
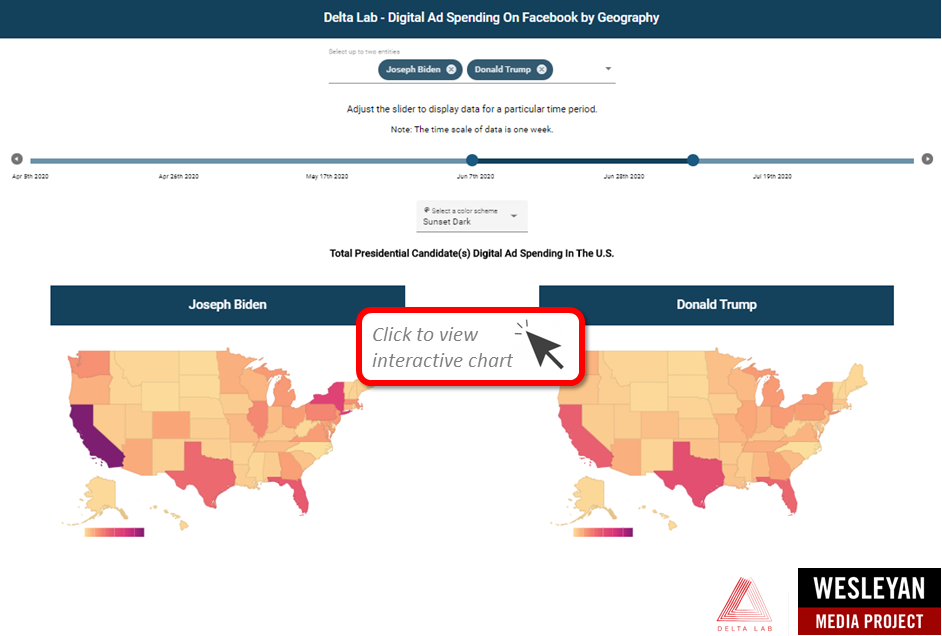
Digital spending comes from the Facebook ad library reports. Data visualization application by Delta Lab’s Roshaan Siddiqui ’22. Classifications from the Wesleyan Media Project with help from the Center for Responsive Politics.
Television Ad Volumes Up Over Past Two Cycles
Overall, the volume of presidential advertising is much higher than in 2016—and in the past week was higher than in 2012 (Figure 3). Total volume is higher because of the heavy Bloomberg and Tom Steyer spending earlier in the Democratic nomination phase of the campaign. Airings bottomed-out in late March and the first half of April but have been steadily rising since June—and have since regularly come close to 2016 totals, even surpassing them in the most recent week.
Figure 3: Number of Presidential Ad Airings by Week (2012, 2016 and 2020)
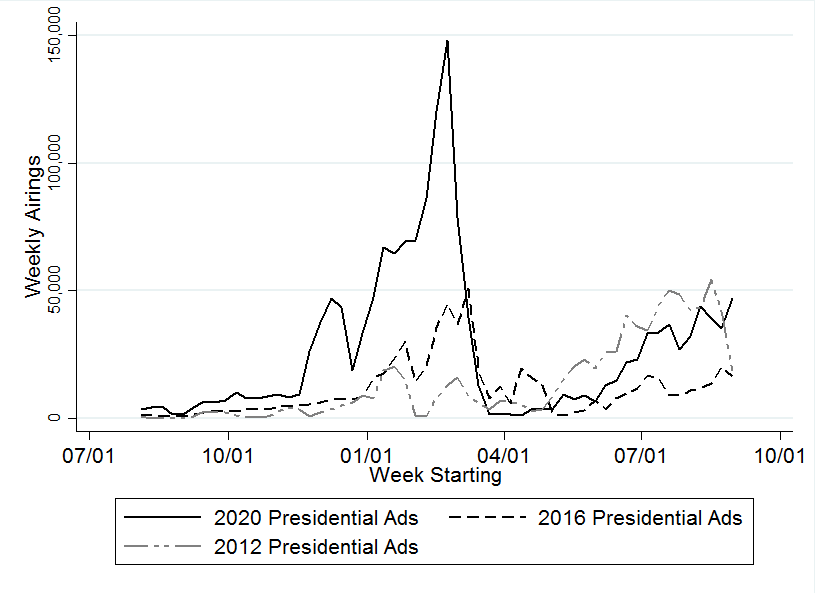
Numbers include ads aired on broadcast television.
CITE SOURCE OF DATA AS: Kantar/CMAG with analysis by the Wesleyan Media Project
“Certainly, the competitive nature of many Senate races—and the fact that control of the Senate is up for grabs this year—has made it easy for campaigns to raise money for Senate advertising,” said Michael Franz, co-director of the Wesleyan Media Project.
Figure 4: Number of Senate Ad Airings by Week (2012, 2016 and 2020)

Numbers include ads aired on broadcast television.
CITE SOURCE OF DATA AS: Kantar/CMAG with analysis by the Wesleyan Media Project
Figure 5 shows that House airings are also way up over 2012 and 2016. Week-to-week totals in the last six weeks have outpaced those earlier cycles by two to four times. More generally the Democratic majority in the House is not as vulnerable as GOP control of the U.S. Senate. Still, in the last month 20 House races have featured at least 2,000 airings on broadcast television stations. This included 12,000 airings in two Massachusetts primary campaigns, which were held on September 1.
Figure 5: Number of House Ad Airings by Week (2012, 2016 and 2020)
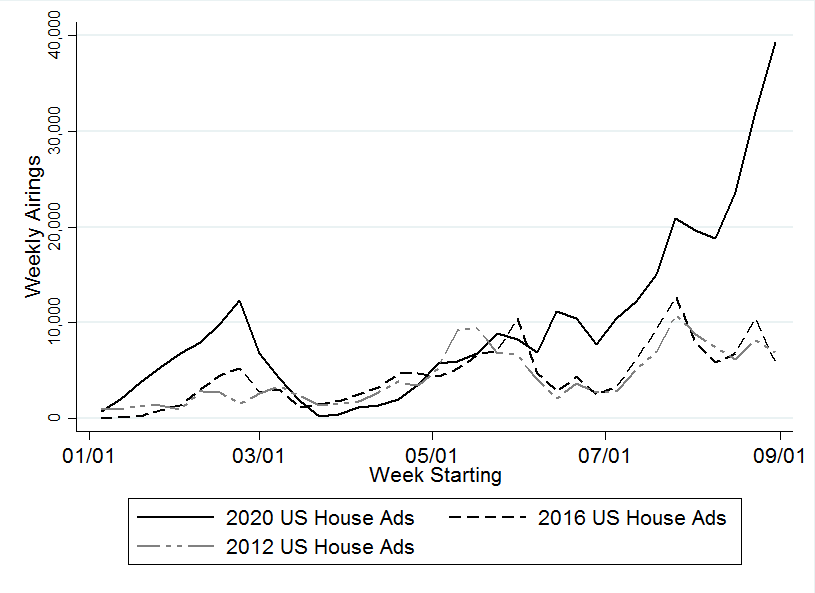
Numbers include ads aired on broadcast television.
CITE SOURCE OF DATA AS: Kantar/CMAG with analysis by the Wesleyan Media Project
One Nation Spends Heavily on Senate TV, Digital Ads
The conservative group, One Nation, has been the top group spender in federal races this election cycle (among those groups that have spent on television). The group, which does not disclose its donors, has spent over $42 million on in support of Republican candidates in 11 U.S. Senate races—most of them extremely competitive. Table 4 looks at the top TV spenders in federal races (in the full cycle-to-date) and compares that spending to their Google and Facebook ad totals. Senate Majority PAC, a Democratic-leaning super PAC, has spent over $32 million on television, Facebook and Google in many of those same Senate races as One Nation. While most groups airing ads on television have spent vastly more on television than on Facebook or Google ads, Priorities USA Action is an exception, with $12 million Facebook ad spending and $4 million in Google ad spending.
Table 4: Top Outside Group Spenders
| Sponsor | Party Lean | Television Spend ($) | FB spend ($) | Google spend ($) | Total ($) | Races (with TV ads) |
|---|---|---|---|---|---|---|
| One Nation | R | 40,353,950 | 843,761 | 1,450,900 | 42,648,611 | Sen: AL, AZ, CO, GA, IA, KS, KY, ME, MI, MT, NC |
| Senate Majority PAC | D | 30,437,320 | 933,031 | 692,500 | 32,062,851 | AZ, CO, GA, IA, ME, MI, MT, NC |
| Duty and Honor | D | 22,244,230 | 382,943 | 223,400 | 22,850,573 | AL, AZ, CO, GA, ME, MI, MT, NC |
| Majority Forward | D | 22,017,350 | 674,903 | 335,000 | 23,027,253 | AZ, CO, GA, IA, ME, MI, MT, NC |
| Doctor Patient Unity | R | 21,524,640 | 803,226 | 0 | 22,327,866 | Sen: AL, AZ, CO, GA, IA, KY, LA, ME, MI, MN, NC, NH, TX, VA; House: CA 23 |
| Priorities USA Action | D | 20,220,040 | 12,123,371 | 3,938,500 | 36,281,911 | Pres |
| America First Action | R | 19,201,930 | 1,526,920 | 1,838,700 | 22,567,550 | Pres |
| Senate Leadership Fund | R | 14,577,900 | 230,286 | 972,400 | 15,780,586 | Pres; Sen: GA, IA, KS, ME, MT, NC |
| AB PAC | D | 14,526,000 | 940,245 | 0 | 15,466,245 | Pres |
| Club for Growth Action | R | 14,245,360 | 1,302,790 | 137,100 | 15,685,250 | Pres; Sen: AL, KS; House: AL01, AL02, FL19, GA07, GA09, IN05, KY04, ME02, MI10, NC03, NC09, OK05, SC01, TN01, TX12, TX21, VA07, WI07 |
| Unite the Country | D | 10,351,540 | 1,610,273 | 336,000 | 12,297,813 | Pres |
| Persist PAC | D | 9,622,250 | 347,718 | 367,100 | 10,337,068 | Pres |
| VoteVets | D | 9,321,370 | 261,155 | 26,100 | 9,608,625 | Pres; Sen: NC, ME, NC, TX; House: NM03 |
| House Majority Forward | D | 8,535,940 | 140,550 | 161,100 | 8,837,590 | House: CA21, CA49, IA01, IA03, ME02, MI08, MI11, MN02, NC09, NH01, NM02, NV03, NY19, NY22, NY24, OK05, PA08, PA10, SC01, TX16, UT04, VA02, VA07 |
| American Action Network | R | 7,828,320 | 887,858 | 937,200 | 9,653,378 | House: IA01, IA03, IL13, ME02, MI08, MN01, MN07, NC08, NE02, NJ03, NM02, NV03, NY19, NY21, NY22, NY24, OK05, PA08, PA10, PA17, SC01, UT04, VA02, VA07 |
| The Lincoln Project | D | 7,373,960 | 3,123,389 | 50,300 | 10,547,649 | Pres; Sen: AK, AZ, IA, KY, ME, MT, NC |
| Restoration PAC | R | 7,058,180 | 435,987 | 345,800 | 7,839,967 | Pres; Sen: MI |
| VoteVets Action Fund | D | 4,922,140 | 649,586 | 152,700 | 5,724,426 | Sen: AZ, MI, NC; House: NC09, NY24, VA05 |
| U.S. Chamber of Commerce | R | 4,729,420 | 1,429,104 | 86,700 | 6,245,224 | Sen: AZ, CO, IA, KS, ME, NC; House: IA04 |
| Women Vote | D | 4,617,910 | 254,513 | 67,300 | 4,939,723 | Sen: IA, TX; House: IA02, IL03, NY24, VA05 |
| Table shows television, Facebook and Google spending for the top group spenders on television. For TV, numbers include ads aired on broadcast television and national cable between January 1, 2019, and September 4, 2020. Facebook ads are between January 6, 2019, and September 4, 2020. Google ads are between January 6, 2019, and September 5, 2020. CITE SOURCE OF DATA AS: Kantar/CMAG with analysis by the Wesleyan Media Project. |
||||||
Dark Money Common in House, Senate Races
In partnership with the Center for Responsive Politics, the Wesleyan Media Project tracks outside group ad spending by the type of donor disclosure. We classify groups as full-disclosure groups (meaning they disclose contributor lists to the Federal Election Commission), non-disclosing dark money groups (which are not required to disclose publicly their donors; these are most often 501c4 non-profits), and partial-disclosure groups (those that disclose donors but also accept contributions from dark money sources).
Groups airing ads using nondisclosed money are quite common in Senate and House races, though less so in the presidential race (Table 5). The table looks at outside group spending and ad totals and calculates the share of those airings that come from different group types. Sixty-five percent of pro-Republican outside group airings in Senate races during the entire 2019-2020 election cycle were from groups that do not disclose their money—so-called “dark money” groups—while almost half of pro-Democratic airings in the U.S. Senate races were undisclosed. In House races, 55 percent of pro-Democratic group airings were from dark money groups, while 39 percent of pro-Republican group airings were from dark money groups.
By contrast, dark money group airings were relatively rare in the presidential race, just 9.2 percent of pro-Democratic and 20.7 percent of pro-Republican group airings. Still, the majority of the pro-Democratic group airings came from groups that partially disclose their donors.
Table 5: Group Spending by Race and Disclosure Type
| Full Disclosure | Partial | Non-Disclosing (Dark Money) | Total | % Dark | ||
|---|---|---|---|---|---|---|
| President | ||||||
| Pro-Dem | Airings | 34,310 | 61,129 | 9,649 | 105,088 | 9.20% |
| est. $ | 31,140,250 | 39,344,430 | 7,277,760 | 77,762,440 | ||
| Pro-GOP | Airings | 56,097 | 0 | 14,683 | 70,780 | 20.70% |
| est. $ | 35,698,980 | 0 | 6,045,590 | 41,744,570 | ||
| Senate | ||||||
| Pro-Dem | Airings | 40,583 | 81,650 | 108,535 | 230,768 | 47.00% |
| est. $ | 25,631,200 | 48,211,010 | 62,531,130 | 136,373,340 | ||
| Pro-GOP | Airings | 59,488 | 0 | 111,203 | 170,691 | 65.10% |
| est. $ | 33,979,960 | 0 | 73,847,390 | 107,827,350 | ||
| House | ||||||
| Pro-Dem | Airings | 18,679 | 1,336 | 23,931 | 43,946 | 54.50% |
| est. $ | 8,634,690 | 886,760 | 13,890,350 | 23,411,800 | ||
| Pro-GOP | Airings | 22,879 | 6,105 | 18,539 | 47,523 | 39.00% |
| est. $ | 13,084,610 | 5,990,060 | 10,172,610 | 29,247,280 | ||
| Numbers include ads aired on broadcast television and national cable between January 1, 2019, and September 4, 2020. CITE SOURCE OF DATA AS: Kantar/CMAG with analysis by the Wesleyan Media Project. Group classification provided by the Center for Responsive Politics. |
||||||
Figure 6 looks at group spending rates between 2012 and 2020 in presidential and congressional races by week. We collapse partial and full disclosing groups into one category and plot the percentage of group airings from those groups. These graphs do not scale for volume but look only at the profile of groups on the air across the campaigns. Notably, in presidential elections, groups that publicly disclose all or partial lists of donors were more common than in congressional elections, where dark money groups were always a higher share of group ad totals.
In congressional races, dark money is more common early in the campaign, and full and partial disclosing groups constitute a higher share of group spending as Election Day approaches. In 2020, the share of fully and partially disclosing ads has plateaued in the last number of months, and as of early September, about half of outside group ads in congressional campaigns were from dark money groups.
Figure 6: Percentage of Group Ads Disclosing Donors by Cycle Over Time
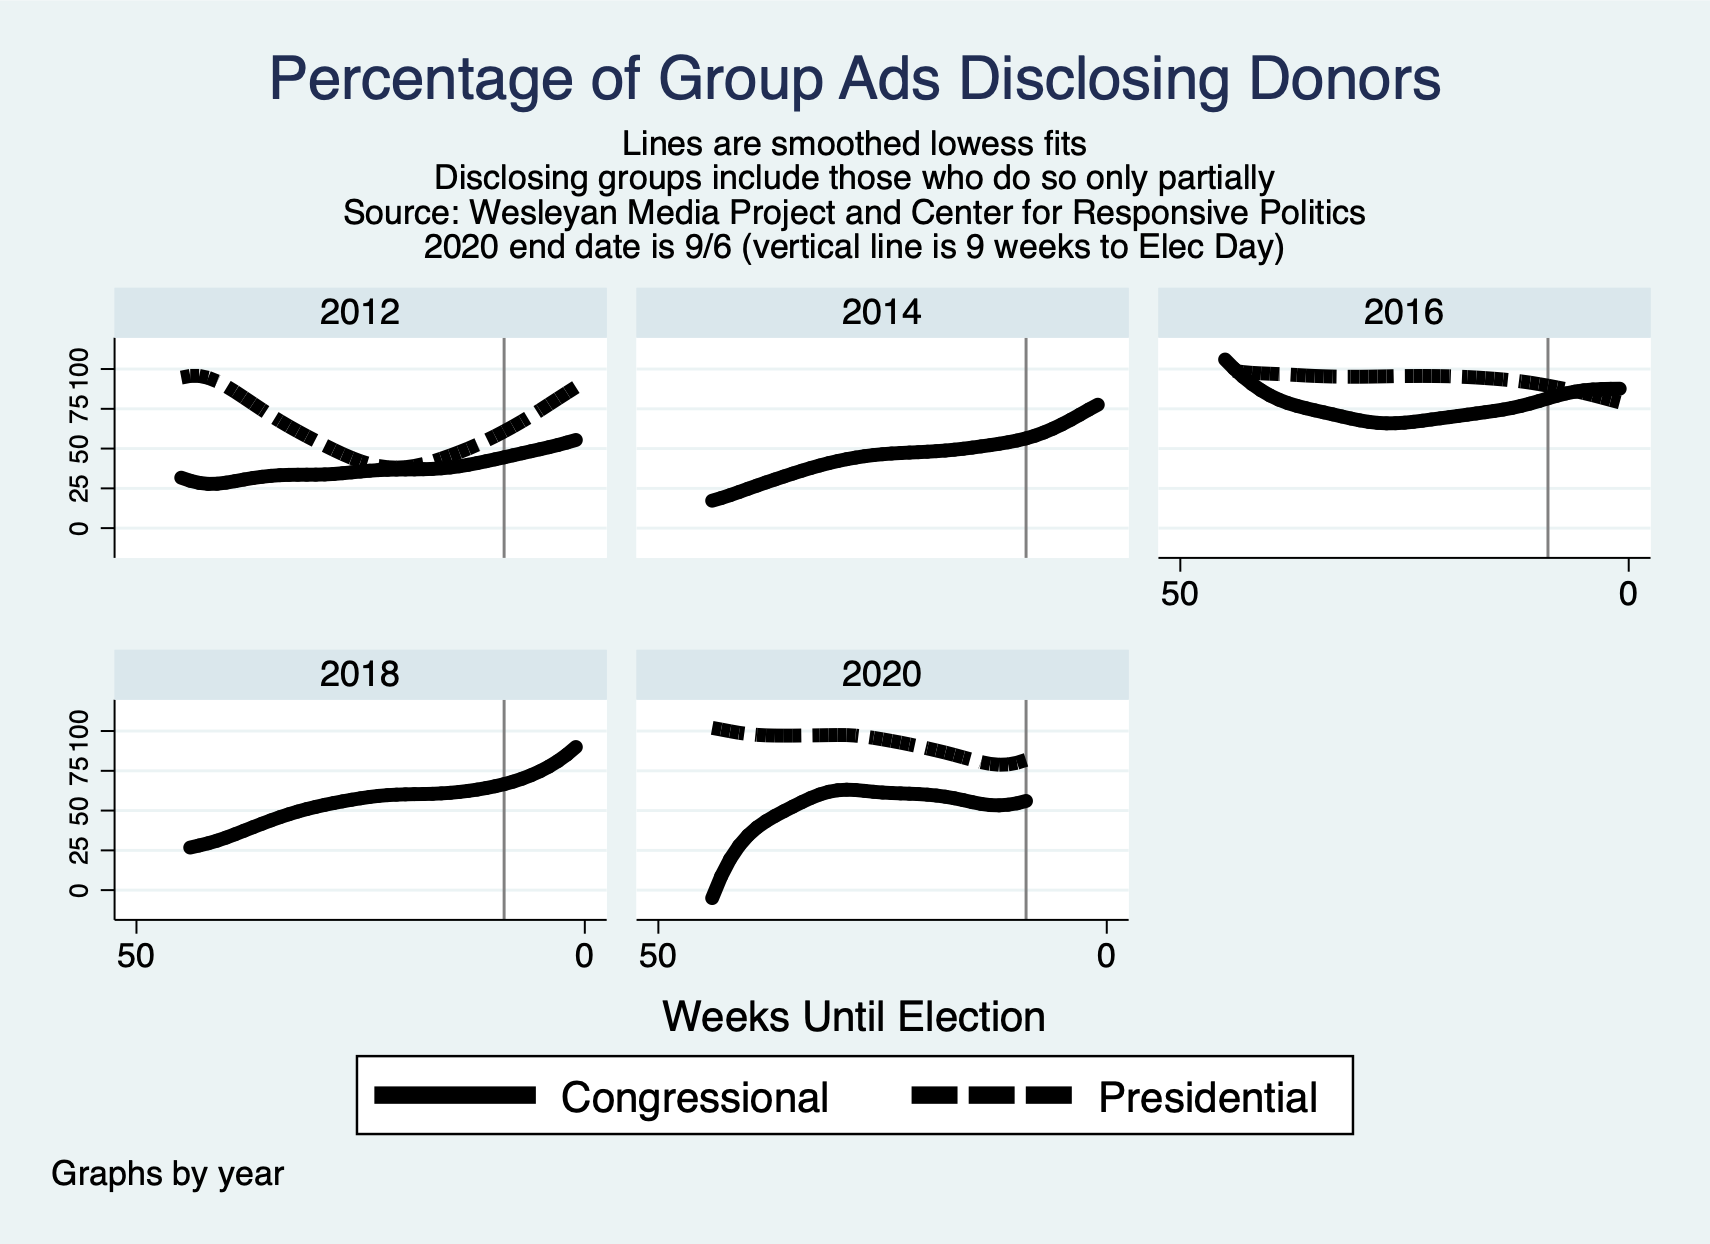
Numbers include ads aired on broadcast and national cable television between January 1 of the off-cycle year and September 4 of the election year.
CITE SOURCE OF DATA AS: Kantar/CMAG with analysis by the Wesleyan Media Project. Group disclosure classifications provided by the Center for Responsive Politics.
MT and GA Top Senate Races; NY-22 Top House Race
Tables 6 and 7 show spending in the top Senate and House races since August 10. At least 20,000 ads have aired in seven states with Senate races. Georgia has two Senate races, and 46,000 ads have aired across both. Montana has seen over 60,000 ads in the last month, with nearly even pro-Democratic and pro-GOP airings. Outside groups are heavily involved in these top races, with groups accounting for at least one-third of pro-Democratic and pro-Republican totals in the top seven states. All told, outside groups account for 42 percent of all Senate advertising since August 10.
Table 6: Airings and Spending by Race in U.S. Senate
| State | Airings | Cost ($) | Pro-Dem Airings | Pro-GOP Airings | Dem Cand $ | GOP Cand $ | Dem Grp % (of Dem) | GOP Grp % (of GOP) |
|---|---|---|---|---|---|---|---|---|
| MT | 61,058 | 19,527,980 | 30,465 | 30,593 | 1,472,480 | 1,649,660 | 45.8% | 34.9% |
| GA* | 46,051 | 24,712,140 | 23,801 | 22,238 | 3,134,600 | 1,663,830 | 57.8% | 70.9% |
| IA | 34,056 | 13,617,420 | 20,645 | 13,228 | 1,865,850 | 770,860 | 41.9% | 58.4% |
| NC | 26,602 | 21,101,500 | 13,307 | 12,565 | 1,987,540 | 1,553,550 | 71.6% | 53.2% |
| AZ | 21,726 | 12,982,100 | 11,668 | 10,058 | 3,146,960 | 2,015,810 | 43.5% | 43.1% |
| MI | 21,009 | 10,456,320 | 9,819 | 11,190 | 1,920,520 | 2,488,810 | 38.7% | 37.0% |
| ME | 20,428 | 12,978,110 | 11,443 | 8,985 | 1,316,180 | 597,030 | 54.1% | 47.2% |
| SC | 18,327 | 4,216,720 | 13,375 | 4,952 | 3,250,970 | 965,750 | 0.0% | 0.0% |
| KY | 18,289 | 5,887,810 | 10,945 | 7,344 | 2,227,570 | 1,217,190 | 2.9% | 40.2% |
| AL | 15,635 | 3,326,850 | 12,953 | 2,682 | 1,726,180 | 0 | 9.5% | 100.0% |
| CO | 14,163 | 9,358,800 | 6,566 | 7,597 | 2,142,950 | 1,513,100 | 45.2% | 42.9% |
| MA | 10,924 | 7,313,660 | 10,924 | 0 | 2,797,140 | 0 | 37.2% | 0.0% |
| KS | 10,771 | 4,156,570 | 6,913 | 3,858 | 1,106,640 | 400 | 20.7% | 99.8% |
| AK | 7,503 | 810,440 | 1,163 | 2,835 | 0 | 174,390 | 100.0% | 20.2% |
| NM | 1,428 | 257,480 | 1,145 | 283 | 181,690 | 75,790 | 0.0% | 0.0% |
| NH | 1,098 | 395,060 | 662 | 436 | 254,380 | 140,680 | 0.0% | 0.0% |
| MN | 571 | 58,900 | 571 | 0 | 58,900 | 0 | 0.0% | 0.0% |
| DE | 519 | 184,260 | 519 | 0 | 89,260 | 0 | 27.0% | 0.0% |
| TX | 347 | 287,530 | 0 | 347 | 0 | 287,530 | 0.0% | 0.0% |
| VA | 312 | 24,950 | 312 | 0 | 24,950 | 0 | 0.0% | 0.0% |
| WV | 252 | 123,480 | 0 | 0 | 0 | 0 | 0.0% | 0.0% |
| NE | 245 | 94,750 | 0 | 0 | 0 | 0 | 0.0% | 0.0% |
| MS | 230 | 5,250 | 230 | 0 | 5,250 | 0 | 0.0% | 0.0% |
| Numbers include ads aired on broadcast television between August 10 and September 4, 2020. Spending by formal party organizations is reflected in the airing and spending totals (as are any ads from third party candidates) but is not separated out in columns in this table. *Spending in Georgia collapses across both races in the state. CITE SOURCE OF DATA AS: Kantar/CMAG with analysis by the Wesleyan Media Project. |
||||||||
The top House race since August 10 is New York’s 22nd congressional district. As noted, two contested Democratic primary campaigns in Massachusetts are in the top 10. Outside groups are less involved in House races, but they did account for 2 in every 5 ads in the MA-01 race. All told, outside groups have sponsored 19 percent of House ads in these top 25 races in the last month.
Table 7: Airings and Spending by Race in U.S. House
| District | Airings | Cost ($) | Pro-Dem Airings | Pro-GOP Airings | Dem cand $ | GOP cand $ | Dem Grp % (of Dem) | GOP Grp % (of GOP) |
|---|---|---|---|---|---|---|---|---|
| NY-22 | 7,616 | 932,770 | 5,072 | 2,544 | 451,340 | 0 | 0.0% | 28.8% |
| MA-01 | 7,472 | 1,683,340 | 7,472 | 0 | 688,670 | 0 | 42.5% | 0.0% |
| NM-02 | 6,799 | 1,325,290 | 5,276 | 1,523 | 502,900 | 201,990 | 25.7% | 16.1% |
| NY-24 | 5,699 | 1,203,490 | 3,126 | 2,573 | 121,130 | 218,910 | 25.0% | 9.9% |
| CA-21 | 5,689 | 824,070 | 3,806 | 1,883 | 219,200 | 0 | 34.7% | 0.0% |
| MA-04 | 4,951 | 2,370,420 | 4,951 | 0 | 1,977,190 | 0 | 12.2% | 0.0% |
| SC-01 | 4,620 | 1,479,170 | 2,844 | 1,776 | 383,190 | 0 | 30.1% | 7.3% |
| OK-05 | 3,880 | 1,358,360 | 1,900 | 1,980 | 336,620 | 261,760 | 41.3% | 52.9% |
| MT-01 | 3,442 | 391,150 | 2,480 | 962 | 241,960 | 149,190 | 0.0% | 0.0% |
| VA-02 | 3,056 | 1,021,980 | 2,213 | 843 | 232,560 | 95,760 | 22.4% | 59.0% |
| NY-21 | 4,088 | 654,130 | 2,757 | 1,331 | 391,310 | 262,820 | 0.0% | 0.0% |
| ME-02 | 2,668 | 592,020 | 2,668 | 0 | 585,400 | 0 | 0.0% | 0.0% |
| UT-04 | 2,582 | 518,290 | 2,335 | 247 | 489,410 | 1,570 | 0.0% | 0.0% |
| FL-19 | 2,547 | 912,890 | 0 | 2,547 | 0 | 541,560 | 0.0% | 18.4% |
| VA-07 | 2,399 | 923,890 | 1,582 | 817 | 323,870 | 210,190 | 0.0% | 61.3% |
| AK-01* | 2,287 | 199,500 | 2,287 | 0 | 199,500 | 0 | 0.0% | 0.0% |
| IN-05 | 2,238 | 540,850 | 1,521 | 717 | 299,850 | 37,600 | 0.0% | 56.8% |
| IA-02 | 2,193 | 641,410 | 1,661 | 532 | 276,760 | 0 | 34.0% | 0.0% |
| IA-03 | 2,077 | 625,950 | 1,611 | 466 | 422,550 | 34,440 | 6.1% | 0.0% |
| VA-05 | 1,967 | 326,540 | 1,877 | 90 | 75,440 | 7,510 | 76.6% | 0.0% |
| TX-21 | 1,771 | 952,340 | 1,007 | 764 | 310,200 | 0 | 0.0% | 100.0% |
| WA-03 | 1,722 | 534,800 | 1,143 | 579 | 283,150 | 251,650 | 0.0% | 0.0% |
| IL-13 | 1,593 | 375,790 | 1,513 | 80 | 338,860 | 0 | 0.0% | 100.0% |
| NE-02 | 1,586 | 426,030 | 885 | 701 | 260,410 | 64,150 | 0.0% | 7.4% |
| OH-01 | 1,524 | 427,470 | 997 | 527 | 226,100 | 198,830 | 0.0% | 0.0% |
| Numbers include ads aired on broadcast television between August 10 and September 4, 2020. Spending by formal party organizations is reflected in the airing and spending totals (as are any ads from third party candidates) but is not separated out in columns in this table. *Candidate in AK-01 is the Democratic nominee but is running as unenrolled in a party. CITE SOURCE OF DATA AS: Kantar/CMAG with analysis by the Wesleyan Media Project. |
||||||||
About the Data
For the television ad totals, data reported here are from Kantar/CMAG and do not cover local cable buys, only broadcast television, national network and national cable advertising.
For Facebook ads, data come from the aggregate reports, but our figures are more comprehensive than what Facebook reports on their campaign page because we include spending on ads that are funded by the campaigns even when they run on different pages in our totals (e.g., Trump funded ads on Mike Pence or Brad Parscale’s pages are included in the Trump totals). We looked for pages attached to each candidate, including possible leadership PACs, joint-fund-raising committees, and, in the case of presidential candidates, affiliated Senate/House pages. Aggregate report entries are provided for each page name and disclaimer combination. Totals for most of this report reflect spending between April 9, 2020 or August 9, 2020 and September 4, 2020. These totals are calculated by subtracting the reported cumulative spending (as reported by Facebook as the total spent since May 2018) for the September 4, 2020 report and subtracting off the cumulative spending reported for April 8, 2020 or August 8, 2020.
Calculating cycle-to-date Facebook totals is more challenging than looking at totals from the last couple of months. In early January 2019, Facebook did not include page IDs (a unique identifier) for each entry in the aggregate report. Because pages can have the same name, a unique identifier for each page would be required to definitively identify an aggregate report entry, which Facebook does not provide going backward. Therefore, we did our best to associate each entry in the January 5, 2019, report with a page ID, which we had access to through the library API. There may be some slippage if two pages associated with candidates had identical names and disclaimers, but we believe these instances are rare for the set of ads covered in this report. For cycle-to-date spending, we subtracted the January 5, 2019 total from the September 4, 2020 total to get the spending by page and disclaimer for January 6, 2019 through September 4, 2020. We also report spending from April 9, 2020 through September 4, 2020 and August 9, 2020 through September 4, 2020. We rely on a Delta Lab monitoring tool to identify and avoid using days on which Facebook has a problem with the aggregated spending report.
In Table A (click here to download), we list the page names/disclaimer rows from the Facebook aggregate reports that we identified for this report. It is possible that we missed some spending from a Facebook page affiliated with a candidate running for office. This is exacerbated by the absence of EIN or FEC identifiers in the Facebook reports.
For Google ads, we downloaded the weekly reports from the platform’s Transparency Report. As a matter of practice with all of the platform data, we try to replicate our prior spending figures when we are calculating numbers for a new release. In that process, we discovered discrepancies between the data we downloaded in November and the information available in the December download for the same dates, which persists in September. Based on conversations with Google, we believe the discrepancies are partially but not exclusively due to the addition of advertisers targeting state-level races. We are working on a process to report these discrepancies, but the totals reflected in this release are current as of 9/8/20, the day on which we pulled the transparency report. Google only includes spending in federal and state races and only includes weekly totals but lists the sponsor’s EIN or FEC committee ID. We searched the list of advertisers for presidential candidates and affiliated leadership PACs and joint-fund-raising committees, and candidates for U.S Senate and affiliated single-candidate super PACs. We made the same assumption as with the Facebook data about any spending from House and Senate campaign committees by declared presidential candidates. Google spending is from the following time periods: April 12, 2020 through September 5, 2020; August 9, 2020 through September 5, 2020; and January 6, 2019 through September 5, 2020.
In Table B (click here to download), we list the advertiser name for all entities used in this report to calculate Google spending totals.
About This Report
The Wesleyan Media Project (WMP) provides real-time tracking and analysis of political advertising in an effort to increase transparency in elections. Housed in Wesleyan’s Quantitative Analysis Center (QAC) – part of the Allbritton Center for the Study of Public Life – the Wesleyan Media Project is the successor to the Wisconsin Advertising Project, which disbanded in 2009. It is directed by Erika Franklin Fowler, associate professor of government at Wesleyan University, Michael M. Franz, professor of government at Bowdoin College and Travis N. Ridout, professor of political science at Washington State University. WMP personnel include Laura Baum (Project Manager), Colleen Bogucki (Project Coordinator), Pavel Oleinikov (Associate Director, QAC), Markus Neumann (Post-Doctoral Fellow), and Jielu Yao (Post-Doctoral Fellow).
The Wesleyan Media Project’s digital advertising tracking is supported by the contributions of students in Delta Lab, an interdisciplinary research collaborative focusing on computationally-driven and innovative analyses and visualizations of media messaging. We especially thank Spencer Dean ’21, Kevin McMorrow ‘20, and Roshaan Siddiqui ‘22 for their contributions to this report.
The Wesleyan Media Project is supported by Wesleyan University, the John S. and James L. Knight Foundation, and the Democracy Fund. WMP is partnering again this year with the Center for Responsive Politics, to provide added information on outside group disclosure.
Periodic releases of data will be posted on the project’s website and dispersed via Twitter @wesmediaproject. To be added to our email update list, click here.
For more information contact: Lauren Rubenstein, lrubenstein@wesleyan.edu, (860) 685-3813 or (203) 644-7144
About Wesleyan University Wesleyan University, in Middletown, Conn., is known for the excellence of its academic and co-curricular programs. With more than 2,900 undergraduates and 200 graduate students, Wesleyan is dedicated to providing a liberal arts education characterized by boldness, rigor and practical idealism. For more, visit wesleyan.edu.
About the John S. and James L. Knight Foundation Knight Foundation is a national foundation with strong local roots. We invest in journalism, in the arts, and in the success of cities where brothers John S. and James L. Knight once published newspapers. Our goal is to foster informed and engaged communities, which we believe are essential for a healthy democracy.
About Democracy Fund Created by eBay founder and philanthropist Pierre Omidyar, Democracy Fund is a foundation helping to ensure that our political system can withstand new challenges and deliver on its promise to the American people. Democracy Fund has invested more than $125 million in support of a healthy, resilient, and diverse democracy with a particular focus on modern elections, effective governance, and a vibrant public square.