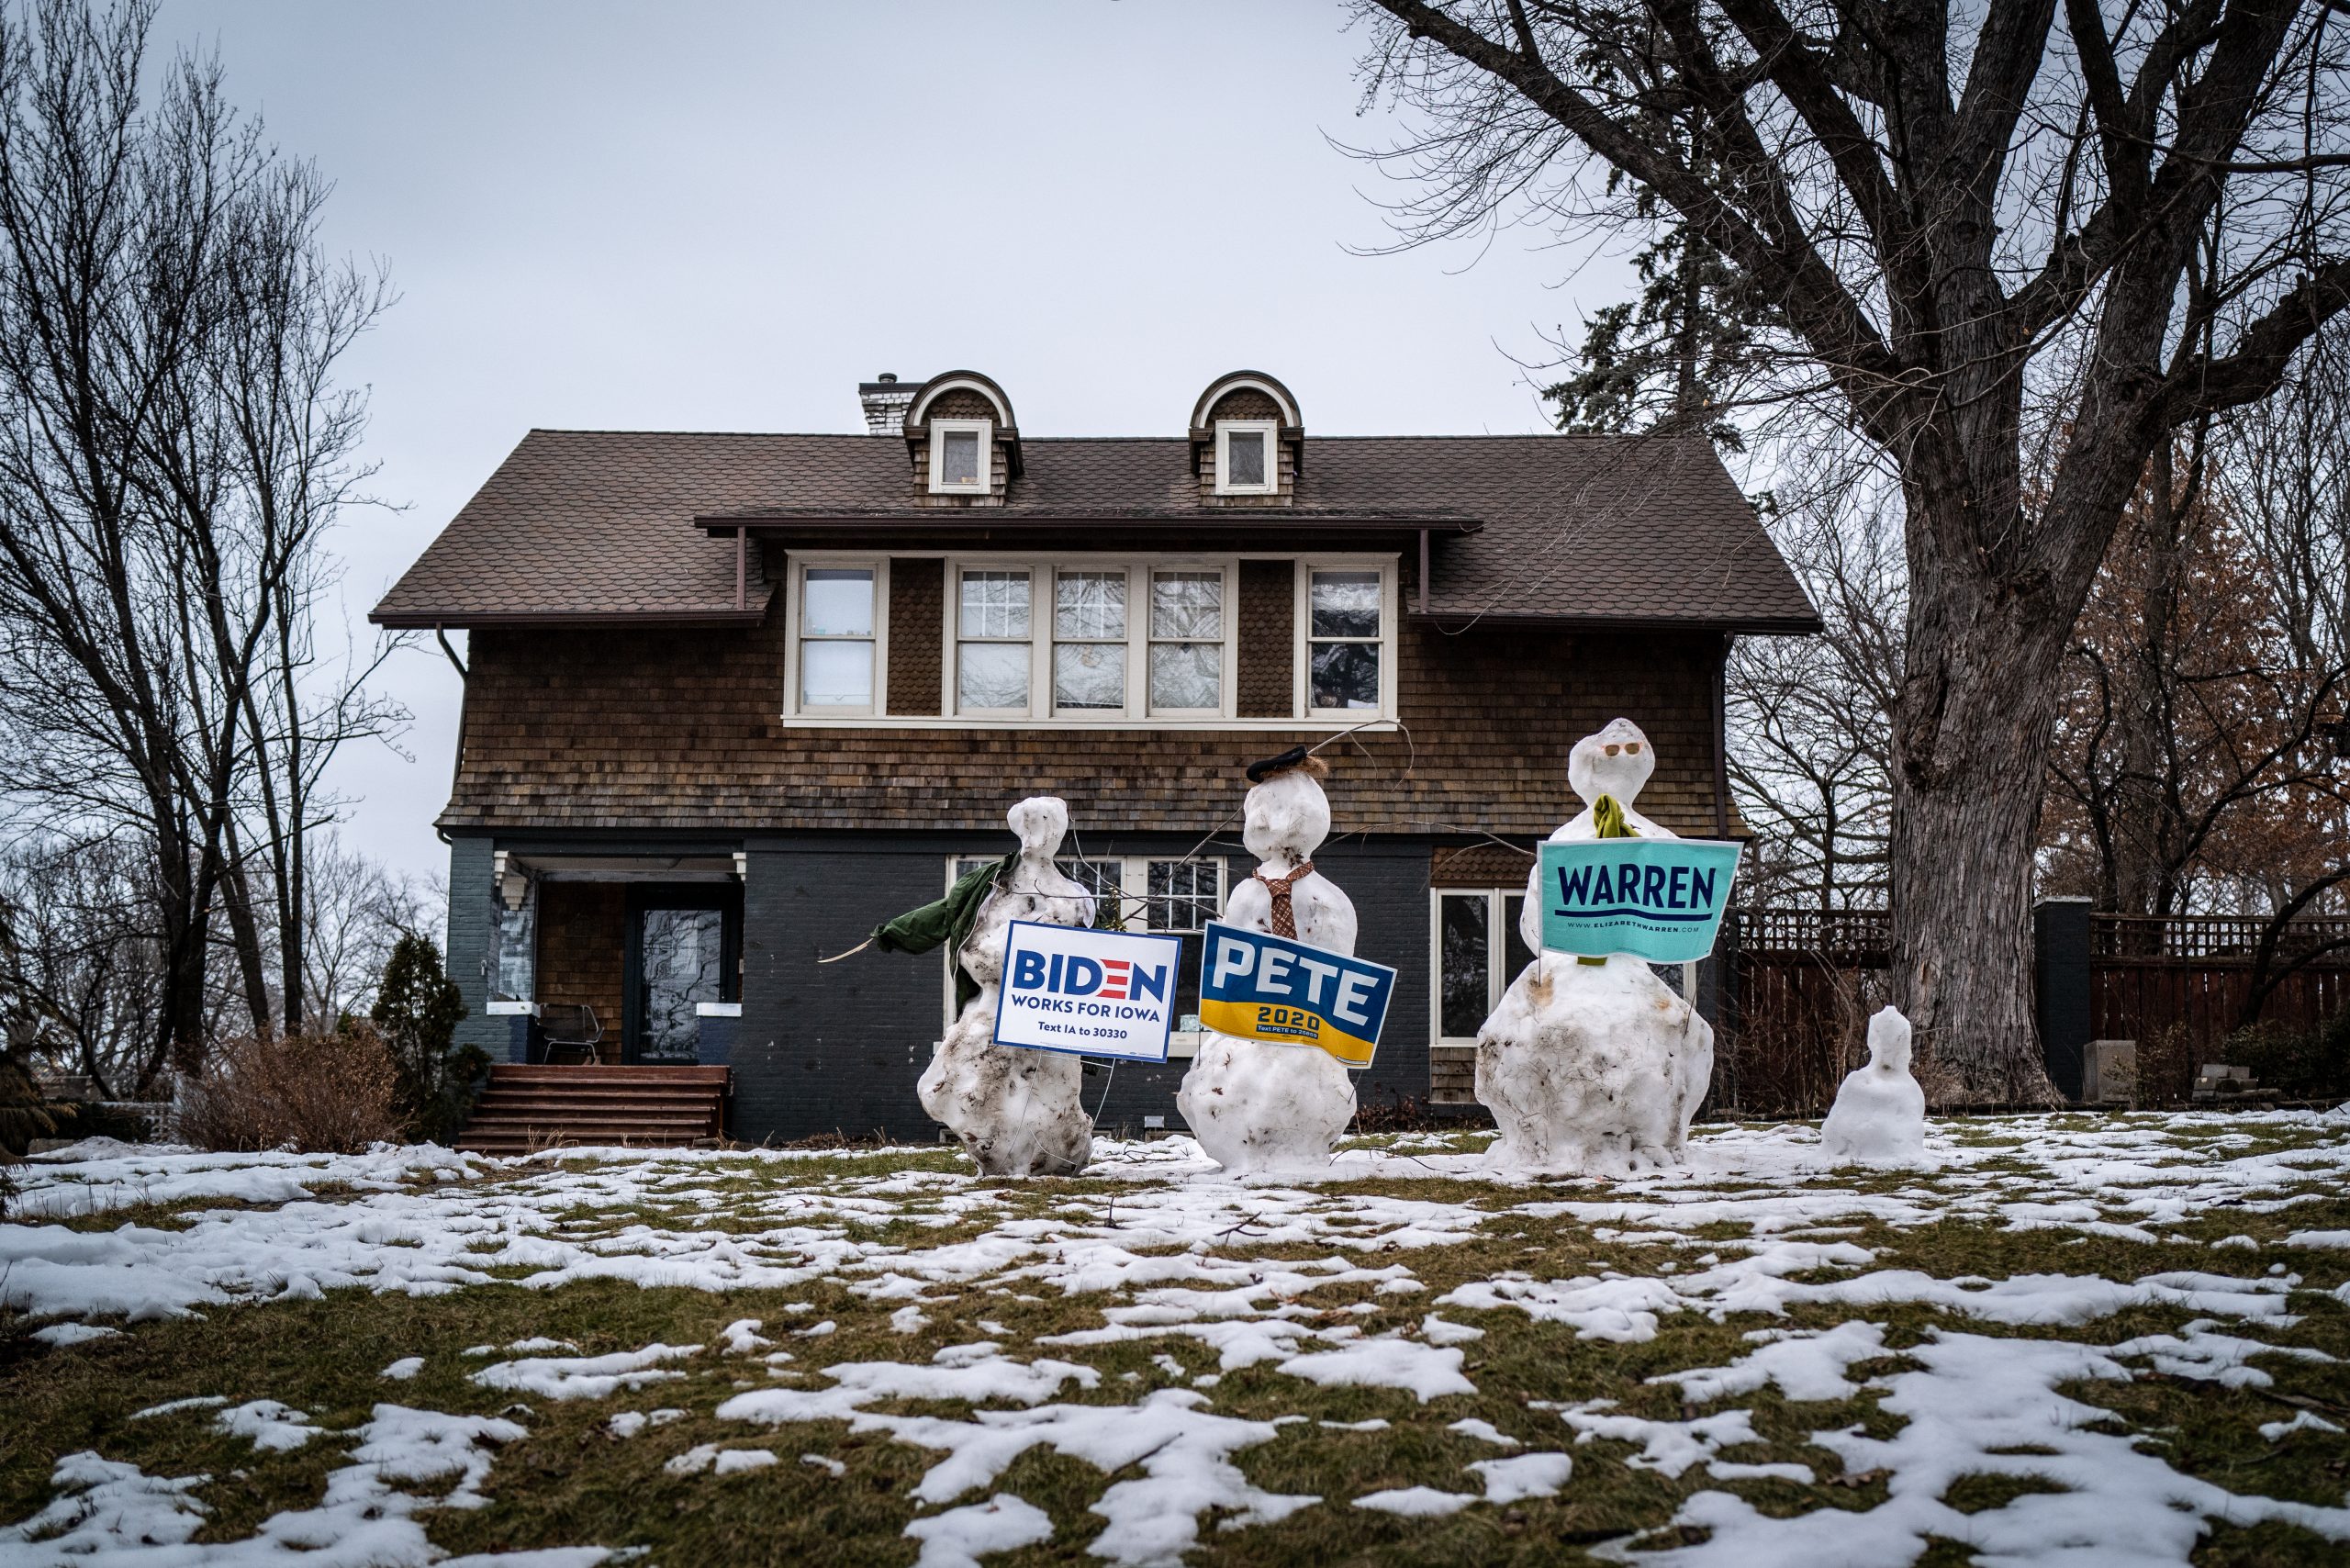
Photo: Phil Roeder/Flickr
Presidential Digital Ad Spending Nearly $200 Million
(MIDDLETOWN, CT) February 5, 2020 – New Hampshire voters will be casting presidential primary ballots in less than a week, and one candidate is dominating the airwaves: Tom Steyer. A new analysis from the Wesleyan Media Project shows that of the roughly $33 million in television ad spending in the state (including neighboring Massachusetts, Maine and Vermont) Steyer accounts for almost half: $15.6 million (see Table 1). Steyer has aired twice as many ads (19,307) as his nearest competitor, Michael Bloomberg, who has aired nearly 9,413 ads at a cost of about $6.2 million, while Bernie Sanders has spent $3.7 million for 8,028 ads.
Other candidates airing ads aimed at New Hampshire voters include Andrew Yang ($3 million), Pete Buttigieg ($1.4 million), Amy Klobuchar ($457,000) and Elizabeth Warren ($444,000).
Of the over $33 million in presidential ad spending in New Hampshire through February 2, most has been candidate spending. The exceptions include Reason to Believe PAC, which is a Carey committee (a hybrid PAC/super PAC) that supports former Massachusetts governor Deval Patrick, and VoteVets, an organization that has run an ad supportive of Pete Buttigieg.
Table 1: Spending and Ad Airings by Sponsor in New Hampshire
| Sponsor | Cost | Airings | * |
|---|---|---|---|
| Steyer, Tom | $15,607,193 | 19,370 | 1 |
| Bloomberg, Michael | $6,287,275 | 9,413 | 2 |
| Sanders, Bernie | $3,727,848 | 8,028 | 3 |
| Yang, Andrew | $2,989,833 | 4,663 | 4 |
| Buttigieg, Pete | $1,469,937 | 1,696 | 5 |
| Klobuchar, Amy | $456,516 | 543 | 6 |
| Warren, Elizabeth | $444,398 | 638 | 7 |
| Gillibrand, Kirsten | $411,750 | 450 | 8 |
| Gabbard, Tulsi | $392,484 | 1,056 | 9 |
| Trump, Donald | $195,555 | 355 | 10 |
| Delaney, John | $88,000 | 58 | 11 |
| Bennet, Michael | $61,384 | 71 | 12 |
| Sestak, Joe | $56,200 | 103 | 13 |
| Matern, Matt | $19,758 | 22 | 14 |
| 15 | |||
| Reason to Believe PAC | $546,200 | 89 | 16 |
| VoteVets | $545,940 | 308 | 17 |
| Demand Justice | $20,000 | 12 | 18 |
| Shining City Upon A Hill | $18,970 | 3 | 19 |
| Shawe, Shirley | $117,700 | 34 | 20 |
| $33,456,941 | 46,912 | 21 | |
| Numbers include ads aired on broadcast television between January 1, 2019, and February 2, 2020 in the following markets: Manchester, NH; Boston, MA; Burlington, VT; and Portland, ME. *The final column can be used to return to the original sorting of the table. CITE SOURCE OF DATA AS: Kantar/CMAG with analysis by the Wesleyan Media Project. |
|||
Spending in New Hampshire is down from 2016. Four years ago, advertisers had spent $86 million on presidential ads aimed at the state by February 2. In that year, of course, there were competitive races for both the Democratic and Republican nominations, and several outside groups spent heavily in those races.
Iowa Ad Spending Hits $50 Million
Spending in Iowa through Sunday, the day before the state held its caucuses, was significantly greater than in New Hampshire at just under $50 million (Table 2). That said, it is difficult to make a comparison between the states because Iowa has many more media markets, and much spending aimed at New Hampshire voters is done in the expensive Boston media market.
Steyer’s dominance of advertising in advance of New Hampshire, however, was not as great as in Iowa, where he accounted for about a quarter of ad spending. It’s also clear that several candidates invested far more in Iowa than in New Hampshire—at least to this point. Warren, for instance, spent 10 times as much on ads in Iowa as in New Hampshire through February 2.
“Many candidates have taken an ‘Iowa or bust’ TV strategy in the first few campaigns,” said Travis Ridout, co-director of the Wesleyan Media Project. “One week out before New Hampshire voters head to the polls, and neither Joe Biden nor his super PAC had aired a single ad there.”
Table 2: Spending and Ad Airings by Sponsor in Iowa
| Sponsor | Airings | Cost ($) | * |
|---|---|---|---|
| Steyer, Tom | 39,661 | 12,136,594 | 1 |
| Buttigieg, Pete | 13,631 | 7,104,442 | 2 |
| Sanders, Bernie | 23,351 | 6,563,585 | 3 |
| Yang, Andrew | 15,880 | 5,063,950 | 4 |
| Warren, Elizabeth | 12,838 | 4,185,779 | 5 |
| Biden, Joe | 10,397 | 3,390,198 | 6 |
| Klobuchar, Amy | 5,473 | 2,134,210 | 7 |
| Bennet, Michael | 1,565 | 843,185 | 8 |
| Gillibrand, Kirsten | 2,338 | 688,120 | 9 |
| Trump, Donald | 993 | 481,795 | 10 |
| Bloomberg, Michael | 925 | 462,563 | 11 |
| Delaney, John | 1,373 | 450,730 | 12 |
| Bullock, Steve | 809 | 402,475 | 13 |
| Harris, Kamala | 809 | 389,345 | 14 |
| Booker, Cory | 447 | 179,950 | 15 |
| Gabbard, Tulsi | 562 | 172,670 | 16 |
| Castro, Julian | 50 | 23,500 | 17 |
| Gravel, Mike | 5 | 7,700 | 18 |
| 19 | |||
| Unite the Country | 4,242 | 3,829,520 | 20 |
| Act Now on Climate | 756 | 419,205 | 21 |
| Dmfi DMFI PACac | 752 | 413,500 | 22 |
| United We Win Super PacPAC | 266 | 220,230 | 23 |
| Club for Growth | 275 | 57,176 | 24 |
| National Biodiesel Board | 43 | 25,775 | 25 |
| Total | 137,193 | 49,646,197 | 26 |
| Numbers include ads aired on broadcast television between January 1, 2019, and February 2, 2020 in Iowa. *The final column can be used to return to the original sorting of the table. CITE SOURCE OF DATA AS: Kantar/CMAG with analysis by the Wesleyan Media Project. |
|||
Total Presidential TV Ad Spending Over $430 Million
Overall, an estimated $435 million has been spent on television ads in the presidential race so far, with over half of that coming from Michael Bloomberg (Table 3). Bloomberg has spent over $230 million on television ads in the presidential race, while Tom Steyer has spent $128 million. Donald Trump is the third highest ad spender at $17 million, a figure that includes two very expensive Super Bowl ads that account for more than half of his total spend.
Table 3: Spending and Ad Airings by Sponsor in 2020 Presidential Race
| Sponsor | Ad Airings | Cost ($) |
|---|---|---|
| Bloomberg, Michael | 268,714 | 230,534,324 |
| Steyer, Tom | 179,290 | 128,706,327 |
| Trump, Donald | 4,720 | 17,226,939 |
| Sanders, Bernie | 37,155 | 11,923,370 |
| Buttigieg, Pete | 18,146 | 9,666,077 |
| Yang, Andrew | 25,278 | 9,186,904 |
| Warren, Elizabeth | 14,232 | 4,902,352 |
| Unite the Country | 4,244 | 3,847,520 |
| Biden, Joe | 10,852 | 3,703,573 |
| Klobuchar, Amy | 6,806 | 2,853,176 |
| Need to Impeach | 41 | 1,555,400 |
| Judicial Crisis Network | 40 | 1,100,000 |
| Gillibrand, Kirsten | 2,788 | 1,099,870 |
| AB PAC | 631 | 1,034,140 |
| Bennet, Michael | 1,636 | 904,569 |
| Gabbard, Tulsi | 2,470 | 823,318 |
| Ab Foundation | 975 | 790,750 |
| Reason To Believe PAC | 268 | 776,409 |
| Act Now On Climate | 786 | 776,205 |
| Votevets | 308 | 545,940 |
| Delaney, John | 1,431 | 543,230 |
| DMFI PAC | 809 | 425,170 |
| Harris, Kamala | 810 | 402,845 |
| United We Win Super PAC | 266 | 220,230 |
| Booker, Cory | 447 | 179,950 |
| Shawe, Shirley | 34 | $117,700 |
| Senate Leadership Fund | 327 | 105,300 |
| Defend American Democracy | 10 | 104,500 |
| Club for Growth | 5 | 57,176 |
| Sestak, Joe | 103 | 56,200 |
| Committee to Defend the President | 1 | 46,800 |
| National Biodiesel Board | 43 | 25,775 |
| Castro, Julian | 50 | 23,500 |
| Demand Justice | 12 | 20,000 |
| Matern, Matt | 22 | 19,758 |
| Democratic Coalition | 1 | 8,200 |
| Gravel, Mike | 5 | 7,700 |
| Pierce, Mark | 3 | 735 |
| Numbers include ads aired on national network, national cable and broadcast television between January 1, 2019, and February 2, 2020. CITE SOURCE OF DATA AS: Kantar/CMAG with analysis by the Wesleyan Media Project. |
||
By this point in 2016, $178 million had been spent on 184,000 ads in the presidential race, while in 2012, $67 million had been spent on 127,000 presidential ads by February 2. Presidential ad spending to that point in 2008 had amounted to $126 million for 176,000 ads.
As a further point of comparison, Michael Bloomberg alone has spent more this cycle than all ad spending through the start of February by all of the candidates running in each of the three previous nomination campaigns. Tom Steyer’s ad spending alone outpaces the collective ad spending in 2008 and 2012.
Table 4: Presidential Ad Airings and Spending by Election Cycle
| Cycle | Airings | Est. Spending (Ms) |
|---|---|---|
| 2008 | 175,862 | $125.9 |
| 2012 | 127,338 | $67.4 |
| 2016 | 184,796 | $177.8 |
| 2020 | 591,042 | $434.7 |
| Numbers include ads aired on national network, national cable and broadcast television between January 1 of the year prior to the election and February 2 of election year. CITE SOURCE OF DATA AS: Kantar/CMAG with analysis by the Wesleyan Media Project. |
||
Trump, Warren, Biden Emphasize Digital Spending
Table 5 shows digital ad spending on Facebook and Google since January of 2019 and since December 15 of last year—the date of our last comprehensive analysis of digital spending. As with television, Bloomberg dominates, having spent $58 million on ads on the two platforms—almost $46 million of that since the middle of December. Trump’s digital spending in the campaign clocks in at $38 million, while Steyer has spent $26 million on Facebook and Google.
All told, the Wesleyan Media Project has tracked $121 million in spending on Facebook ads related to the presidential race since the beginning of 2019, and $79 million in such spending on Google ads. These figures include spending by candidates—some of whom have dropped out of the race—and supportive groups, such as super PACs and leadership committees. Together, nearly $200 million has been spent on the two platforms on ads pertaining to the presidential race.
Table 5: Spending on Facebook and Google (since January 2019 and since December)
| FB (total) | FB (since 12/15/19) | Google (total) | Google (since 12/15/19) | Total $ | Total (since 12/15/19) |
|
|---|---|---|---|---|---|---|
| Bloomberg, Michael | 27,544,641 | 24,383,513 | 30,865,000 | 21,374,300 | 58,409,641 | 45,757,813 |
| Trump, Donald | 24,641,043 | 5,855,840 | 13,847,100 | 3,030,900 | 38,488,143 | 8,886,740 |
| Steyer, Tom | 19,613,806 | 6,700,407 | 6,546,400 | 2,025,700 | 26,160,206 | 8,726,107 |
| Buttigieg, Pete | 7,216,978 | 963,320 | 5,938,400 | 1,487,800 | 13,155,378 | 2,451,120 |
| Sanders, Bernie | 7,998,331 | 2,590,687 | 4,513,200 | 1,837,300 | 12,511,531 | 4,427,987 |
| Warren, Elizabeth | 7,089,039 | 1,694,237 | 3,846,900 | 623,100 | 10,935,939 | 2,317,337 |
| Biden, Joe | 3,856,929 | 622,361 | 2,108,600 | 457,800 | 5,965,529 | 1,080,161 |
| Klobuchar, Amy | 2,444,592 | 293,351 | 1,262,700 | 526,200 | 3,707,292 | 819,551 |
| Yang, Andrew | 2,041,147 | 382,249 | 1,006,200 | 415,600 | 3,047,347 | 797,849 |
| Gabbard, Tulsi | 1,057,456 | 236,244 | 1,971,200 | 449,300 | 3,028,656 | 685,544 |
| Booker, Cory | 2,228,112 | 33,504 | 240,400 | 0 | 2,468,512 | 33,504 |
| Castro, Julian | 1,829,278 | 921 | 214,100 | 2,300 | 2,043,378 | 3,221 |
| Williamson, Marianne | 1,166,466 | 1,175 | 225,000 | 0 | 1,391,466 | 1,175 |
| Bennet, Michael | 895,577 | 28,935 | 38,400 | 0 | 933,977 | 28,935 |
| Delaney, John | 222,784 | 1,478 | 199,900 | $0 | 422,684 | 1,478 |
| Patrick, Deval | 19,725 | 1,826 | 82,600 | 30,900 | 102,325 | 32,726 |
| Weld, William | 27,739 | 2,229 | 0 | 0 | 27,739 | 2,229 |
| Messam, Wayne | 11,015 | 0 | 9,400 | 0 | 20,415 | 0 |
| Figures come from the Facebook ad library reports and the Google Transparency Report. Spending covers the January 6, 2019, to February 1, 2020, period for Facebook and Google; Candidate numbers include spending by official campaign committees, leadership PACs, and joint fundraising committees. For some candidates, totals also include spending from their Senate or House campaign accounts. Candidates who dropped out of the race prior to our last press release on digital (12/19/19)—and groups that did not air presidential-related ads in the past month but did earlier—are not listed in this table, but their spending is included in the $199 million total. See “About the Data” section at the end of this report for more information on our methodology. |
||||||
Some candidates have spent more on digital than on television advertising. Figure 1 shows spending by medium for candidates who had not dropped out of the race prior to the WMP’s last comprehensive look at digital advertising in mid-December.
“While television spending tops digital spending overall, for a few candidates digital has been more important,” said Erika Franklin Fowler, co-director of the Wesleyan Media Project. “Donald Trump, Elizabeth Warren and Joe Biden have all spent more on two digital platforms, Facebook and Google, than on television ads.”
In fact, 69 percent of Trump’s total ad spending is on those two digital platforms, while 60 percent of Warren’s spending and 57 percent of Biden’s spending is on Facebook and Google (see Figure 1).
Figure 1: Total 2020 Presidential Ad Spending by Medium by Candidate
Click on the bars in Figure 1 to see the breakdowns by medium.
Digital spending figures come from the Facebook ad library reports and the Google Transparency Report. Spending covers the January 6, 2019 to February 1, 2020 period for Facebook and Google.Broadcast TV (which includes national network TV), cable TV, satellite TV, and radio data come from Kantar/CMAG and cover January 1, 2019 through February 2, 2020. Candidate numbers include spending by official campaign committees, leadership PACs, and joint fundraising committees. For some candidates, totals also include spending from their Senate or House campaign accounts. Super PACs supportive of particular candidates are not included. Candidates who dropped out of the race prior to our last press release on digital (12/19/19)—and groups that did not air presidential-related ads in the past month but did earlier—are not listed.
See About the Data section at the end of this report for more information on our methodology. Download figure data here.
Data visualization work by Kevin McMorrow ’20.
Most Democrats Focus on Health Care…and Trump
Table 6 shows the top three issues mentioned by each candidate still in the race—and the percentage of their television ad airings that mention the issue. For five of the candidates—Bennet, Biden, Bloomberg, Gabbard and Sanders—health care is the most mentioned issue. Klobuchar has focused on a closely related issue: prescription drugs.
Buttigieg has talked the most about manufacturing while Yang has talked most about the economy. Steyer’s focus has been energy and the environment, while Warren has emphasized corruption. Almost all of President Trump’s ads have mentioned impeachment.
Table 6: Most Mentioned TV Ad Issues by Candidate
| Candidate | Issue 1 | Issue 2 | Issue 3 | Airings | |||
|---|---|---|---|---|---|---|---|
| Bennet, Michael | Health care | 99.6% | Health insurance reform | 64.7% | Education | 40.5% | 1,636 |
| Biden, Joe | Health care | 47.6% | ACA | 43.0% | International Affairs | 41.3% | 10,852 |
| Bloomberg, Michael | Health care | 68.7% | Health insurance reform | 48.2% | Social Issues | 38.9% | 268,714 |
| Buttigieg, Pete | Manufacturing | 30.5% | Health care | 23.3% | Jobs | 22.5% | 18,146 |
| Gabbard, Tulsi | Health care | 60.0% | Iraq | 38.0% | Education | 32.2% | 2,470 |
| Klobuchar, Amy | Prescription Drugs | 51.0% | Health care | 41.8% | Climate Change | 25.1% | 6,806 |
| Sanders, Bernie | Health care | 65.9% | Social issues | 48.4% | Women's rights | 43.8% | 37,155 |
| Steyer, Tom | Energy/Environment | 56.3% | Economy | 37.0% | Climate Change | 34.6% | 179,290 |
| Trump, Donald | Impeachment | 98.3% | International Affairs | 80.5% | Corruption | 63.6% | 14,232 |
| Warren, Elizabeth | Corruption | 66.7% | Campaign Finance | 52.5% | Economy | 20.4% | 25,278 |
| Yang, Andrew | Economy | 58.1% | Health care | 38.9% | Taxes | 38.8% | 1,636 |
| Numbers include ads aired on national network, national cable and broadcast television between January 1, 2019, and February 2, 2020. CITE SOURCE OF DATA AS: Kantar/CMAG with analysis by the Wesleyan Media Project. |
|||||||
This does not mean that the candidates are ignoring Donald Trump, though some are more focused on him than others. In Table 7, we show the percentage of ads from the candidates still in the race that have contained an anti-Trump message. 90 percent of Bloomberg’s 242,000 ads have referenced Trump, as have 83 percent of Joe Biden’s. This is in contrast to just 15 percent of Pete Buttigieg’s ads and 40 percent of Bernie Sanders’.
“Democrats are again focused on issues related to health care,” said Michael Franz, co-director of the Wesleyan Media Project. “But not at the expense of attacking Trump. Some, like Biden, have made him the centerpiece of their campaign, in fact.”
Table 7: Mentions of Trump by Candidate
| Ads Mentioning Trump | Total Ads | % Mentioning Trump |
|
|---|---|---|---|
| Bennet, Michael | 642 | 1,636 | 39.2% |
| Biden, Joe | 8,998 | 10,852 | 82.9% |
| Bloomberg, Michael | 242,525 | 268,714 | 90.3% |
| Buttigieg, Pete | 2,702 | 18,146 | 14.9% |
| Gabbard, Tulsi | 0 | 2,470 | 0.0% |
| Klobuchar, Amy | 4,617 | 6,806 | 67.8% |
| Sanders, Bernie | 14,695 | 37,155 | 39.6% |
| Steyer, Tom | 65,622 | 179,290 | 36.6% |
| Warren, Elizabeth | 10,231 | 14,232 | 71.9% |
| Yang, Andrew | 2,630 | 25,278 | 10.4% |
| Total | 353,471 | 565,388 | 62.5% |
| Numbers include ads aired on national network, national cable and broadcast television between January 1, 2019, and February 2, 2020. CITE SOURCE OF DATA AS: Kantar/CMAG with analysis by the Wesleyan Media Project. |
|||
About the Data
For the television ad totals, data reported here are from Kantar/CMAG and do not cover local cable buys, only broadcast television, national network and national cable advertising except where they are noted in Figure 1.
For Facebook ads, data come from the aggregate reports. Aggregate report entries are provided for each page name and disclaimer combination. In early January 2019, Facebook did not include page IDs (a unique identifier) for each entry in the aggregate report. Because pages can have the same name, a unique identifier for each page would be required to definitively identify an aggregate report entry, which Facebook does not provide going backward. Therefore, we did our best to associate each entry in the January 5, 2019, report with a page ID, which we had access to through the library API. There may be some slippage if two pages associated with presidential candidates had identical names and disclaimers, but we believe these instances are rare for the set of ads covered in this report. We looked for pages attached to each candidate, including possible leadership PACs, joint-fund-raising committees, and affiliated Senate/House pages. To calculate our totals for this report, we used the 1/5/19 report and merged on the 2/1/20 report totals. In each report, Facebook provides the to-date totals for each row, which covers the full archive back to May 2018. We subtracted the 1/5/19 total from the 2/1/20 total to get the spending by page and disclaimer for January 6, 2019 through February 1, 2020. Pages can sponsor ads that are funded by different entities. We made the assumption that all spending by federal office-holders running for president this cycle (e.g., Cory Booker) was in support of their presidential campaign up until they date they dropped out of the presidential race (if applicable), even if some spending was reported from their House or Senate page or leadership PAC, especially because many of the leadership PAC spending occurred on the same pages as the campaign spending. We separate Tom Steyer’s totals from Need to Impeach because he is not currently an elected official, and Need to Impeach ran anti-Trump ads before Steyer announced his run for the Democratic nomination (Need to Impeach is also a super PAC). Advertisements run by pages known to be associated with presidential candidates are included even in instances where the ads ran without an appropriate disclaimer.
In Table A (click here to download), we list the page names/disclaimer rows from the aggregated reports that we identified for this report. It is possible that we missed some spending from a Facebook page affiliated with a candidate running for office. This is exacerbated by the absence of EIN or FEC identifiers in the Facebook reports. A few disclaimers changed from being in all caps to proper case between this WMP report and previous reports.
For Google ads, we downloaded the weekly reports from the platform’s Transparency Report. As a matter of practice with all of the platform data, we try to replicate our prior spending figures when we are calculating numbers for a new release. In that process, we discovered discrepancies between the data we downloaded in November and the information available in the December download for the same dates, which persists in January. Based on conversations with Google, we believe the discrepancies are partially but not exclusively due to the addition of advertisers targeting state-level races. We are working on a process to report these discrepancies, but the totals reflected in this release are current as of 2/4/20, the day on which we pulled the transparency report. Google only includes spending in federal and state races and only includes weekly totals but lists the sponsor’s EIN or FEC committee ID. We searched the list of advertisers for presidential candidates and affiliated leadership PACs and joint-fund-raising committees. We made the same assumption as with the Facebook data about any spending from House and Senate campaign committees by declared presidential candidates. Google spending is from January 6, 2019 through February 1, 2020.
In Table B (click here to download), we list the advertiser name for all entries used in this report to calculate Google candidate totals.
About This Report
The Wesleyan Media Project (WMP) provides real-time tracking and analysis of political advertising in an effort to increase transparency in elections. Housed in Wesleyan’s Quantitative Analysis Center (QAC) – part of the Allbritton Center for the Study of Public Life – the Wesleyan Media Project is the successor to the Wisconsin Advertising Project, which disbanded in 2009. It is directed by Erika Franklin Fowler, associate professor of government at Wesleyan University, Michael M. Franz, professor of government at Bowdoin College and Travis N. Ridout, professor of political science at Washington State University. WMP personnel include Laura Baum (Project Manager), Colleen Bogucki (Project Coordinator), Pavel Oleinikov (Associate Director, QAC), and Courtney Page-Tan (Post-Doctoral Fellow).
The Wesleyan Media Project is supported by Wesleyan University,
the John S. and James L. Knight Foundation, and the Democracy Fund. WMP is partnering again this year with the Center for Responsive Politics, to provide added information on outside group disclosure.
Periodic releases of data will be posted on the project’s website and dispersed via Twitter @wesmediaproject. To be added to our email update list, click here.
For more information contact:
Lauren Rubenstein, lrubenstein@wesleyan.edu,
(860) 685-3813 or (203) 644-7144
About Wesleyan University
Wesleyan University, in Middletown, Conn., is known for the excellence of its academic and co-curricular programs. With more than 2,900 undergraduates and 200 graduate students, Wesleyan is dedicated to providing a liberal arts education characterized by boldness, rigor and practical idealism. For more, visit wesleyan.edu.
About the John S. and James L. Knight Foundation
Knight Foundation is a national foundation with strong local roots. We invest in journalism, in the arts, and in the success of cities where brothers John S. and James L. Knight once published newspapers. Our goal is to foster informed and engaged communities, which we believe are essential for a healthy democracy.
About Democracy Fund
Created by eBay founder and philanthropist Pierre Omidyar, Democracy Fund is a foundation helping to ensure that our political system can withstand new challenges and deliver on its promise to the American people. Democracy Fund has invested more than $125 million in support of a healthy, resilient, and diverse democracy with a particular focus on modern elections, effective governance, and a vibrant public square.