Both Republican and Democratic Ads Mention the President;
In Two Decades of Midterms, Only GWB After 9/11 Comes Close in Positive References
![]()
![]()
(MIDDLETOWN, CT) August 1, 2018 – Members of a president’s party often avoid mentions of the president during a midterm election year, but 2018 is proving to be an exception, according to an analysis by the Wesleyan Media Project.
The project examined mentions of the president in broadcast television ads aired in House and Senate races since June 5. Figure 1 displays the percentage of ads mentioning the incumbent president positively and negatively in each midterm election cycle dating back to 2002, and Table 1 provides the raw numbers and percentages.
President Trump was referenced positively in 14.8 percent of federal election ads (amounting to over 27,000 ads) in the past two months, whereas President Obama was mentioned positively in less than 1 percent of federal election ads aired during the same time period in 2010 and 2014. Even George W. Bush in 2002, whose approval ratings were sky high in the wake of the September 2001 terrorist attacks, was mentioned positively in a smaller share of federal ads (13.9 percent).
![]()
Figure 1: Presidential References in Congressional Midterm Advertising
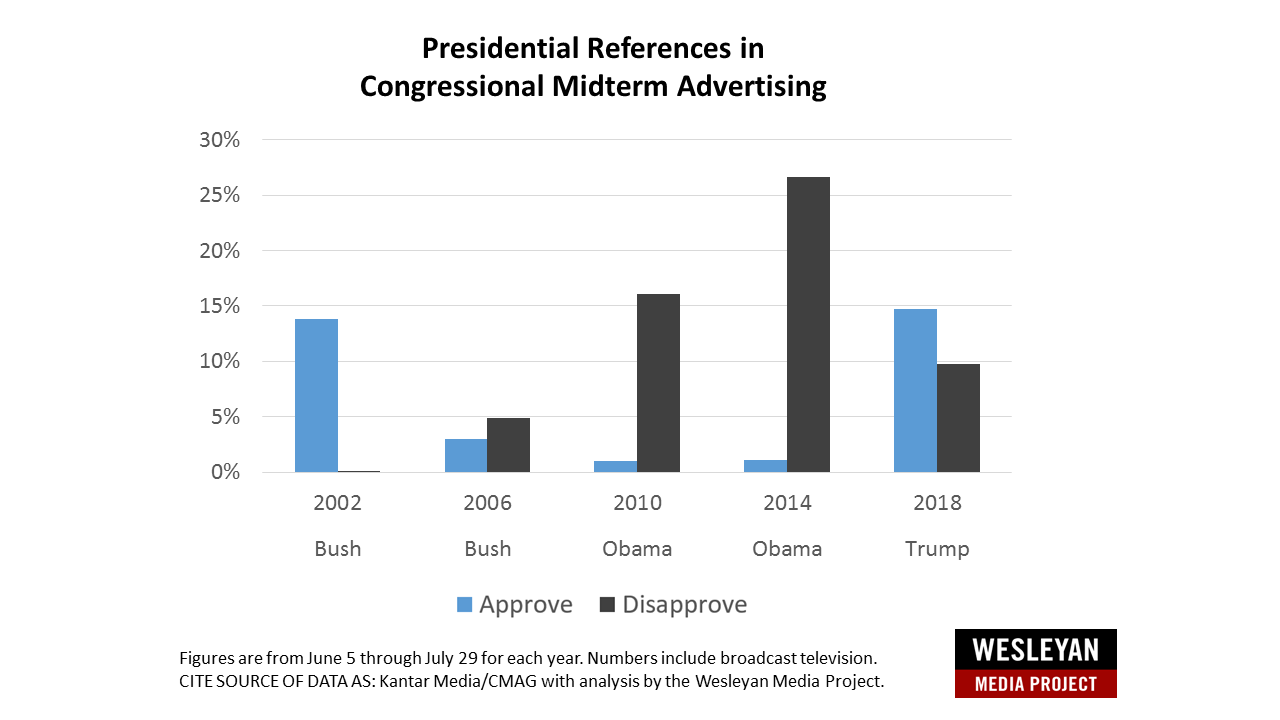
Trump was also referenced negatively in fewer ads than Obama was in 2010 and 2014 during the same summer time period (June 5 through July 29). Trump gets a negative mention in 9.7 percent of airings, while Obama was mentioned in a disapproving way in 16.1 percent of ads in 2010 and 26.6 percent of ads in 2014. George W. Bush, however, was mentioned negatively in almost no ads in 2002 and in less than 5 percent of ads in 2006.
![]()
Table 1: Presidential References in US House and US Senate Ads by Tone and Year
| Year | Ads with positive mention | % with positive mention | Ads with negative mention | % with negative mention | Total ads | |
|---|---|---|---|---|---|---|
| Bush | 2002 | 4,883* | 13.9% | 12* | 0.0% | 35,222* |
| Bush | 2006 | 1,487* | 3.0% | 2,461* | 4.9% | 50,120* |
| Obama | 2010 | 1,125 | 1.0% | 18,150 | 16.1% | 112,607 |
| Obama | 2014 | 1,654 | 1.0% | 42,022 | 26.6% | 157,910 |
| Trump | 2018 | 27,166 | 14.7% | 17,879 | 9.7% | 183,736 |
| Figures are from June 5 through July 29 for each year. Numbers include broadcast television. *Volume of ads aired in 2002 and 2006 are not comparable to later years because not all media markets were tracked. CITE SOURCE OF DATA AS: Kantar Media/CMAG with analysis by the Wesleyan Media Project. |
||||||
Table 2 shows how the tone of presidential mentions varies by party and year. Most positive mentions of Trump came from Republicans, but 4.9 percent of Democratic-sponsored ads mentioned Trump positively. These include several “red state” Democrats running for the Senate, such as Heidi Heitkamp in North Dakota, Joe Manchin in West Virginia, Phil Bredesen in Tennessee and Joe Donnelley in Indiana, who are using their ads to explain the circumstances under which they support or work with Trump.
About 22 percent of Democratic ads mentioned Trump in a negative fashion. (The only Republican to criticize Trump in an ad is Minnesota Representative Erik Paulsen, who says he stood up to Trump regarding the protection of the Boundary Waters). A greater percentage of Republican ads were critical of Obama in 2010 (24 percent)—and especially in 2014, when 42.5 percent of Republican ads mentioning Obama were negative.
![]()
Table 2: Tone of Presidential Mentions by Party and Year
| Positive | Negative | |||
|---|---|---|---|---|
| Dem | Rep | Dem | Rep | |
| 2002 | 6.0% | 23.6% | 0.1% | 0.0% |
| 2006 | 1.8% | 3.7% | 13.1% | 0.4% |
| 2010 | 1.7% | 0.7% | 0.0% | 23.9% |
| 2014 | 2.7% | 0.0% | 2.8% | 42.5% |
| 2018 | 4.9% | 26.8% | 21.7% | 0.0% |
| Figures are from June 5 through July 29 for each year. Numbers include broadcast television. CITE SOURCE OF DATA AS: Kantar Media/CMAG with analysis by the Wesleyan Media Project. |
||||
![]()
“The president’s party tends to lose seats in midterm elections, and so typically candidates from the party tend to avoid tying themselves to the incumbent while opponent partisans typically go on the attack,” Michael Franz, co-director of the Wesleyan Media Project, stated: “It is really striking that Republicans are overwhelmingly embrace Trump and very rarely criticizing him. It suggests that many Republican primary voters are still very enthusiastic about the president, in a way that Democratic voters were not for Obama in his two midterm elections.”
![]()
The focus on Trump in television ads is reflected in advertising on Facebook as well, which is discussed in our special report.
![]()
Heavy Spending in Races for Governor
Table 3 shows the number of ads aired in gubernatorial, House, and Senate races since our last release, for the time period between June 5 and July 29. Over 400,000 spots have aired in those nearly eight weeks, totaling over $150 million. Over half of those spots, 260,000, have aired in gubernatorial races. Cycle-to-date, nearly 1.5 million spots have aired, costing over $500 million. The 1.5 million airings this cycle represent an 86 percent increase over 2014 ad volumes at this same point in the cycle when only 798,397 ads had aired.
Since June 5, candidates have accounted for over 80 percent of ads in gubernatorial races and nearly 70 percent of ads in U.S. House races. Candidates have sponsored just over half of the ads airing in Senate races, however, with outside groups responsible for more than 2 in every 5 ads in those campaigns.
![]()
Table 3: Federal Ad Airings and Cost Since June 5
| Sponsor | Ads Aired | Est. Cost (in Ms) | % Sponsored | |
|---|---|---|---|---|
| Governor | Candidate | 216,613 | 76.9 | 83.2 |
| Group | 41,698 | 16.1 | 16 | |
| Party | 2,003 | 0.88 | <1 | |
| House | Candidate | 48,429 | 16.5 | 69.7 |
| Coordinated | 1,693 | 0.44 | 2.4 | |
| Group | 18,378 | 5.7 | 26.5 | |
| Party | 950 | 0.42 | 1.4 | |
| Senate | Candidate | 60,733 | 20.0 | 53.1 |
| Coordinated | 463 | 0.18 | <1 | |
| Group | 51,817 | 14.1 | 45.3 | |
| Party | 1,273 | 0.18 | 1.1 | |
| Figures are from June 5 through July 29, 2018. Numbers include broadcast television. CITE SOURCE OF DATA AS: Kantar Media/CMAG with analysis by the Wesleyan Media Project. |
||||
Table 4 shows that ads airing in just three gubernatorial races—Florida, Tennessee, and Michigan—account for over 130,000 ads, more than the total ads airing since June 5 in all House races or in all Senate races. In Florida and Michigan, outside groups have been particularly active, sponsoring 21 percent and 25 percent of total ads, respectively. Groups have largely skipped the primary campaigns in Tennessee.
We show also in these tables the primary and/or run-off dates in each state, which in some cases are upcoming in August, while in others concluded a number of weeks ago. As such, many ads in these races are essentially general election ads. For example, in Illinois where the primary ended in March, Democratic nominee for Governor, J.B. Pritzker, has aired nearly 16,000 spots since June 5. His Republican opponent, incumbent Bruce Rauner, has aired over 11,000 ads.
In Georgia, candidates for the Republican nomination competed in a late July run-off election. (Democrats avoided a run-off when Stacey Abrams won over 75 percent of the vote in the May 22 primary.) Almost all of the ads aired in the gubernatorial race in Georgia since June 5 were pro-Republican, either by the candidates in the run-off or by pro-GOP outside groups (either attacking the Democratic nominee or one of the GOP candidates.)
![]()
Table 4: Top Gubernatorial Races Since June 5
| Ads Aired | Est. Cost (in Ms) | % Group | Primary Date |
|
|---|---|---|---|---|
| FL | 52,600 | 22.9 | 21.2% | 8/28 |
| TN | 51,645 | 13.5 | 1.1% | 8/2 |
| MI | 30,562 | 10.0 | 25.2% | 8/7 |
| IL | 27,805 | 12.4 | 1.7% | 3/20 |
| CO | 13,598 | 5.7 | 40.5% | 6/26 |
| SC | 10,916 | 2.9 | 22.0% | 6/12 |
| GA | 9,259 | 4.0 | 24.3% | 5/22 (7/24 run-off) |
| NV | 9,013 | 3.7 | 47.7% | 6/12 |
| KS | 6,836 | 1.5 | 20.3% | 8/7 |
| OK | 5,869 | 1.7 | 7.4% | 6/26 (8/28 run-off) |
| WI | 5,312 | 1.4 | 20.8% | 8/14 |
| MD | 3,842 | 2.0 | 0.0% | 6/26 |
| CT | 3,835 | 2.4 | 0.0% | 8/14 |
| IA | 3,411 | 0.9 | 0.0% | 6/5 |
| WY | 3,167 | 0.5 | 0.0% | 8/21 |
| Figures are from June 5 through July 29, 2018. Numbers include broadcast television. CITE SOURCE OF DATA AS: Kantar Media/CMAG with analysis by the Wesleyan Media Project. |
||||
Table 5 shows top House races since June 5. At the top of the list is the special election in Ohio’s 12th district to fill a seat vacated by a Republican retirement earlier this year. The primary in late May determined the major party nominees, and the general election (for a term to end next January) is set for August 7. (Another election will be held in November for a full two-year term.) The race is hotly contested by both parties, as has been the case for most special elections since 2017, though ad volumes are higher on the GOP side. The Democratic candidate, Danny O’Connor, has aired over 1,900 spots, with an additional 380 from the Democratic Congressional Campaign Committee. Those 2,200 spots, though, lag behind the over 4,200 on behalf of Republican Troy Balderson. Interestingly, Balderson has sponsored only 566 spots while the Congressional Leadership Fund—a pro-GOP super PAC—has aired over 2,400 ads on his behalf.
![]()
Table 5: Top House Races Since June 5
| Ads Aired | Est. Cost (in Ms) | % Group | Primary Date |
|
|---|---|---|---|---|
| OH-12 | 6,498 | 2.5 | 37.6% | 8/7 (special elec) |
| WA-05 | 3,874 | 0.5 | 0.0% | 8/7 |
| TN-08 | 3,333 | 0.8 | 0.0% | 8/2 |
| NY-19 | 3,143 | 0.6 | 8.2% | 9/13 |
| AZ-02 | 2,837 | 0.5 | 0.0% | 8/28 |
| CO-03 | 2,414 | 0.2 | 42.3% | 6/26 |
| SC-04 | 2,208 | 0.6 | 43.1% | 6/5 (run-off 6/26) |
| TN-06 | 2,125 | 0.9 | 0.0% | 8/2 |
| AL-02 | 2,007 | 0.4 | 30.2% | 6/5 (7/17 run-off) |
| TN-02 | 1,958 | 0.6 | 10.7% | 8/2 |
| NY-24 | 1,923 | 0.3 | 38.7% | 9/13 |
| MD-06 | 1,805 | 2.1 | 0.0% | 6/26 |
| OK-01 | 1,772 | 0.5 | 42.3% | 6/26 |
| MI-06 | 1,708 | 0.4 | 28.4% | 8/7 |
| HI-01 | 1,578 | 0.4 | 0.0% | 8/11 |
| Figures are from June 5 through July 29, 2018. Numbers include broadcast television. CITE SOURCE OF DATA AS: Kantar Media/CMAG with analysis by the Wesleyan Media Project. |
||||
Table 6 shows top Senate races, and it is clear that outside groups are heavily invested in these campaigns. They are responsible for over half of the ads aired since June 5 in five of the top eight races, including 4 in every 5 ads aired in Missouri. There is a primary in that state set for August 7, but incumbent Democrat Claire McCaskill is not seriously threatened for the nomination, and Republican Josh Hawley is heavily favored. Because the race is expected to be one of the most competitive this cycle, both McCaskill and Hawley are likely conserving funds for later in the general election (at least until the primary ends, when they can begin spending from their general election fund-raising totals), letting pro-candidate groups duke it out on the airwaves.
![]()
Table 6: Top Senate Races Since June 5
| Ads Aired | Est. Cost (in Ms) | % Group | Primary Date |
|
|---|---|---|---|---|
| FL | 15,347 | 6.5 | 56.3% | 8/28 |
| MT | 15,130 | 1.5 | 38.5% | 6/5 |
| MO | 13,765 | 4.0 | 83.1% | 8/7 |
| IN | 13,196 | 4.0 | 57.6% | 5/8 |
| ND | 10,787 | 1.7 | 38.4% | 6/12 |
| WI | 7,565 | 1.9 | 52.1% | 8/14 |
| NV | 6,085 | 2.4 | 48.2% | 6/12 |
| WV | 5,876 | 0.8 | 86.5% | 5/8 |
| TN | 5,643 | 1.3 | 0.0% | 8/2 |
| AZ | 4,225 | 2.1 | 27.9% | 8/28 |
| MI | 3,727 | 1.5 | 2.8% | 8/7 |
| NJ | 3,513 | 3.1 | 0.1% | 6/5 |
| OH | 2,780 | 1.1 | 0.0% | 5/8 |
| UT | 1,631 | 0.5 | 0.0% | 6/26 |
| Figures are from June 5 through July 29, 2018. Numbers include broadcast television. CITE SOURCE OF DATA AS: Kantar Media/CMAG with analysis by the Wesleyan Media Project. |
||||
![]()
Senate Majority PAC Spends Big
Several groups have been spending big in House, Senate and gubernatorial races recently. Table 7 shows that the top group spender since June 5 has been Senate Majority PAC, a group that has supported Democratic candidates in several states with competitive Senate races: Florida, Indiana, Missouri, Montana, North Dakota, Nevada and West Virginia. The group spent over $5 million on almost 20,000 ads between June 5 and July 29. Florida Grown PC, a group supporting Republican Adam Putnam for governor, has spent over $3.3 million since June 5. The Republican group One Nation has spent over $3 million backing Republican Senate candidates in Arizona, Indiana, Missouri, North Dakota, Nevada and West Virginia.
![]()
Table 7: Top Group Spenders in Federal and Gubernatorial Races
| Sponsor | Est. Cost (in Ms) | Airings | Party Lean | Races |
|---|---|---|---|---|
| Senate Majority PAC | 5.1 | 19,911 | Dem | Sen-FL, Sen-IN, Sen-MO, Sen-MT, Sen-ND, Sen-NV, Sen-WV |
| Florida Grown PC | 3.3 | 7,992 | Rep | Gov-FL |
| One Nation | 3.0 | 9,486 | Rep | Sen-AZ, Sen-IN, Sen-MO, Sen-ND, Sen-NV, Sen-WV |
| Build A Better Michigan | 1.1 | 2,881 | Dem | Gov-MI |
| Frontier Fairness PAC | 1.1 | 2,588 | Dem | Gov-CO |
| New Republican PAC | 1.0 | 2,603 | Rep | Sen-FL |
| National Liberty Federation Inc. | 1.0 | 2,387 | Rep | Gov-FL |
| Americans For Prosperity | 0.8 | 3,747 | Rep | Gov-MI, Gov-WI, Sen-MO |
| Congressional Leadership Fund | 0.8 | 2,444 | Rep | House: OH-12 |
| American Action Network | 0.8 | 2,448 | Rep | House: CO-06, KY-06, ME-02, OH-01, OR-02 |
| Changing Georgia's Future | 0.7 | 1,494 | Rep | Gov-GA |
| Teachers for Kennedy | 0.7 | 1,050 | Dem | Gov-CO |
| AFSCME People | 0.6 | 1,434 | Dem | Sen-FL |
| Economic Freedom Alliance | 0.6 | 464 | Rep | Gov-IL |
| American Chemistry Council | 0.6 | 1,175 | Rep | Sen-MS, Sen-NV, House: CA-10, IL-06, KS-03, LA-01, OH-01, OK-02, TX-23, TX-36 |
| AFSCME Nevada | 0.5 | 1,252 | Dem | Gov-NV |
| U.S. Chamber of Commerce | 0.5 | 1,544 | Rep | Sen-MS, House: AL-02, FL-26, TX-23 |
| America Next | 0.5 | 1,488 | Rep | FL-Sen |
| Fund for Michigan Jobs | 0.5 | 1,622 | Rep | Gov-MI |
| CFG Action Missouri | 0.4 | 1,983 | Rep | Sen-MO |
| Figures are from June 5 through July 29, 2018. Numbers include broadcast television. CITE SOURCE OF DATA AS: Kantar Media/CMAG with analysis by the Wesleyan Media Project. |
||||
![]()
Dark Money Still a Big Player
In partnership with the Center for Responsive Politics, the Wesleyan Media Project tracks the disclosure type of outside groups in federal races. We classify groups as full disclosure groups (meaning they disclose contributor lists to the Federal Election Commission), non-disclosure dark money groups (which are not required to disclose publicly their donors; these are most often 501c4 non-profits), and partial disclosure groups (those that disclose donors but also accept contributions from dark money sources).
Table 8 shows ad total across the full election cycle, as well as ads aired in federal races since June 5. We split the ads by pro-Democratic or pro-Republican orientation, though these include ads aired in a party primary. That is, pro-GOP groups include groups airings ads against a Republican but in support of another Republican.
In the full cycle, just over half of all group-sponsored ads have come from dark money groups, those not publicly disclosing donors. Since June 5, however, the share of ads from non-disclosing sources has dropped to just over 40 percent of ads. In House races, the majority of ads in the full cycle and since June 5 have been from non-disclosing sources, as have all ads on behalf of Republicans in Senate races.
The biggest difference across these contexts is pro-Democratic group ads in Senate races. Seventy-five percent of these ads since June 5, and 55 percent in the full cycle, have come from partial disclosure groups. This is driven entirely by Senate Majority PAC, which is technically a super PAC (and therefore reports donors to the FEC) but accepts contributions from dark money sources.
![]()
Table 8: Outside Groups by Disclosure Type
| House | Ads (full cycle) | Ads (from 6/5) | % of grp (full cycle) | % of grp (from 6/5) |
|---|---|---|---|---|
| Pro-Dem groups | ||||
| None | 25,925 | 6,662 | 68.1% | 76.6% |
| Partial | 3,938 | 1,343 | 10.3% | 15.4% |
| Full | 8,228 | 692 | 21.6% | 8.0% |
| Pro-GOP groups | ||||
| None | 30,548 | 5,093 | 61.9% | 52.6% |
| Partial | 10,930 | 2,444 | 22.1% | 25.3% |
| Full | 7,912 | 2,142 | 16.0% | 22.1% |
| Senate | ||||
| Pro-Dem groups | ||||
| None | 27,304 | 2,962 | 37.6% | 11.2% |
| Partial | 40,207 | 19,911 | 55.4% | 75.0% |
| Full | 5,090 | 3,665 | 7.0% | 13.8% |
| Pro-GOP groups | ||||
| None | 42,152 | 14,088 | 50.8% | 55.7% |
| Partial | 2,596 | 1,038 | 3.1% | 4.1% |
| Full | 38,186 | 10,153 | 46.0% | 40.2% |
| TOTAL | 243,016 | 70,193 | ||
| NO DISCLOSURE | 125,929 | 28,805 | 51.8% | 41.0% |
| Figures are from either January 1, 2017 through July 29, 2018 (full cycle) or June 5, 2018 through July 29, 2018. Numbers include broadcast television. CITE SOURCE OF DATA AS: Kantar Media/CMAG with analysis by the Wesleyan Media Project. |
||||
Sheila Krumholz, executive director of the Center for Responsive Politics (CRP), says, “We’re seeing more dark money than ever before.” Moreover, she adds, “Dark money groups themselves are reporting less of their spending to the Federal Election Commission than they did in past elections, meaning that they will likely write these ads off as ‘social welfare’ when they file their tax returns with the IRS next year.” In past reports we have compared ad spending by groups in the TV data against reported spending by those groups to the Federal Election Commission. We do not report that for groups in this analysis, but CRP tracks all reported spending to the Federal Election Commission.
![]()
Democrats Overwhelmingly Talk Healthcare; Republicans Talk Taxes but Not Necessarily Tax Reform
Democratic ads for federal office this summer are overwhelmingly talking about healthcare, and for the first time in several election cycles, explicitly making favorable references to the Affordable Care Act. Pro-Republican ads meanwhile are primarily talking about taxes, but explicit references to the 2017 tax reform bill are few and far between.
An astounding 63 percent of pro-Democratic ads for U.S. House discuss healthcare, and 16 percent contain an explicit statement about being in favor of the Affordable Care Act (Table 9). U.S. Senate contests are less likely to feature health care, but it is still the top issue, appearing in over a quarter (28 percent) of all ad airings (Table 10).
![]()
Table 9: Top Five Issues/Mentions in U.S. House Advertising
| Democrat | % of Airings | Republican | % of Airings |
|
|---|---|---|---|---|
| Healthcare | 63% | Pro-Trump | 35% | |
| Anti-Trump | 38% | Taxes | 27% | |
| Medicare | 19% | Immigration | 25% | |
| Pro-ACA | 16% | Budget | 15% | |
| Gun policy | 15% | Healthcare | 15% | |
| Figures are from June 5 through July 29, 2018. CITE SOURCE OF DATA AS: Kantar Media/CMAG with analysis by the Wesleyan Media Project. |
||||
![]()
Table 10: Top Five Issues/Mentions in U.S. Senate Advertising
| Democrat | % of Airings | Republican | % of Airings | |
|---|---|---|---|---|
| Healthcare | 28% | Taxes | 32% | |
| Jobs | 25% | Pro-Trump | 22% | |
| Energy & Env | 16% | Corruption | 20% | |
| Corruption | 15% | Healthcare | 19% | |
| Manufacturing | 13% | Budget | 18% | |
| Figures are from June 5 through July 29, 2018. CITE SOURCE OF DATA AS: Kantar Media/CMAG with analysis by the Wesleyan Media Project. |
||||
![]()
“This is really a shift in campaign messaging. In the years since the Affordable Care Act’s passage, Democrats have primarily run away from it, making at best very oblique references to the law, while Republicans made Obamacare attacks a signature issue,” said Erika Franklin Fowler, co-director of the Wesleyan Media Project. “Legislative developments and the unpopularity of Republican health reform efforts appear to have changed the strategy, and Democrats are viewing health care as a key issue in this election cycle.”
![]()
On the Republican side, taxes are sharing top billing with pro-Trump messaging. Nearly a third of Senate airings (32 percent) and nearly three in every 10 ads (27 percent) in U.S. House races discuss taxes; however, explicit references to the GOP tax reform bill are much less common (6 percent of U.S. Senate airings and 15 percent of U.S. House airings; pro-Democratic ads for U.S. House are attacking on tax reform in 12 percent of their ads).
Health care has receded as a top talking point for Republicans, but it still makes the top five list for both federal offices with under 20 percent of airings.
![]()
Gubernatorial Candidates Also Talk Trump; Different Issue Focus by Party
President Trump is also a focus of gubernatorial airings, with 19 percent of pro-Democratic ads attacking the president and a third (33 percent) of pro-Republican ads touting him (see Table 11).
Democratic gubernatorial ads are talking most about education (46 percent) followed by health care (30 percent) while Republicans gubernatorial ads – similar to the federal ones – are focused on taxes (35 percent) and immigration (35 percent).
![]()
Table 11: Top Five Issues/Mentions in Gubernatorial Advertising
| Democrat | % of Airings | Republican | % of Airings | |
|---|---|---|---|---|
| Education | 46% | Taxes | 35% | |
| Healthcare | 30% | Immigration | 35% | |
| Taxes | 23% | Pro-Trump | 33% | |
| Jobs | 23% | Jobs | 20% | |
| Anti-Trump | 19% | Abortion | 16% | |
| Figures are from June 5 through July 29, 2018. CITE SOURCE OF DATA AS: Kantar Media/CMAG with analysis by the Wesleyan Media Project. |
||||
Trump is also a top talking point in Facebook advertising for many U.S. Senate candidates. Read our special report comparing the content of TV creatives to a sample of Facebook ads here.
![]()
![]()
About This Report
Data reported here from Kantar/CMAG do not cover local cable buys, only broadcast television, national network and national cable buys. All cost estimates are precisely that: estimates.
The Wesleyan Media Project (WMP) provides real-time tracking and analysis of political advertising in an effort to increase transparency in elections. Housed in Wesleyan’s Quantitative Analysis Center – part of the Allbritton Center for the Study of Public Life – the Wesleyan Media Project is the successor to the Wisconsin Advertising Project, which disbanded in 2009. It is directed by Erika Franklin Fowler, associate professor of government at Wesleyan University, Michael M. Franz, professor of government at Bowdoin College and Travis N. Ridout, professor of political science at Washington State University. WMP staff include Laura Baum (Project Manager), Dolly Haddad (Project Coordinator) and Matthew Motta (Research Associate).
The Wesleyan Media Project is supported by Wesleyan University. Data are provided by Kantar Media/CMAG with analysis by the Wesleyan Media Project. WMP is partnering again this year with the Center for Responsive Politics, to provide added information on outside group disclosure.
Periodic releases of data will be posted on the project’s website and dispersed via Twitter @wesmediaproject. To be added to our email update list, click here.
For more information contact:
Lauren Rubenstein, lrubenstein@wesleyan.edu, (860) 685-3813
About Wesleyan University
Wesleyan University, in Middletown, Conn., is known for the excellence of its academic and co-curricular programs. With more than 2,900 undergraduates and 200 graduate students, Wesleyan is dedicated to providing a liberal arts education characterized by boldness, rigor and practical idealism. For more, visit wesleyan.edu.