Photo: Gage Skidmore/Flickr
WMP Publishes End-of-Cycle Report
(MIDDLETOWN, CT) March 23, 2021 – New research published by the Wesleyan Media Project co-directors in The Forum: A Journal of Applied Research in Contemporary Politics (gated) provides a post-mortem on the fast and furious political advertising in the 2020 cycle. Our analysis of the volume and spending on political advertising—both on television and online—suggests a few initial conclusions. First, ad volumes in 2020 were off the charts. Second, Democrats’ dominance of advertising on television was clear, with pro-Biden ads outnumbering pro-Trump ads two to one or even three to one in most media markets in battleground states. Democratic ad advantages were evident in U.S. Senate and U.S. House races as well. Third, it was a big year for digital, with digital ad spending’s share up considerably from 2016 and 2018. Fourth, ads in 2020 were slightly less negative than in previous years. Finally, interest group ads accounted for 1 in every 4 ads aired in federal races.
1. Ad Volumes Were Very High
Presidential ad airings on broadcast television in the 2019-2020 cycle numbered 2.35 million, more than double the 1.03 million ad airings in 2015-2016 (Figure 1, Panel A). In the 2011-2012 election cycle, there were 1.43 million ad airings. Of course, looking at the whole election cycle includes the massive ad spending by Michael Bloomberg, and to a lesser extent, Tom Steyer, in the Democratic nomination race. If one only looks at ads since September 1 in each year (shown in Panel B on the right of Figure 1), then ad airings in 2020 (804,000) are more than double airings in 2016 (386,000) and are considerably greater than airings in 2012 (634,000).
Figure 1: Volume of Television Airings in Presidential Race, 2012, 2016 and 2020
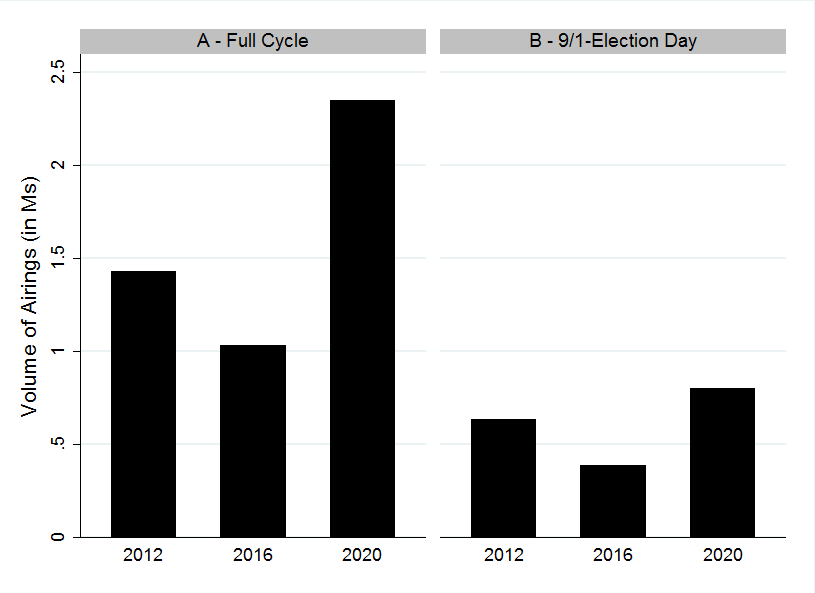
Source: Kantar/CMAG with analysis by the Wesleyan Media Project.
Note: Full-cycle totals include January 1 of the off year through Election Day.
For congressional races, Figure 2 shows the biggest increase in ad volumes was in Senate races, which saw 2.33 million ad airings in the 2019-2020 election cycle, up from 1.33 million ad airings in the 2017-2018 election cycle and around 1 million airings in the previous three election cycles.
Figure 2: Volume of Television Airings in U.S. House and U.S. Senate Races, 2012-2020
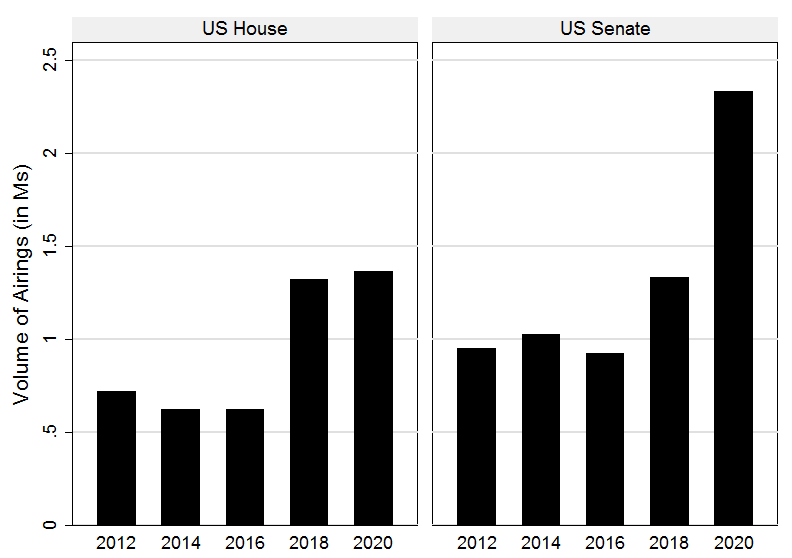
Source: Kantar/CMAG with analysis by the Wesleyan Media Project.
Note: Totals are for the full cycle, from January 1 of the off year through Election Day.
2. Democrats Had Huge Television Ad Advantages
Benefitting from healthy fundraising, Democrats led in advertising in almost every important congressional race—and for the presidency. Figure 3 speaks to advertising in the presidential campaign, showing the volume of ad airings during each week of the campaign (in black) and for ads supporting Biden (in blue dashed) and ads supporting Trump (in red, short and long dashed).
Figure 3: Pro-Biden and pro-Trump Ads by Week, 2020
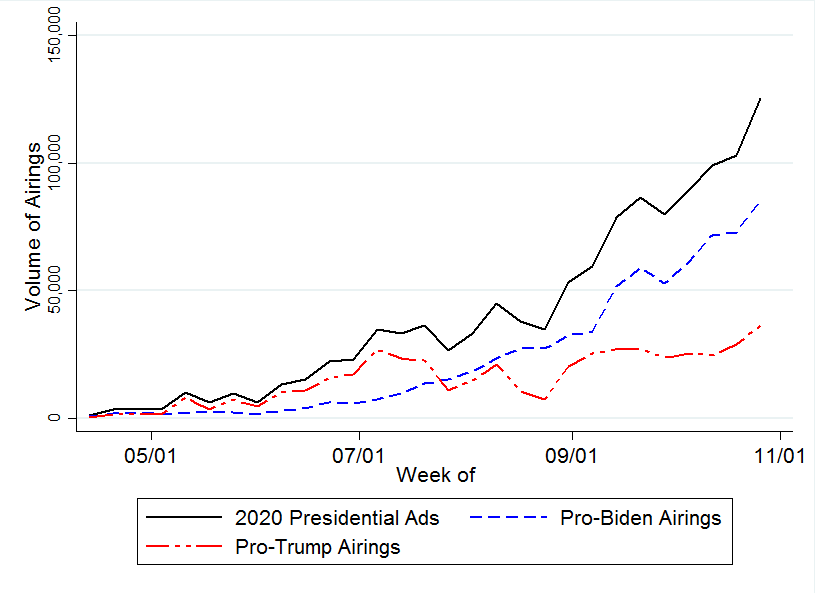
Source: Kantar/CMAG with analysis by the Wesleyan Media Project.
Democratic ad advantages extended to House and Senate races as well, as depicted by Figure 4.
Figure 4: 2020 Democratic Ad Advantages in U.S. Congress, September 1 – Election Day
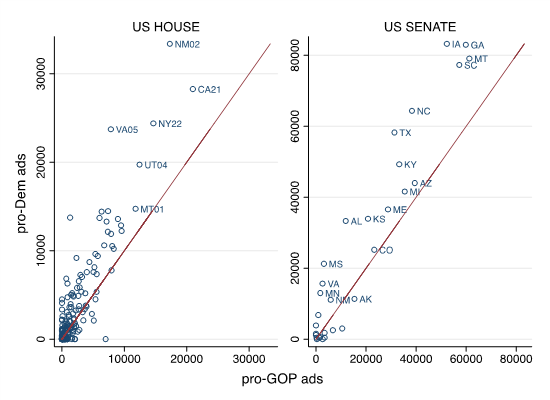
Source: Kantar/CMAG with analysis by the Wesleyan Media Project.
Note: Includes ads from parties and outside groups. Totals for both Georgia races are combined.
3. It Was A Big Year for Digital Advertising
All evidence suggests that digital advertising continued to grow in importance in 2020. Kantar/CMAG estimates $435 million was spent on digital ads in the general election presidential race between April 9 and Election Day (Table 1). That is 24.3 percent of total ad spending. Broadcast television accounted for almost $1 billion in ad spending during the general election—55.2 percent of the total. Local cable ads accounted for another $214 million in spending (12 percent of the total), while national cable buys accounted for $100 million in ad spending in the presidential election, 5.6 percent of the total. Radio and satellite television round out the spending totals.
Table 1: Spending in the 2020 Presidential General Election, April 9 – Election Day
| Media | Totals | Percent of total |
|---|---|---|
| Broadcast TV | $987,320,661 | 55.2% |
| Digital | $434,992,986 | 24.3% |
| Local Cable | $214,408,849 | 12.0% |
| National Cable | $100,940,593 | 5.6% |
| Radio | $40,295,691 | 2.3% |
| Satellite TV | $10,011,912 | 0.6% |
| Total | $1,787,970,692 | |
| Source: Kantar/CMAG with analysis from Wesleyan Media Project. Note: Combines across all sponsors in the presidential race. |
||
4. There Were Fewer Attacks in 2020
The presidential campaign in 2020 was relatively “nice” compared to the past two campaigns (Figure 5). In 2012, 61 percent of the ads between April 9 and Election Day in the presidential race were negative; that is, they were focused solely on the targeted candidate, compared to 52 percent in 2016 and 34 percent in 2020. Likewise, the percentage of positive ads—those focused solely on the favored candidate—rose from 18 percent in 2012, to 25 percent in 2016 and 27 percent in 2020.
Figure 5: Tone of Ads in Presidential Races Over Time, 2012, 2016 and 2020
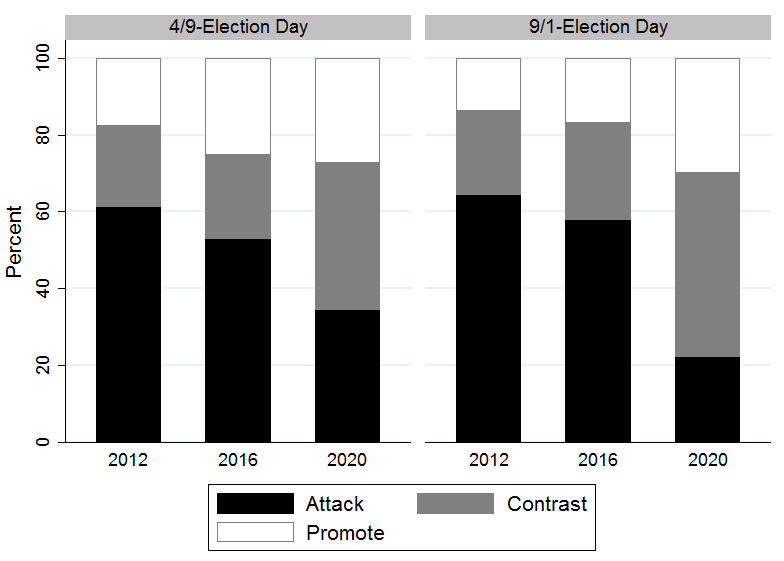
Source: Based on initial Wesleyan Media Project coding of Kantar/CMAG data.
Note: Totals include all sponsors, including outside groups.
Senate ads in 2020 were also slightly less negative than in previous years, though the distribution of the tone of ads was not dramatically different from past years. The percentage of negativity in U.S. House races was up slightly in the 2020 election cycle compared to the past few election cycles (41 percent compared to 32 percent in 2018), but the percentage of positive ads remained consistent (39 percent in 2020 versus 38 percent in 2018).
5. Group Ad Activity Remained High
In the 2020 cycle, outside groups comprised a slightly lower share of total ads in federal races in comparison to elections after 2010, though they still accounted for slightly more than 1 in every 4 election ads aired on broadcast television stations in 2019 and 2020. Figure 6 shows the percentage of group-sponsored ads in federal races in each cycle since 2000 (for all available data in prior cycles).
Figure 6: Group and Party Ads in Federal Races, 2000-2020

Note: Full election cycle (including the off-year totals) are included. Party totals exclude coordinated ads with candidates.
Totals from 2000 include only the top 75 media markets; 2002-2006 are the top 100 markets; 2008-2020 are all 210 media markets.
The slight decline in ad share for outside groups, however, hides the large jump in the total volume of outside group ads in 2020. All told, outside groups sponsored over 1.5 million spots on broadcast television stations this past cycle, which is the highest volume of outside group ads in all of the years of available ad airing data.
Click here for a post summarizing some of WMP’s other recent research.